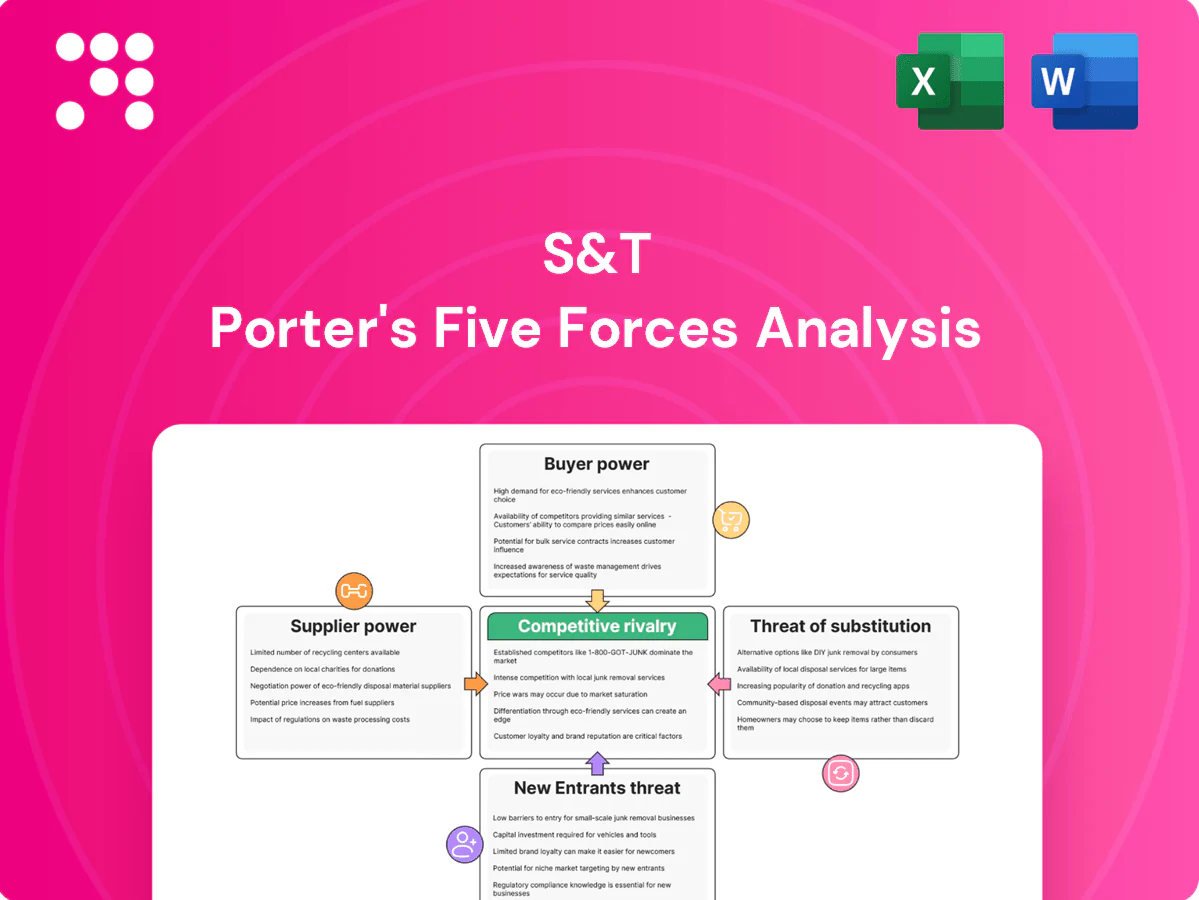
S&T Porter's Five Forces Analysis

Elevate Your Analysis with the Complete Porter's Five Forces Analysis
S&T’s Porter's Five Forces snapshot highlights supplier leverage, buyer power, rivalry intensity, threat of substitutes, and barriers for new entrants to reveal competitive pressure points. It identifies where S&T can defend margins or capture advantage and spots vulnerabilities in the value chain. This brief overview teases strategic implications and risk drivers. Unlock the full Porter's Five Forces Analysis for a force-by-force, data-driven breakdown tailored to S&T.
Suppliers Bargaining Power

Hyperscaler dependency
Hyperscalers (AWS ~32%, Azure ~22%, GCP ~11% in 2024 per Synergy Research) concentrate supplier power for IoT and digital platforms, letting pricing, partner-tier rules and roadmap shifts compress margins or force reskilling (certification exams typically $150–300). Multi-cloud reduces lock-in but adds integration and ops complexity. Co-selling, marketplace incentives and volume commitments can rebalance economics when scale thresholds are met.
Semiconductor & device vendors
IoT edge solutions depend on chipsets, sensors and industrial PCs where the top five vendors control roughly 70% of 2024 shipments, concentrating supplier power. Supply volatility pushed typical lead times to about 12–20 weeks in 2024, raising costs and delivery risk. Preferred-partner status and design standardization commonly secure 5–15% discounts. Long-term sourcing and 3–6 months of buffer inventory are used to reduce exposure.

Niche software licensors
Specialized OT/SCADA, cybersecurity and analytics tools are concentrated among a few licensors, with the top 5 vendors often controlling over 50% of enterprise deployments, increasing supplier leverage. Per-seat and usage pricing shifts costs to OPEX and can raise total cost by 20–40% on large deployments. Building proprietary accelerators and open-source stacks restores negotiation power. Joint go-to-market with ISVs secures better commercial terms and roadmap influence.

Talent as a supplier
- High scarcity: specialized talent
- Wage inflation: ~6–9% (2024)
- Attrition: ~18–22% (2024)
- Mitigants: nearshore, academies, internal upskilling
- Strategic levers: employer brand, career pathways
Compliance and telecom partners
- Certification fees: 10,000–100,000 USD
- Typical SLA uptime: 99.95%+
- Bundled discounts: up to 20%
- Pre-certified templates: reduce validation time by months
Hyperscalers own 65%+; chips, talent and carriers squeeze margins
Suppliers wield concentrated power: hyperscalers (AWS 32%, Azure 22%, GCP 11% in 2024) and top‑5 chip/sensor vendors (~70% shipments) compress margins; talent wage inflation (6–9%) and attrition (18–22%) raise costs; carriers enforce 99.95%+ SLAs and certification fees (10,000–100,000 USD). Volume commitments, co-sell, design standardization and internal upskilling mitigate leverage.
| Metric | 2024 |
|---|---|
| AWS/Azure/GCP | 32%/22%/11% |
| Top‑5 chip vendors | ~70% shipments |
| Wage inflation | 6–9% |
| Attrition | 18–22% |
| SLA | 99.95%+ |
| Cert fees | 10k–100k USD |
What is included in the product
 Detailed Word Document
Tailored Porter's Five Forces analysis for S&T that uncovers key drivers of competition, supplier and buyer power, entry barriers and substitutes, highlights disruptive threats, and delivers strategic commentary in an editable Word format for investor decks, business plans, and internal strategy use.

 Customizable Excel Spreadsheet
Clear, one-sheet Porter's Five Forces for S&T—instantly pinpoints competitive pain points and relief strategies, with customizable pressure levels and a ready-made spider chart for fast strategic decisions.
Customers Bargaining Power

Diverse enterprise clients
Diverse enterprise clients in manufacturing, retail and the public sector are large, professionalized and price-aware, running competitive RFPs and demanding measurable ROI; 2024 global IT spending (~$5.3 trillion) underscores their purchasing scale. Volume and multi-year deals materially boost their leverage, though strong referenceability and footprint expansion can justify premium pricing.
Solution comparability
Services are often seen as comparable, driving intense price pressure as buyers pit vendors against each other; with the global IT services market surpassing $1 trillion in 2024, competition is fierce. Detailed SLAs and outcome-based contracts increasingly shift execution and commercial risk onto vendors. Demonstrable vertical IP and deep domain expertise help vendors escape commoditization. Proofs-of-concept and pilots turn decisions toward delivered value rather than rate cards.

Switching costs vary
Embedded OT/IT integrations create moderate-to-high switching costs in factories, with about 60% of manufacturers in 2024 reporting integration-related hurdles to vendor change. Cloud-managed services and SaaS lower friction for certain workloads, enabling faster migrations and pilot swaps. Strong documentation and open standards can ease exit yet increase initial trust and adoption. Long-term managed services generate annuity revenue, often representing 20–40% of vendor contracts, reducing buyer leverage.

Budget cyclicality
Downturn-driven capex freezes and tighter opex scrutiny amplify customer demands for discounts and longer payment terms; public procurement, which accounts for about 12% of GDP in OECD countries, enforces hard price ceilings and low-bid rules. Flexible commercial models — T&M, fixed-price, gainshare — increase win rates by aligning risk and cash flow. Packaging services with hardware/software reframes discussions from hourly rates to total cost of ownership (TCO), aiding retention.
- Capex freezes → higher discount pressure
- OECD public procurement ≈12% of GDP → strict price ceilings
- Flexible models (T&M, fixed, gainshare) → deal retention
- Service+HW/SW → shift focus to TCO
Data sovereignty demands
Clients mandate security, compliance, and data residency, raising vendor obligations and enabling buyers to insist on specific cloud or on‑prem architectures; by 2024 over 130 countries had data protection laws and 62% of enterprises report data residency as a procurement requirement.
- Certified capabilities: command price premiums (often 10–20%)
- Architecture mandates: narrow vendor alternatives
- Transparent governance: reduces objections and rework
Scale and annuity lock-in reshape IT services buying in a $5.3T market
Customers are large, price-aware buyers running competitive RFPs; 2024 global IT spend ~$5.3T and IT services >$1T give them scale, while 20–40% annuity contracts and strong IP reduce buyer leverage.
| Metric | 2024 |
|---|---|
| Global IT spend | $5.3T |
| IT services market | >$1T |
| Annuity revenue | 20–40% |
What You See Is What You Get
S&T Porter's Five Forces Analysis
This preview shows the exact S&T Porter's Five Forces Analysis you'll receive immediately after purchase—no placeholders or mockups. It is the fully formatted, ready-to-use document covering competitive rivalry, supplier and buyer power, threat of entry and substitutes. Once you buy, you'll get instant access to this same file.

Elevate Your Analysis with the Complete Porter's Five Forces Analysis
S&T’s Porter's Five Forces snapshot highlights supplier leverage, buyer power, rivalry intensity, threat of substitutes, and barriers for new entrants to reveal competitive pressure points. It identifies where S&T can defend margins or capture advantage and spots vulnerabilities in the value chain. This brief overview teases strategic implications and risk drivers. Unlock the full Porter's Five Forces Analysis for a force-by-force, data-driven breakdown tailored to S&T.
Suppliers Bargaining Power
Hyperscaler dependency
Hyperscalers (AWS ~32%, Azure ~22%, GCP ~11% in 2024 per Synergy Research) concentrate supplier power for IoT and digital platforms, letting pricing, partner-tier rules and roadmap shifts compress margins or force reskilling (certification exams typically $150–300). Multi-cloud reduces lock-in but adds integration and ops complexity. Co-selling, marketplace incentives and volume commitments can rebalance economics when scale thresholds are met.
Semiconductor & device vendors
IoT edge solutions depend on chipsets, sensors and industrial PCs where the top five vendors control roughly 70% of 2024 shipments, concentrating supplier power. Supply volatility pushed typical lead times to about 12–20 weeks in 2024, raising costs and delivery risk. Preferred-partner status and design standardization commonly secure 5–15% discounts. Long-term sourcing and 3–6 months of buffer inventory are used to reduce exposure.
Niche software licensors
Specialized OT/SCADA, cybersecurity and analytics tools are concentrated among a few licensors, with the top 5 vendors often controlling over 50% of enterprise deployments, increasing supplier leverage. Per-seat and usage pricing shifts costs to OPEX and can raise total cost by 20–40% on large deployments. Building proprietary accelerators and open-source stacks restores negotiation power. Joint go-to-market with ISVs secures better commercial terms and roadmap influence.
Talent as a supplier
- High scarcity: specialized talent
- Wage inflation: ~6–9% (2024)
- Attrition: ~18–22% (2024)
- Mitigants: nearshore, academies, internal upskilling
- Strategic levers: employer brand, career pathways
Compliance and telecom partners
- Certification fees: 10,000–100,000 USD
- Typical SLA uptime: 99.95%+
- Bundled discounts: up to 20%
- Pre-certified templates: reduce validation time by months
Hyperscalers own 65%+; chips, talent and carriers squeeze margins
Suppliers wield concentrated power: hyperscalers (AWS 32%, Azure 22%, GCP 11% in 2024) and top‑5 chip/sensor vendors (~70% shipments) compress margins; talent wage inflation (6–9%) and attrition (18–22%) raise costs; carriers enforce 99.95%+ SLAs and certification fees (10,000–100,000 USD). Volume commitments, co-sell, design standardization and internal upskilling mitigate leverage.
| Metric | 2024 |
|---|---|
| AWS/Azure/GCP | 32%/22%/11% |
| Top‑5 chip vendors | ~70% shipments |
| Wage inflation | 6–9% |
| Attrition | 18–22% |
| SLA | 99.95%+ |
| Cert fees | 10k–100k USD |
What is included in the product
Detailed Word Document
Tailored Porter's Five Forces analysis for S&T that uncovers key drivers of competition, supplier and buyer power, entry barriers and substitutes, highlights disruptive threats, and delivers strategic commentary in an editable Word format for investor decks, business plans, and internal strategy use.
Customizable Excel Spreadsheet
Clear, one-sheet Porter's Five Forces for S&T—instantly pinpoints competitive pain points and relief strategies, with customizable pressure levels and a ready-made spider chart for fast strategic decisions.
Customers Bargaining Power
Diverse enterprise clients
Diverse enterprise clients in manufacturing, retail and the public sector are large, professionalized and price-aware, running competitive RFPs and demanding measurable ROI; 2024 global IT spending (~$5.3 trillion) underscores their purchasing scale. Volume and multi-year deals materially boost their leverage, though strong referenceability and footprint expansion can justify premium pricing.
Solution comparability
Services are often seen as comparable, driving intense price pressure as buyers pit vendors against each other; with the global IT services market surpassing $1 trillion in 2024, competition is fierce. Detailed SLAs and outcome-based contracts increasingly shift execution and commercial risk onto vendors. Demonstrable vertical IP and deep domain expertise help vendors escape commoditization. Proofs-of-concept and pilots turn decisions toward delivered value rather than rate cards.
Switching costs vary
Embedded OT/IT integrations create moderate-to-high switching costs in factories, with about 60% of manufacturers in 2024 reporting integration-related hurdles to vendor change. Cloud-managed services and SaaS lower friction for certain workloads, enabling faster migrations and pilot swaps. Strong documentation and open standards can ease exit yet increase initial trust and adoption. Long-term managed services generate annuity revenue, often representing 20–40% of vendor contracts, reducing buyer leverage.
Budget cyclicality
Downturn-driven capex freezes and tighter opex scrutiny amplify customer demands for discounts and longer payment terms; public procurement, which accounts for about 12% of GDP in OECD countries, enforces hard price ceilings and low-bid rules. Flexible commercial models — T&M, fixed-price, gainshare — increase win rates by aligning risk and cash flow. Packaging services with hardware/software reframes discussions from hourly rates to total cost of ownership (TCO), aiding retention.
- Capex freezes → higher discount pressure
- OECD public procurement ≈12% of GDP → strict price ceilings
- Flexible models (T&M, fixed, gainshare) → deal retention
- Service+HW/SW → shift focus to TCO
Data sovereignty demands
Clients mandate security, compliance, and data residency, raising vendor obligations and enabling buyers to insist on specific cloud or on‑prem architectures; by 2024 over 130 countries had data protection laws and 62% of enterprises report data residency as a procurement requirement.
- Certified capabilities: command price premiums (often 10–20%)
- Architecture mandates: narrow vendor alternatives
- Transparent governance: reduces objections and rework
Scale and annuity lock-in reshape IT services buying in a $5.3T market
Customers are large, price-aware buyers running competitive RFPs; 2024 global IT spend ~$5.3T and IT services >$1T give them scale, while 20–40% annuity contracts and strong IP reduce buyer leverage.
| Metric | 2024 |
|---|---|
| Global IT spend | $5.3T |
| IT services market | >$1T |
| Annuity revenue | 20–40% |
What You See Is What You Get
S&T Porter's Five Forces Analysis
This preview shows the exact S&T Porter's Five Forces Analysis you'll receive immediately after purchase—no placeholders or mockups. It is the fully formatted, ready-to-use document covering competitive rivalry, supplier and buyer power, threat of entry and substitutes. Once you buy, you'll get instant access to this same file.
Description
Elevate Your Analysis with the Complete Porter's Five Forces Analysis
S&T’s Porter's Five Forces snapshot highlights supplier leverage, buyer power, rivalry intensity, threat of substitutes, and barriers for new entrants to reveal competitive pressure points. It identifies where S&T can defend margins or capture advantage and spots vulnerabilities in the value chain. This brief overview teases strategic implications and risk drivers. Unlock the full Porter's Five Forces Analysis for a force-by-force, data-driven breakdown tailored to S&T.
Suppliers Bargaining Power
Hyperscaler dependency
Hyperscalers (AWS ~32%, Azure ~22%, GCP ~11% in 2024 per Synergy Research) concentrate supplier power for IoT and digital platforms, letting pricing, partner-tier rules and roadmap shifts compress margins or force reskilling (certification exams typically $150–300). Multi-cloud reduces lock-in but adds integration and ops complexity. Co-selling, marketplace incentives and volume commitments can rebalance economics when scale thresholds are met.
Semiconductor & device vendors
IoT edge solutions depend on chipsets, sensors and industrial PCs where the top five vendors control roughly 70% of 2024 shipments, concentrating supplier power. Supply volatility pushed typical lead times to about 12–20 weeks in 2024, raising costs and delivery risk. Preferred-partner status and design standardization commonly secure 5–15% discounts. Long-term sourcing and 3–6 months of buffer inventory are used to reduce exposure.
Niche software licensors
Specialized OT/SCADA, cybersecurity and analytics tools are concentrated among a few licensors, with the top 5 vendors often controlling over 50% of enterprise deployments, increasing supplier leverage. Per-seat and usage pricing shifts costs to OPEX and can raise total cost by 20–40% on large deployments. Building proprietary accelerators and open-source stacks restores negotiation power. Joint go-to-market with ISVs secures better commercial terms and roadmap influence.
Talent as a supplier
- High scarcity: specialized talent
- Wage inflation: ~6–9% (2024)
- Attrition: ~18–22% (2024)
- Mitigants: nearshore, academies, internal upskilling
- Strategic levers: employer brand, career pathways
Compliance and telecom partners
- Certification fees: 10,000–100,000 USD
- Typical SLA uptime: 99.95%+
- Bundled discounts: up to 20%
- Pre-certified templates: reduce validation time by months
Hyperscalers own 65%+; chips, talent and carriers squeeze margins
Suppliers wield concentrated power: hyperscalers (AWS 32%, Azure 22%, GCP 11% in 2024) and top‑5 chip/sensor vendors (~70% shipments) compress margins; talent wage inflation (6–9%) and attrition (18–22%) raise costs; carriers enforce 99.95%+ SLAs and certification fees (10,000–100,000 USD). Volume commitments, co-sell, design standardization and internal upskilling mitigate leverage.
| Metric | 2024 |
|---|---|
| AWS/Azure/GCP | 32%/22%/11% |
| Top‑5 chip vendors | ~70% shipments |
| Wage inflation | 6–9% |
| Attrition | 18–22% |
| SLA | 99.95%+ |
| Cert fees | 10k–100k USD |
What is included in the product
Detailed Word Document
Tailored Porter's Five Forces analysis for S&T that uncovers key drivers of competition, supplier and buyer power, entry barriers and substitutes, highlights disruptive threats, and delivers strategic commentary in an editable Word format for investor decks, business plans, and internal strategy use.
Customizable Excel Spreadsheet
Clear, one-sheet Porter's Five Forces for S&T—instantly pinpoints competitive pain points and relief strategies, with customizable pressure levels and a ready-made spider chart for fast strategic decisions.
Customers Bargaining Power
Diverse enterprise clients
Diverse enterprise clients in manufacturing, retail and the public sector are large, professionalized and price-aware, running competitive RFPs and demanding measurable ROI; 2024 global IT spending (~$5.3 trillion) underscores their purchasing scale. Volume and multi-year deals materially boost their leverage, though strong referenceability and footprint expansion can justify premium pricing.
Solution comparability
Services are often seen as comparable, driving intense price pressure as buyers pit vendors against each other; with the global IT services market surpassing $1 trillion in 2024, competition is fierce. Detailed SLAs and outcome-based contracts increasingly shift execution and commercial risk onto vendors. Demonstrable vertical IP and deep domain expertise help vendors escape commoditization. Proofs-of-concept and pilots turn decisions toward delivered value rather than rate cards.
Switching costs vary
Embedded OT/IT integrations create moderate-to-high switching costs in factories, with about 60% of manufacturers in 2024 reporting integration-related hurdles to vendor change. Cloud-managed services and SaaS lower friction for certain workloads, enabling faster migrations and pilot swaps. Strong documentation and open standards can ease exit yet increase initial trust and adoption. Long-term managed services generate annuity revenue, often representing 20–40% of vendor contracts, reducing buyer leverage.
Budget cyclicality
Downturn-driven capex freezes and tighter opex scrutiny amplify customer demands for discounts and longer payment terms; public procurement, which accounts for about 12% of GDP in OECD countries, enforces hard price ceilings and low-bid rules. Flexible commercial models — T&M, fixed-price, gainshare — increase win rates by aligning risk and cash flow. Packaging services with hardware/software reframes discussions from hourly rates to total cost of ownership (TCO), aiding retention.
- Capex freezes → higher discount pressure
- OECD public procurement ≈12% of GDP → strict price ceilings
- Flexible models (T&M, fixed, gainshare) → deal retention
- Service+HW/SW → shift focus to TCO
Data sovereignty demands
Clients mandate security, compliance, and data residency, raising vendor obligations and enabling buyers to insist on specific cloud or on‑prem architectures; by 2024 over 130 countries had data protection laws and 62% of enterprises report data residency as a procurement requirement.
- Certified capabilities: command price premiums (often 10–20%)
- Architecture mandates: narrow vendor alternatives
- Transparent governance: reduces objections and rework
Scale and annuity lock-in reshape IT services buying in a $5.3T market
Customers are large, price-aware buyers running competitive RFPs; 2024 global IT spend ~$5.3T and IT services >$1T give them scale, while 20–40% annuity contracts and strong IP reduce buyer leverage.
| Metric | 2024 |
|---|---|
| Global IT spend | $5.3T |
| IT services market | >$1T |
| Annuity revenue | 20–40% |
What You See Is What You Get
S&T Porter's Five Forces Analysis
This preview shows the exact S&T Porter's Five Forces Analysis you'll receive immediately after purchase—no placeholders or mockups. It is the fully formatted, ready-to-use document covering competitive rivalry, supplier and buyer power, threat of entry and substitutes. Once you buy, you'll get instant access to this same file.











