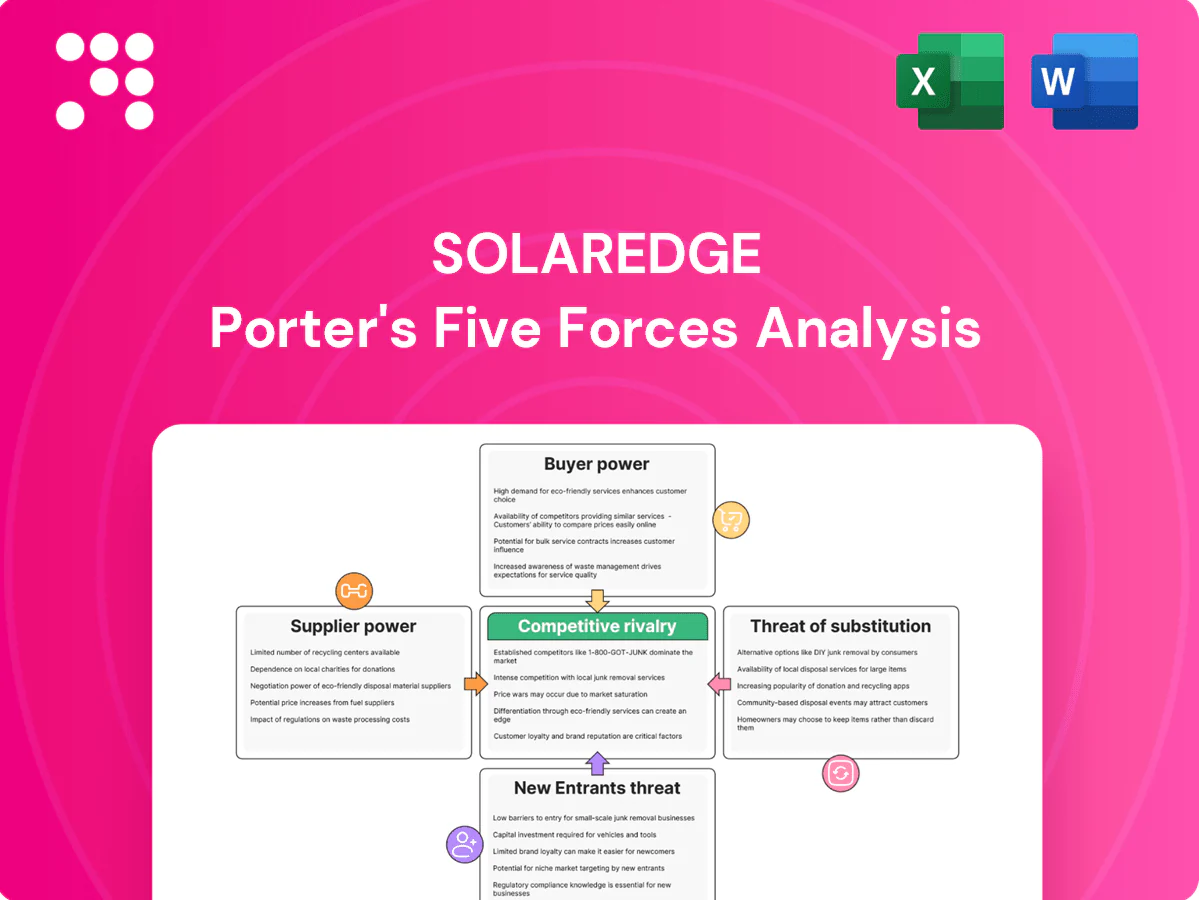
SolarEdge Porter's Five Forces Analysis

Don't Miss the Bigger Picture
SolarEdge faces moderate supplier power, intense rivalry among inverter and storage rivals, rising buyer sophistication, growing threat from vertically integrated competitors and emerging substitutes; regulatory shifts further shape margins. This snapshot highlights critical pressures on its profitability and strategic choices. Unlock the full Porter's Five Forces Analysis to explore force-by-force ratings, visuals, and actionable insights for investment or strategy decisions.
Suppliers Bargaining Power

Concentrated semiconductor inputs
Power optimizers and inverters depend on specialized chips, power MOSFETs/IGBTs and controllers supplied by a limited vendor pool, concentrating supplier power. Capacity tightness and node shortages have driven lead times up to 20 weeks in 2023–24 and periodic price spikes. That concentration increases supplier leverage over SolarEdge. Multi-sourcing and die shrinks mitigate risk but require substantial CAPEX and 12–24 month timelines.
Battery cell dependence for storage
Energy storage SKUs rely on lithium-ion cells from a handful of qualified producers—the top five accounted for roughly 80% of global cell capacity in 2024—concentrating supplier power. Cell prices averaged about $100/kWh in 2024 (BNEF), while chemistry shifts and safety certifications raise switching costs. Qualification cycles of 6–12 months constrain rapid supplier changes, and long‑term offtake contracts often lock in pricing floors.

ODM/EMS capacity and geopolitical risk
In 2024 SolarEdge leverages contract manufacturers (ODM/EMS) to achieve scale and regionalization, relying on third-party factory allocation to meet demand.
Tariff regimes and cross-border logistics disruptions can elevate supplier influence by shifting production economics and delivery timings.
Moving tooling and test lines creates ramp costs and yield risk; nearshoring reduces geopolitical exposure but typically increases unit costs.

Custom magnetics and PCBs
Custom magnetics and multilayer PCBs for SolarEdge are engineered to tight specs, with quality and certification requirements limiting substitution; the global PCB market was about $70B in 2024, underscoring supplier scale but not specialist capacity. Fewer qualified vendors for high-reliability inductors and transformers increases supplier leverage, and lead times spiked to ~16+ weeks during 2021–24 demand surges, enabling suppliers to negotiate better terms. Vendor development programs and dual-sourcing are required to dilute this bargaining power and stabilize pricing and delivery.
- fewer qualified suppliers for high-reliability parts
- global PCB market ≈ $70B (2024)
- lead times ~16+ weeks during 2021–24 spikes
- vendor development/dual-sourcing needed
Firmware, components, and IP entanglement
Firmware, reference designs and proprietary IP create deep technical lock-in for SolarEdge, tying customers to specific component ecosystems and increasing supplier bargaining power. Redesigning around alternate parts risks recertification that can take 6–12 months and delay revenue recognition. Strategic inventory buildup and validated second-source designs were critical hedges during 2024 supply-chain volatility.
- Technical lock-in → higher supplier leverage
- Recertification delay: 6–12 months
- Hedges: strategic inventory, second-source designs
Supply concentration, 16+ week lead times and top-5 cells ≈80% amplify switching costs
Specialized chips, MOSFETs/IGBTs, magnetics and high-reliability PCBs are sourced from few qualified suppliers, giving vendors strong leverage; lead times spiked to ~16+ weeks in 2021–24. Lithium‑ion cells remain concentrated (top 5 ≈80% global capacity in 2024) with avg cell price ≈$100/kWh (2024 BNEF), raising switching costs and recertification delays (6–12 months). SolarEdge mitigates via dual-sourcing, strategic inventory and ODM partnerships.
| Metric | Value (2024) |
|---|---|
| Top‑5 cell share | ≈80% |
| Avg cell price | $100/kWh |
| PCB market | $70B |
| Lead times | ~16+ weeks |
What is included in the product
 Detailed Word Document
Concise Porter’s Five Forces for SolarEdge assessing rivalry from inverter and energy-storage competitors, supplier and buyer power shaping margins, barriers deterring new entrants, and threats from substitutes and technology disruption.

 Customizable Excel Spreadsheet
A concise Porter's Five Forces snapshot for SolarEdge that instantly highlights competitive pressures with an editable spider chart and simplified layout—ideal for fast, boardroom-ready decisions. Swap in current data or duplicate scenarios to model regulation shifts, new entrants, or technology disruption without macros.
Customers Bargaining Power

Installer/EPC price sensitivity
Residential and C&I installers typically run thin margins (often 5–12%), driving aggressive discounting and negotiations with inverter suppliers like SolarEdge. By 2024 PV module spot prices fell to roughly $0.18–0.25/W, shifting buyer focus to BOS and inverter costs and intensifying price pressure. Buyers routinely leverage multiple vendor quotes; suppliers must demonstrate measurable yield uplift, robust warranties (10–25 years) and fast service to avoid commoditization.
Large developers and utilities scale
Utility-scale and large C&I buyers negotiate volume contracts for tens to hundreds of megawatts with rigorous bankability and credit requirements, materially increasing their bargaining power over suppliers like SolarEdge. They routinely demand performance guarantees and liquidated damages tied to availability and output, shifting risk and pressuring margins. Availability of vendor financing and balance-sheet-backed offerings can be decisive, effectively tilting procurement toward suppliers who finance projects and accept long-term performance exposure.

Switching costs via MLPE ecosystem
SolarEdge’s DC-optimized architecture links power optimizers, inverters and monitoring so installed fleets show high stickiness due to hardware compatibility and integrated O&M platforms. Pre-sale buyers retain switching power among architectures, but once systems are live the MLPE ecosystem raises practical switching costs. Demonstrable lifetime LCOE advantages reported in 2024 studies further reduce buyer leverage.

Channel concentration and distributors
In key markets such as the US, Europe and Australia, a handful of national installers and large distributors drive volume, giving buyers notable bargaining power; industry reports in 2024 show the top five US residential installers account for roughly 40–45% of installations, elevating pressure on rebates and payment terms. SolarEdge uses allocation and co-marketing programs to mitigate this, but reliance on concentrated channels increases exposure to demand shocks and margin compression.
- Top-5 US installers ~40–45% share (2024)
- Consolidation ↑ negotiating leverage on rebates/payment terms
- Allocation and co-marketing partially offset leverage
- Overreliance on single channels → higher exposure to shocks
Service, warranty, and uptime expectations
Buyers weigh RMA rates, response times, and monitoring quality alongside price, so SolarEdge’s after-sales performance directly reduces perceived risk and limits price pressure; visible field reliability issues, when reported, increase buyer leverage and can delay procurement decisions.
- RMA focus: trackers on return/repair turnaround
- Uptime: monitoring quality equals operational confidence
- After-sales lowers price sensitivity
- Transparency restores loyalty
PV $0.18–0.25/W squeezes margins; top installers 40–45%
Buyers exert strong price pressure: installer margins 5–12% and PV spot prices ~0.18–0.25/W in 2024 push focus to BOS/inverter costs; top‑5 US installers account for ~40–45% of residential volume. Utility buyers demand bankability, performance guarantees and financing, raising leverage. SolarEdge’s MLPE stickiness, long warranties (10–25y) and low LCOE reduce switching.
| Metric | 2024 Value |
|---|---|
| Top‑5 US installers share | 40–45% |
| PV spot price | $0.18–0.25/W |
| Installer margins | 5–12% |
What You See Is What You Get
SolarEdge Porter's Five Forces Analysis
This preview shows the exact SolarEdge Porter's Five Forces Analysis you'll receive immediately after purchase—no placeholders or mockups. The file is fully formatted, professionally written, and ready for download and use the moment you buy. What you see is what you get.

Don't Miss the Bigger Picture
SolarEdge faces moderate supplier power, intense rivalry among inverter and storage rivals, rising buyer sophistication, growing threat from vertically integrated competitors and emerging substitutes; regulatory shifts further shape margins. This snapshot highlights critical pressures on its profitability and strategic choices. Unlock the full Porter's Five Forces Analysis to explore force-by-force ratings, visuals, and actionable insights for investment or strategy decisions.
Suppliers Bargaining Power
Concentrated semiconductor inputs
Power optimizers and inverters depend on specialized chips, power MOSFETs/IGBTs and controllers supplied by a limited vendor pool, concentrating supplier power. Capacity tightness and node shortages have driven lead times up to 20 weeks in 2023–24 and periodic price spikes. That concentration increases supplier leverage over SolarEdge. Multi-sourcing and die shrinks mitigate risk but require substantial CAPEX and 12–24 month timelines.
Battery cell dependence for storage
Energy storage SKUs rely on lithium-ion cells from a handful of qualified producers—the top five accounted for roughly 80% of global cell capacity in 2024—concentrating supplier power. Cell prices averaged about $100/kWh in 2024 (BNEF), while chemistry shifts and safety certifications raise switching costs. Qualification cycles of 6–12 months constrain rapid supplier changes, and long‑term offtake contracts often lock in pricing floors.
ODM/EMS capacity and geopolitical risk
In 2024 SolarEdge leverages contract manufacturers (ODM/EMS) to achieve scale and regionalization, relying on third-party factory allocation to meet demand.
Tariff regimes and cross-border logistics disruptions can elevate supplier influence by shifting production economics and delivery timings.
Moving tooling and test lines creates ramp costs and yield risk; nearshoring reduces geopolitical exposure but typically increases unit costs.
Custom magnetics and PCBs
Custom magnetics and multilayer PCBs for SolarEdge are engineered to tight specs, with quality and certification requirements limiting substitution; the global PCB market was about $70B in 2024, underscoring supplier scale but not specialist capacity. Fewer qualified vendors for high-reliability inductors and transformers increases supplier leverage, and lead times spiked to ~16+ weeks during 2021–24 demand surges, enabling suppliers to negotiate better terms. Vendor development programs and dual-sourcing are required to dilute this bargaining power and stabilize pricing and delivery.
- fewer qualified suppliers for high-reliability parts
- global PCB market ≈ $70B (2024)
- lead times ~16+ weeks during 2021–24 spikes
- vendor development/dual-sourcing needed
Firmware, components, and IP entanglement
Firmware, reference designs and proprietary IP create deep technical lock-in for SolarEdge, tying customers to specific component ecosystems and increasing supplier bargaining power. Redesigning around alternate parts risks recertification that can take 6–12 months and delay revenue recognition. Strategic inventory buildup and validated second-source designs were critical hedges during 2024 supply-chain volatility.
- Technical lock-in → higher supplier leverage
- Recertification delay: 6–12 months
- Hedges: strategic inventory, second-source designs
Supply concentration, 16+ week lead times and top-5 cells ≈80% amplify switching costs
Specialized chips, MOSFETs/IGBTs, magnetics and high-reliability PCBs are sourced from few qualified suppliers, giving vendors strong leverage; lead times spiked to ~16+ weeks in 2021–24. Lithium‑ion cells remain concentrated (top 5 ≈80% global capacity in 2024) with avg cell price ≈$100/kWh (2024 BNEF), raising switching costs and recertification delays (6–12 months). SolarEdge mitigates via dual-sourcing, strategic inventory and ODM partnerships.
| Metric | Value (2024) |
|---|---|
| Top‑5 cell share | ≈80% |
| Avg cell price | $100/kWh |
| PCB market | $70B |
| Lead times | ~16+ weeks |
What is included in the product
Detailed Word Document
Concise Porter’s Five Forces for SolarEdge assessing rivalry from inverter and energy-storage competitors, supplier and buyer power shaping margins, barriers deterring new entrants, and threats from substitutes and technology disruption.
Customizable Excel Spreadsheet
A concise Porter's Five Forces snapshot for SolarEdge that instantly highlights competitive pressures with an editable spider chart and simplified layout—ideal for fast, boardroom-ready decisions. Swap in current data or duplicate scenarios to model regulation shifts, new entrants, or technology disruption without macros.
Customers Bargaining Power
Installer/EPC price sensitivity
Residential and C&I installers typically run thin margins (often 5–12%), driving aggressive discounting and negotiations with inverter suppliers like SolarEdge. By 2024 PV module spot prices fell to roughly $0.18–0.25/W, shifting buyer focus to BOS and inverter costs and intensifying price pressure. Buyers routinely leverage multiple vendor quotes; suppliers must demonstrate measurable yield uplift, robust warranties (10–25 years) and fast service to avoid commoditization.
Large developers and utilities scale
Utility-scale and large C&I buyers negotiate volume contracts for tens to hundreds of megawatts with rigorous bankability and credit requirements, materially increasing their bargaining power over suppliers like SolarEdge. They routinely demand performance guarantees and liquidated damages tied to availability and output, shifting risk and pressuring margins. Availability of vendor financing and balance-sheet-backed offerings can be decisive, effectively tilting procurement toward suppliers who finance projects and accept long-term performance exposure.
Switching costs via MLPE ecosystem
SolarEdge’s DC-optimized architecture links power optimizers, inverters and monitoring so installed fleets show high stickiness due to hardware compatibility and integrated O&M platforms. Pre-sale buyers retain switching power among architectures, but once systems are live the MLPE ecosystem raises practical switching costs. Demonstrable lifetime LCOE advantages reported in 2024 studies further reduce buyer leverage.
Channel concentration and distributors
In key markets such as the US, Europe and Australia, a handful of national installers and large distributors drive volume, giving buyers notable bargaining power; industry reports in 2024 show the top five US residential installers account for roughly 40–45% of installations, elevating pressure on rebates and payment terms. SolarEdge uses allocation and co-marketing programs to mitigate this, but reliance on concentrated channels increases exposure to demand shocks and margin compression.
- Top-5 US installers ~40–45% share (2024)
- Consolidation ↑ negotiating leverage on rebates/payment terms
- Allocation and co-marketing partially offset leverage
- Overreliance on single channels → higher exposure to shocks
Service, warranty, and uptime expectations
Buyers weigh RMA rates, response times, and monitoring quality alongside price, so SolarEdge’s after-sales performance directly reduces perceived risk and limits price pressure; visible field reliability issues, when reported, increase buyer leverage and can delay procurement decisions.
- RMA focus: trackers on return/repair turnaround
- Uptime: monitoring quality equals operational confidence
- After-sales lowers price sensitivity
- Transparency restores loyalty
PV $0.18–0.25/W squeezes margins; top installers 40–45%
Buyers exert strong price pressure: installer margins 5–12% and PV spot prices ~0.18–0.25/W in 2024 push focus to BOS/inverter costs; top‑5 US installers account for ~40–45% of residential volume. Utility buyers demand bankability, performance guarantees and financing, raising leverage. SolarEdge’s MLPE stickiness, long warranties (10–25y) and low LCOE reduce switching.
| Metric | 2024 Value |
|---|---|
| Top‑5 US installers share | 40–45% |
| PV spot price | $0.18–0.25/W |
| Installer margins | 5–12% |
What You See Is What You Get
SolarEdge Porter's Five Forces Analysis
This preview shows the exact SolarEdge Porter's Five Forces Analysis you'll receive immediately after purchase—no placeholders or mockups. The file is fully formatted, professionally written, and ready for download and use the moment you buy. What you see is what you get.
Original: $10.00
-65%$10.00
$3.50Description
Don't Miss the Bigger Picture
SolarEdge faces moderate supplier power, intense rivalry among inverter and storage rivals, rising buyer sophistication, growing threat from vertically integrated competitors and emerging substitutes; regulatory shifts further shape margins. This snapshot highlights critical pressures on its profitability and strategic choices. Unlock the full Porter's Five Forces Analysis to explore force-by-force ratings, visuals, and actionable insights for investment or strategy decisions.
Suppliers Bargaining Power
Concentrated semiconductor inputs
Power optimizers and inverters depend on specialized chips, power MOSFETs/IGBTs and controllers supplied by a limited vendor pool, concentrating supplier power. Capacity tightness and node shortages have driven lead times up to 20 weeks in 2023–24 and periodic price spikes. That concentration increases supplier leverage over SolarEdge. Multi-sourcing and die shrinks mitigate risk but require substantial CAPEX and 12–24 month timelines.
Battery cell dependence for storage
Energy storage SKUs rely on lithium-ion cells from a handful of qualified producers—the top five accounted for roughly 80% of global cell capacity in 2024—concentrating supplier power. Cell prices averaged about $100/kWh in 2024 (BNEF), while chemistry shifts and safety certifications raise switching costs. Qualification cycles of 6–12 months constrain rapid supplier changes, and long‑term offtake contracts often lock in pricing floors.
ODM/EMS capacity and geopolitical risk
In 2024 SolarEdge leverages contract manufacturers (ODM/EMS) to achieve scale and regionalization, relying on third-party factory allocation to meet demand.
Tariff regimes and cross-border logistics disruptions can elevate supplier influence by shifting production economics and delivery timings.
Moving tooling and test lines creates ramp costs and yield risk; nearshoring reduces geopolitical exposure but typically increases unit costs.
Custom magnetics and PCBs
Custom magnetics and multilayer PCBs for SolarEdge are engineered to tight specs, with quality and certification requirements limiting substitution; the global PCB market was about $70B in 2024, underscoring supplier scale but not specialist capacity. Fewer qualified vendors for high-reliability inductors and transformers increases supplier leverage, and lead times spiked to ~16+ weeks during 2021–24 demand surges, enabling suppliers to negotiate better terms. Vendor development programs and dual-sourcing are required to dilute this bargaining power and stabilize pricing and delivery.
- fewer qualified suppliers for high-reliability parts
- global PCB market ≈ $70B (2024)
- lead times ~16+ weeks during 2021–24 spikes
- vendor development/dual-sourcing needed
Firmware, components, and IP entanglement
Firmware, reference designs and proprietary IP create deep technical lock-in for SolarEdge, tying customers to specific component ecosystems and increasing supplier bargaining power. Redesigning around alternate parts risks recertification that can take 6–12 months and delay revenue recognition. Strategic inventory buildup and validated second-source designs were critical hedges during 2024 supply-chain volatility.
- Technical lock-in → higher supplier leverage
- Recertification delay: 6–12 months
- Hedges: strategic inventory, second-source designs
Supply concentration, 16+ week lead times and top-5 cells ≈80% amplify switching costs
Specialized chips, MOSFETs/IGBTs, magnetics and high-reliability PCBs are sourced from few qualified suppliers, giving vendors strong leverage; lead times spiked to ~16+ weeks in 2021–24. Lithium‑ion cells remain concentrated (top 5 ≈80% global capacity in 2024) with avg cell price ≈$100/kWh (2024 BNEF), raising switching costs and recertification delays (6–12 months). SolarEdge mitigates via dual-sourcing, strategic inventory and ODM partnerships.
| Metric | Value (2024) |
|---|---|
| Top‑5 cell share | ≈80% |
| Avg cell price | $100/kWh |
| PCB market | $70B |
| Lead times | ~16+ weeks |
What is included in the product
Detailed Word Document
Concise Porter’s Five Forces for SolarEdge assessing rivalry from inverter and energy-storage competitors, supplier and buyer power shaping margins, barriers deterring new entrants, and threats from substitutes and technology disruption.
Customizable Excel Spreadsheet
A concise Porter's Five Forces snapshot for SolarEdge that instantly highlights competitive pressures with an editable spider chart and simplified layout—ideal for fast, boardroom-ready decisions. Swap in current data or duplicate scenarios to model regulation shifts, new entrants, or technology disruption without macros.
Customers Bargaining Power
Installer/EPC price sensitivity
Residential and C&I installers typically run thin margins (often 5–12%), driving aggressive discounting and negotiations with inverter suppliers like SolarEdge. By 2024 PV module spot prices fell to roughly $0.18–0.25/W, shifting buyer focus to BOS and inverter costs and intensifying price pressure. Buyers routinely leverage multiple vendor quotes; suppliers must demonstrate measurable yield uplift, robust warranties (10–25 years) and fast service to avoid commoditization.
Large developers and utilities scale
Utility-scale and large C&I buyers negotiate volume contracts for tens to hundreds of megawatts with rigorous bankability and credit requirements, materially increasing their bargaining power over suppliers like SolarEdge. They routinely demand performance guarantees and liquidated damages tied to availability and output, shifting risk and pressuring margins. Availability of vendor financing and balance-sheet-backed offerings can be decisive, effectively tilting procurement toward suppliers who finance projects and accept long-term performance exposure.
Switching costs via MLPE ecosystem
SolarEdge’s DC-optimized architecture links power optimizers, inverters and monitoring so installed fleets show high stickiness due to hardware compatibility and integrated O&M platforms. Pre-sale buyers retain switching power among architectures, but once systems are live the MLPE ecosystem raises practical switching costs. Demonstrable lifetime LCOE advantages reported in 2024 studies further reduce buyer leverage.
Channel concentration and distributors
In key markets such as the US, Europe and Australia, a handful of national installers and large distributors drive volume, giving buyers notable bargaining power; industry reports in 2024 show the top five US residential installers account for roughly 40–45% of installations, elevating pressure on rebates and payment terms. SolarEdge uses allocation and co-marketing programs to mitigate this, but reliance on concentrated channels increases exposure to demand shocks and margin compression.
- Top-5 US installers ~40–45% share (2024)
- Consolidation ↑ negotiating leverage on rebates/payment terms
- Allocation and co-marketing partially offset leverage
- Overreliance on single channels → higher exposure to shocks
Service, warranty, and uptime expectations
Buyers weigh RMA rates, response times, and monitoring quality alongside price, so SolarEdge’s after-sales performance directly reduces perceived risk and limits price pressure; visible field reliability issues, when reported, increase buyer leverage and can delay procurement decisions.
- RMA focus: trackers on return/repair turnaround
- Uptime: monitoring quality equals operational confidence
- After-sales lowers price sensitivity
- Transparency restores loyalty
PV $0.18–0.25/W squeezes margins; top installers 40–45%
Buyers exert strong price pressure: installer margins 5–12% and PV spot prices ~0.18–0.25/W in 2024 push focus to BOS/inverter costs; top‑5 US installers account for ~40–45% of residential volume. Utility buyers demand bankability, performance guarantees and financing, raising leverage. SolarEdge’s MLPE stickiness, long warranties (10–25y) and low LCOE reduce switching.
| Metric | 2024 Value |
|---|---|
| Top‑5 US installers share | 40–45% |
| PV spot price | $0.18–0.25/W |
| Installer margins | 5–12% |
What You See Is What You Get
SolarEdge Porter's Five Forces Analysis
This preview shows the exact SolarEdge Porter's Five Forces Analysis you'll receive immediately after purchase—no placeholders or mockups. The file is fully formatted, professionally written, and ready for download and use the moment you buy. What you see is what you get.











