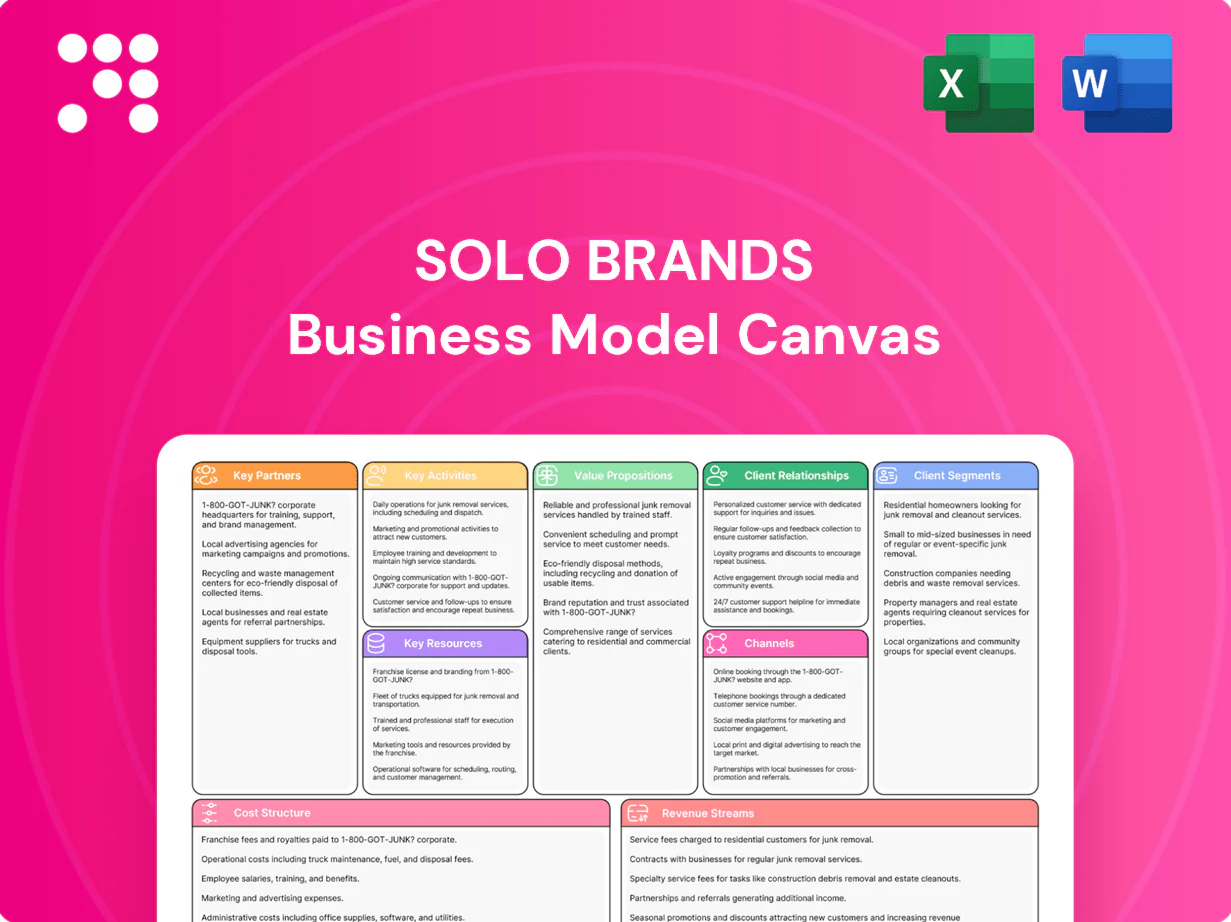
Solo Brands Business Model Canvas

Unlock a concise Business Model Canvas: value props, customer segments, key partners, revenue
Unlock the strategic blueprint behind Solo Brands with our concise Business Model Canvas preview; it outlines core value propositions, customer segments, key partnerships and revenue drivers. Want the full, editable Canvas in Word and Excel? Purchase the complete version for section-by-section insights, financial implications and practical templates to benchmark, plan, and pitch.
Partnerships

Premium material suppliers
Trusted vendors for stainless steel, performance fabrics, and composite materials provide consistent product quality and traceability, supporting Solo Brands’ premium positioning. Long-term contracts signed through 2024 stabilize input costs and secure supply during peak seasons such as Q3 holiday ramps. Collaborative R&D with suppliers yields proprietary finishes and lighter, stronger components that improve unit economics. Geographic supplier diversification reduces disruption risk across sourcing regions.
Contract manufacturers and assemblers
Specialized contract manufacturers produce Solo fire pits, apparel, kayaks and paddle boards to spec at scale, enabling SKU launches with flexible capacity that scales up to threefold for seasonal spikes and new-product ramps. Rigorous quality assurance programs and third-party audits keep defect rates under 0.5% on audited lines. Nearshoring options cut lead times by ~40% and improve working-capital turns by roughly 20% versus distant sourcing models.

Retail and wholesale partners
Select outdoor specialty retailers, big-box chains, and premium boutiques extend Solo Brands beyond DTC, tapping channels that accounted for roughly 80% of U.S. retail sales in 2024 per U.S. Census estimates. Retail partners provide showroom experiences crucial for high-consideration items, improving conversion versus online-only touchpoints. Co-op marketing and shared merchandising data boost sell-through and inventory efficiency. Limited distribution preserves premium positioning and protects margins.

Logistics, 3PL, and fulfillment networks
Regional 3PLs and carriers handle big-and-bulky shipments and returns efficiently; distributed fulfillment can cut transit time by up to 2 days and lower shipping costs ~10–20% in industry benchmarks (2024). Freight partners optimize parcel, LTL and international lanes to reduce unit freight spend, while reverse logistics partners streamline warranty, refurbishment and ~15% e‑commerce return flows.
- Regional 3PLs: big/bulky & returns
- Distributed fulfillment: -2 days, -10–20% cost
- Freight: parcel, LTL, international
- Reverse logistics: warranty & refurbishment (~15% returns)
Creators, communities, and event partners
Outdoor influencers, ambassadors, and community organizers amplify Solo Brands storytelling, tapping an influencer market that grew from about $21.2B in 2023 to roughly $26B in 2024, boosting reach and engagement. Event partnerships enable live demos and trials that convert awareness into purchase intent. Content co-creation generates social proof and UGC; nonprofit and park partnerships reinforce stewardship and brand purpose.
- reach: influencer market ~$26B (2024)
- UGC: higher trust and engagement vs. branded posts
- events: live demos drive trial lift
- nonprofits: brand stewardship alignment
Nearshoring cuts lead times 40%, boosts WC turns 20%
Trusted material suppliers and contract manufacturers (long-term contracts through 2024) secure quality (audited defect <0.5%) and proprietary R&D; nearshoring cuts lead times ~40% and boosts WC turns ~20%. Retail partners drove ~80% of U.S. retail sales (2024); 3PLs lower transit ~2 days and freight costs 10–20%; influencer spend ~$26B (2024).
| Partner | Key Metric |
|---|---|
| Suppliers | Contracts 2024, defect <0.5% |
| Manufacturing | Nearshore: -40% LT, +20% WC turns |
| Retail | ~80% US retail sales (2024) |
| Logistics | -2 days transit, -10–20% cost |
| Influencers | Market ~$26B (2024) |
What is included in the product
 Detailed Word Document
A comprehensive, pre-written Business Model Canvas for Solo Brands detailing all nine BMC blocks—customer segments, channels, value propositions, revenue streams, key resources, partners, activities, cost structure and customer relationships—reflecting real-world operations, competitive advantages and linked SWOT analysis; ideal for presentations, investor discussions and validation of strategic decisions.

 Customizable Excel Spreadsheet
High-level view of Solo Brands' business model with editable cells, condensing product, channels, and revenue streams into a single page to quickly relieve strategic ambiguity and save hours of structuring your own model.
Activities

Product design and engineering
In-house design and engineering teams develop Solo Brands' stoves, kayaks, paddle boards and apparel across four core product categories. User-led testing and iterative prototyping, conducted through dozens of field trials annually, refine performance and ease-of-use. Ongoing IP filings with the USPTO protect distinctive designs and mechanisms. Cross-brand knowledge sharing speeds feature innovation across the portfolio.
Brand marketing and community building
Owned content, social campaigns, and ambassador programs drive engagement by creating authentic product storytelling and user-generated momentum across Solo Brands portfolios.
Community events and challenges foster advocacy and repeat use by turning buyers into active brand promoters and increasing purchase frequency.
Performance marketing scales profitable acquisition while CRM and lifecycle programs convert first-time buyers into loyalists through targeted retention and reactivation flows.

Omnichannel merchandising and e-commerce
Optimized PDPs, bundles, and upsells drive higher conversion and can lift AOV ~20% versus single-item buys (2024 industry benchmarks). Seasonal drops and limited editions sustain urgency, often generating 15–25% short-term sales spikes. Retail merchandising enforces consistent premium positioning across channels. Data-driven assortment planning uses demand signals to reduce stockouts and align inventory to real-time demand.

Supply chain planning and quality control
Supply chain planning and S&OP synchronize long-lead components with demand variability, using rolling forecasts and buffer strategies to protect launch windows. Rigorous factory and inbound QA reduces returns and warranty costs through pre-shipment inspections and incoming checks. Vendor scorecards track quality, on-time-in-full and cost metrics to drive continuous improvement while inventory strategies (JIT, bulk pool, drop-ship) manage bulky SKUs without overstock; inventory carrying costs remain ~20–30% annually (2024 estimate).
- Forecasting: rolling S&OP
- Quality: factory + inbound QA
- Vendors: scorecards for OTIF/quality
- Inventory: JIT, bulk pooling, drop-ship
Customer service and warranty management
Multichannel support resolves setup, use, and replacement issues rapidly, enabling same-day responses and reducing escalations; 2024 data show self-service and multichannel care can cut support costs about 30%. Clear warranties and easy returns increase purchase confidence for high-ticket Solo Brands items, with e-commerce return rates around 16% in 2024. Knowledge bases and video guides lower friction and support volume, while systematic feedback loops feed product improvements and SKU revisions.
- Multichannel support — faster resolutions, lower escalations
- Clear warranties + easy returns — trust for high-ticket items
- Knowledge bases/videos — ~30% support cost reduction (2024)
- Feedback loops — direct input for product enhancements
Bundles lift AOV ~20%, drops +15-25%, support -30%
In-house design, iterative field testing and USPTO filings drive product innovation while cross-brand learnings accelerate features. Performance marketing, owned content and community events scale acquisition and loyalty; optimized PDPs, bundles and drops lift AOV ~20% and produce 15–25% short-term spikes. S&OP, QA and vendor scorecards cut stockouts; multichannel support and self-service lower support costs ~30% and e-com returns ~16% (2024).
| Metric | 2024 |
|---|---|
| AOV lift (bundles) | ~20% |
| Sales spikes (drops) | 15–25% |
| Support cost reduction | ~30% |
| E-com return rate | ~16% |
| Inventory carrying cost | 20–30% |
Preview Before You Purchase
Business Model Canvas
The Solo Brands Business Model Canvas you see here is the exact document you’ll receive after purchase, not a mockup or sample. When you complete your order you’ll gain instant access to this same ready-to-edit file, formatted for easy use and presentation. No hidden pages or altered layouts—what’s visible in this preview is representative of the full deliverable.

Unlock a concise Business Model Canvas: value props, customer segments, key partners, revenue
Unlock the strategic blueprint behind Solo Brands with our concise Business Model Canvas preview; it outlines core value propositions, customer segments, key partnerships and revenue drivers. Want the full, editable Canvas in Word and Excel? Purchase the complete version for section-by-section insights, financial implications and practical templates to benchmark, plan, and pitch.
Partnerships
Premium material suppliers
Trusted vendors for stainless steel, performance fabrics, and composite materials provide consistent product quality and traceability, supporting Solo Brands’ premium positioning. Long-term contracts signed through 2024 stabilize input costs and secure supply during peak seasons such as Q3 holiday ramps. Collaborative R&D with suppliers yields proprietary finishes and lighter, stronger components that improve unit economics. Geographic supplier diversification reduces disruption risk across sourcing regions.
Contract manufacturers and assemblers
Specialized contract manufacturers produce Solo fire pits, apparel, kayaks and paddle boards to spec at scale, enabling SKU launches with flexible capacity that scales up to threefold for seasonal spikes and new-product ramps. Rigorous quality assurance programs and third-party audits keep defect rates under 0.5% on audited lines. Nearshoring options cut lead times by ~40% and improve working-capital turns by roughly 20% versus distant sourcing models.
Retail and wholesale partners
Select outdoor specialty retailers, big-box chains, and premium boutiques extend Solo Brands beyond DTC, tapping channels that accounted for roughly 80% of U.S. retail sales in 2024 per U.S. Census estimates. Retail partners provide showroom experiences crucial for high-consideration items, improving conversion versus online-only touchpoints. Co-op marketing and shared merchandising data boost sell-through and inventory efficiency. Limited distribution preserves premium positioning and protects margins.
Logistics, 3PL, and fulfillment networks
Regional 3PLs and carriers handle big-and-bulky shipments and returns efficiently; distributed fulfillment can cut transit time by up to 2 days and lower shipping costs ~10–20% in industry benchmarks (2024). Freight partners optimize parcel, LTL and international lanes to reduce unit freight spend, while reverse logistics partners streamline warranty, refurbishment and ~15% e‑commerce return flows.
- Regional 3PLs: big/bulky & returns
- Distributed fulfillment: -2 days, -10–20% cost
- Freight: parcel, LTL, international
- Reverse logistics: warranty & refurbishment (~15% returns)
Creators, communities, and event partners
Outdoor influencers, ambassadors, and community organizers amplify Solo Brands storytelling, tapping an influencer market that grew from about $21.2B in 2023 to roughly $26B in 2024, boosting reach and engagement. Event partnerships enable live demos and trials that convert awareness into purchase intent. Content co-creation generates social proof and UGC; nonprofit and park partnerships reinforce stewardship and brand purpose.
- reach: influencer market ~$26B (2024)
- UGC: higher trust and engagement vs. branded posts
- events: live demos drive trial lift
- nonprofits: brand stewardship alignment
Nearshoring cuts lead times 40%, boosts WC turns 20%
Trusted material suppliers and contract manufacturers (long-term contracts through 2024) secure quality (audited defect <0.5%) and proprietary R&D; nearshoring cuts lead times ~40% and boosts WC turns ~20%. Retail partners drove ~80% of U.S. retail sales (2024); 3PLs lower transit ~2 days and freight costs 10–20%; influencer spend ~$26B (2024).
| Partner | Key Metric |
|---|---|
| Suppliers | Contracts 2024, defect <0.5% |
| Manufacturing | Nearshore: -40% LT, +20% WC turns |
| Retail | ~80% US retail sales (2024) |
| Logistics | -2 days transit, -10–20% cost |
| Influencers | Market ~$26B (2024) |
What is included in the product
Detailed Word Document
A comprehensive, pre-written Business Model Canvas for Solo Brands detailing all nine BMC blocks—customer segments, channels, value propositions, revenue streams, key resources, partners, activities, cost structure and customer relationships—reflecting real-world operations, competitive advantages and linked SWOT analysis; ideal for presentations, investor discussions and validation of strategic decisions.
Customizable Excel Spreadsheet
High-level view of Solo Brands' business model with editable cells, condensing product, channels, and revenue streams into a single page to quickly relieve strategic ambiguity and save hours of structuring your own model.
Activities
Product design and engineering
In-house design and engineering teams develop Solo Brands' stoves, kayaks, paddle boards and apparel across four core product categories. User-led testing and iterative prototyping, conducted through dozens of field trials annually, refine performance and ease-of-use. Ongoing IP filings with the USPTO protect distinctive designs and mechanisms. Cross-brand knowledge sharing speeds feature innovation across the portfolio.
Brand marketing and community building
Owned content, social campaigns, and ambassador programs drive engagement by creating authentic product storytelling and user-generated momentum across Solo Brands portfolios.
Community events and challenges foster advocacy and repeat use by turning buyers into active brand promoters and increasing purchase frequency.
Performance marketing scales profitable acquisition while CRM and lifecycle programs convert first-time buyers into loyalists through targeted retention and reactivation flows.
Omnichannel merchandising and e-commerce
Optimized PDPs, bundles, and upsells drive higher conversion and can lift AOV ~20% versus single-item buys (2024 industry benchmarks). Seasonal drops and limited editions sustain urgency, often generating 15–25% short-term sales spikes. Retail merchandising enforces consistent premium positioning across channels. Data-driven assortment planning uses demand signals to reduce stockouts and align inventory to real-time demand.
Supply chain planning and quality control
Supply chain planning and S&OP synchronize long-lead components with demand variability, using rolling forecasts and buffer strategies to protect launch windows. Rigorous factory and inbound QA reduces returns and warranty costs through pre-shipment inspections and incoming checks. Vendor scorecards track quality, on-time-in-full and cost metrics to drive continuous improvement while inventory strategies (JIT, bulk pool, drop-ship) manage bulky SKUs without overstock; inventory carrying costs remain ~20–30% annually (2024 estimate).
- Forecasting: rolling S&OP
- Quality: factory + inbound QA
- Vendors: scorecards for OTIF/quality
- Inventory: JIT, bulk pooling, drop-ship
Customer service and warranty management
Multichannel support resolves setup, use, and replacement issues rapidly, enabling same-day responses and reducing escalations; 2024 data show self-service and multichannel care can cut support costs about 30%. Clear warranties and easy returns increase purchase confidence for high-ticket Solo Brands items, with e-commerce return rates around 16% in 2024. Knowledge bases and video guides lower friction and support volume, while systematic feedback loops feed product improvements and SKU revisions.
- Multichannel support — faster resolutions, lower escalations
- Clear warranties + easy returns — trust for high-ticket items
- Knowledge bases/videos — ~30% support cost reduction (2024)
- Feedback loops — direct input for product enhancements
Bundles lift AOV ~20%, drops +15-25%, support -30%
In-house design, iterative field testing and USPTO filings drive product innovation while cross-brand learnings accelerate features. Performance marketing, owned content and community events scale acquisition and loyalty; optimized PDPs, bundles and drops lift AOV ~20% and produce 15–25% short-term spikes. S&OP, QA and vendor scorecards cut stockouts; multichannel support and self-service lower support costs ~30% and e-com returns ~16% (2024).
| Metric | 2024 |
|---|---|
| AOV lift (bundles) | ~20% |
| Sales spikes (drops) | 15–25% |
| Support cost reduction | ~30% |
| E-com return rate | ~16% |
| Inventory carrying cost | 20–30% |
Preview Before You Purchase
Business Model Canvas
The Solo Brands Business Model Canvas you see here is the exact document you’ll receive after purchase, not a mockup or sample. When you complete your order you’ll gain instant access to this same ready-to-edit file, formatted for easy use and presentation. No hidden pages or altered layouts—what’s visible in this preview is representative of the full deliverable.
Original: $10.00
-65%$10.00
$3.50Description
Unlock a concise Business Model Canvas: value props, customer segments, key partners, revenue
Unlock the strategic blueprint behind Solo Brands with our concise Business Model Canvas preview; it outlines core value propositions, customer segments, key partnerships and revenue drivers. Want the full, editable Canvas in Word and Excel? Purchase the complete version for section-by-section insights, financial implications and practical templates to benchmark, plan, and pitch.
Partnerships
Premium material suppliers
Trusted vendors for stainless steel, performance fabrics, and composite materials provide consistent product quality and traceability, supporting Solo Brands’ premium positioning. Long-term contracts signed through 2024 stabilize input costs and secure supply during peak seasons such as Q3 holiday ramps. Collaborative R&D with suppliers yields proprietary finishes and lighter, stronger components that improve unit economics. Geographic supplier diversification reduces disruption risk across sourcing regions.
Contract manufacturers and assemblers
Specialized contract manufacturers produce Solo fire pits, apparel, kayaks and paddle boards to spec at scale, enabling SKU launches with flexible capacity that scales up to threefold for seasonal spikes and new-product ramps. Rigorous quality assurance programs and third-party audits keep defect rates under 0.5% on audited lines. Nearshoring options cut lead times by ~40% and improve working-capital turns by roughly 20% versus distant sourcing models.
Retail and wholesale partners
Select outdoor specialty retailers, big-box chains, and premium boutiques extend Solo Brands beyond DTC, tapping channels that accounted for roughly 80% of U.S. retail sales in 2024 per U.S. Census estimates. Retail partners provide showroom experiences crucial for high-consideration items, improving conversion versus online-only touchpoints. Co-op marketing and shared merchandising data boost sell-through and inventory efficiency. Limited distribution preserves premium positioning and protects margins.
Logistics, 3PL, and fulfillment networks
Regional 3PLs and carriers handle big-and-bulky shipments and returns efficiently; distributed fulfillment can cut transit time by up to 2 days and lower shipping costs ~10–20% in industry benchmarks (2024). Freight partners optimize parcel, LTL and international lanes to reduce unit freight spend, while reverse logistics partners streamline warranty, refurbishment and ~15% e‑commerce return flows.
- Regional 3PLs: big/bulky & returns
- Distributed fulfillment: -2 days, -10–20% cost
- Freight: parcel, LTL, international
- Reverse logistics: warranty & refurbishment (~15% returns)
Creators, communities, and event partners
Outdoor influencers, ambassadors, and community organizers amplify Solo Brands storytelling, tapping an influencer market that grew from about $21.2B in 2023 to roughly $26B in 2024, boosting reach and engagement. Event partnerships enable live demos and trials that convert awareness into purchase intent. Content co-creation generates social proof and UGC; nonprofit and park partnerships reinforce stewardship and brand purpose.
- reach: influencer market ~$26B (2024)
- UGC: higher trust and engagement vs. branded posts
- events: live demos drive trial lift
- nonprofits: brand stewardship alignment
Nearshoring cuts lead times 40%, boosts WC turns 20%
Trusted material suppliers and contract manufacturers (long-term contracts through 2024) secure quality (audited defect <0.5%) and proprietary R&D; nearshoring cuts lead times ~40% and boosts WC turns ~20%. Retail partners drove ~80% of U.S. retail sales (2024); 3PLs lower transit ~2 days and freight costs 10–20%; influencer spend ~$26B (2024).
| Partner | Key Metric |
|---|---|
| Suppliers | Contracts 2024, defect <0.5% |
| Manufacturing | Nearshore: -40% LT, +20% WC turns |
| Retail | ~80% US retail sales (2024) |
| Logistics | -2 days transit, -10–20% cost |
| Influencers | Market ~$26B (2024) |
What is included in the product
Detailed Word Document
A comprehensive, pre-written Business Model Canvas for Solo Brands detailing all nine BMC blocks—customer segments, channels, value propositions, revenue streams, key resources, partners, activities, cost structure and customer relationships—reflecting real-world operations, competitive advantages and linked SWOT analysis; ideal for presentations, investor discussions and validation of strategic decisions.
Customizable Excel Spreadsheet
High-level view of Solo Brands' business model with editable cells, condensing product, channels, and revenue streams into a single page to quickly relieve strategic ambiguity and save hours of structuring your own model.
Activities
Product design and engineering
In-house design and engineering teams develop Solo Brands' stoves, kayaks, paddle boards and apparel across four core product categories. User-led testing and iterative prototyping, conducted through dozens of field trials annually, refine performance and ease-of-use. Ongoing IP filings with the USPTO protect distinctive designs and mechanisms. Cross-brand knowledge sharing speeds feature innovation across the portfolio.
Brand marketing and community building
Owned content, social campaigns, and ambassador programs drive engagement by creating authentic product storytelling and user-generated momentum across Solo Brands portfolios.
Community events and challenges foster advocacy and repeat use by turning buyers into active brand promoters and increasing purchase frequency.
Performance marketing scales profitable acquisition while CRM and lifecycle programs convert first-time buyers into loyalists through targeted retention and reactivation flows.
Omnichannel merchandising and e-commerce
Optimized PDPs, bundles, and upsells drive higher conversion and can lift AOV ~20% versus single-item buys (2024 industry benchmarks). Seasonal drops and limited editions sustain urgency, often generating 15–25% short-term sales spikes. Retail merchandising enforces consistent premium positioning across channels. Data-driven assortment planning uses demand signals to reduce stockouts and align inventory to real-time demand.
Supply chain planning and quality control
Supply chain planning and S&OP synchronize long-lead components with demand variability, using rolling forecasts and buffer strategies to protect launch windows. Rigorous factory and inbound QA reduces returns and warranty costs through pre-shipment inspections and incoming checks. Vendor scorecards track quality, on-time-in-full and cost metrics to drive continuous improvement while inventory strategies (JIT, bulk pool, drop-ship) manage bulky SKUs without overstock; inventory carrying costs remain ~20–30% annually (2024 estimate).
- Forecasting: rolling S&OP
- Quality: factory + inbound QA
- Vendors: scorecards for OTIF/quality
- Inventory: JIT, bulk pooling, drop-ship
Customer service and warranty management
Multichannel support resolves setup, use, and replacement issues rapidly, enabling same-day responses and reducing escalations; 2024 data show self-service and multichannel care can cut support costs about 30%. Clear warranties and easy returns increase purchase confidence for high-ticket Solo Brands items, with e-commerce return rates around 16% in 2024. Knowledge bases and video guides lower friction and support volume, while systematic feedback loops feed product improvements and SKU revisions.
- Multichannel support — faster resolutions, lower escalations
- Clear warranties + easy returns — trust for high-ticket items
- Knowledge bases/videos — ~30% support cost reduction (2024)
- Feedback loops — direct input for product enhancements
Bundles lift AOV ~20%, drops +15-25%, support -30%
In-house design, iterative field testing and USPTO filings drive product innovation while cross-brand learnings accelerate features. Performance marketing, owned content and community events scale acquisition and loyalty; optimized PDPs, bundles and drops lift AOV ~20% and produce 15–25% short-term spikes. S&OP, QA and vendor scorecards cut stockouts; multichannel support and self-service lower support costs ~30% and e-com returns ~16% (2024).
| Metric | 2024 |
|---|---|
| AOV lift (bundles) | ~20% |
| Sales spikes (drops) | 15–25% |
| Support cost reduction | ~30% |
| E-com return rate | ~16% |
| Inventory carrying cost | 20–30% |
Preview Before You Purchase
Business Model Canvas
The Solo Brands Business Model Canvas you see here is the exact document you’ll receive after purchase, not a mockup or sample. When you complete your order you’ll gain instant access to this same ready-to-edit file, formatted for easy use and presentation. No hidden pages or altered layouts—what’s visible in this preview is representative of the full deliverable.











