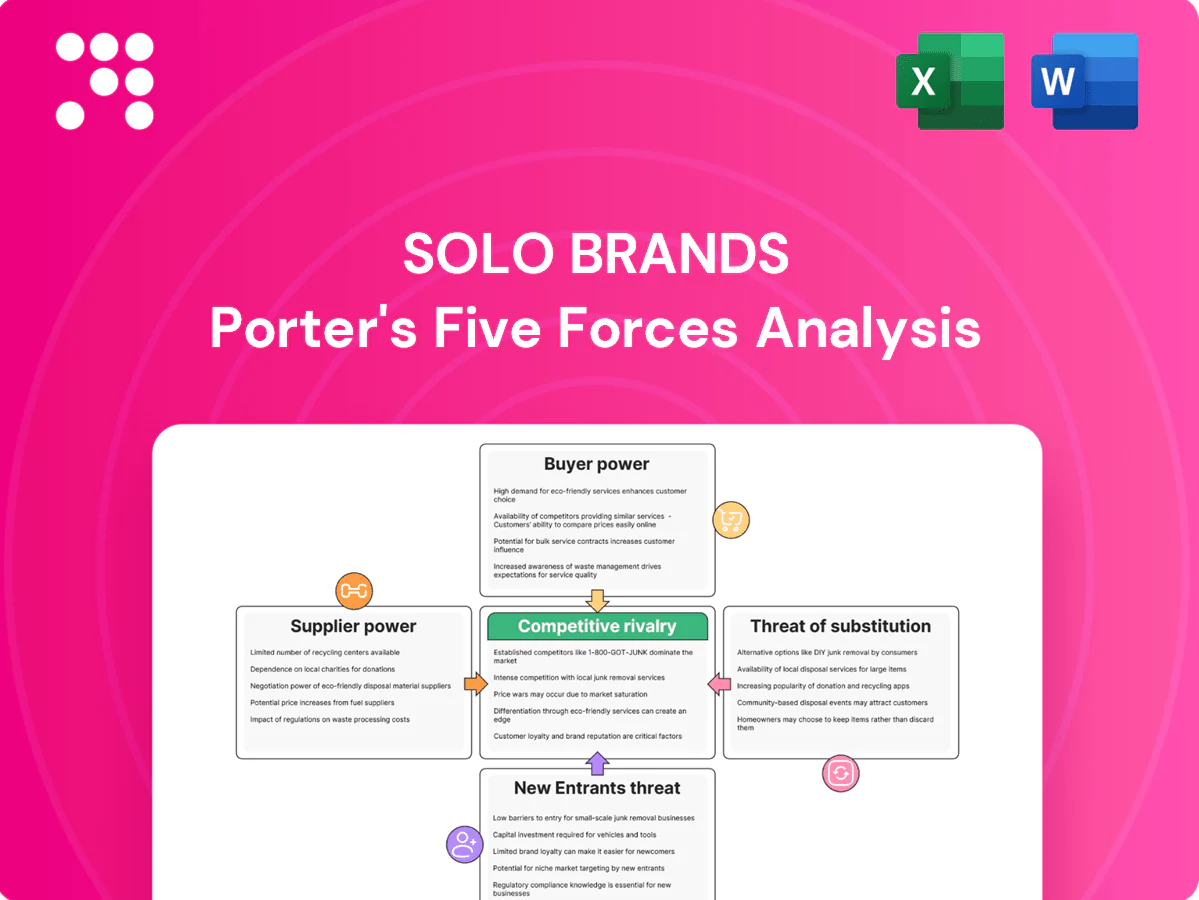
Solo Brands Porter's Five Forces Analysis

Don't Miss the Bigger Picture
Solo Brands faces moderate buyer power, rising substitute threats, and supplier leverage shaped by scale, while rivalry intensifies as DTC and retail channels converge. This snapshot highlights key strategic pressure points and operational gaps. Unlock the complete Porter's Five Forces Analysis for force-by-force ratings, visuals, and actionable implications to inform investment or strategy.
Suppliers Bargaining Power

Multi-category input dependence
Steel, aluminum, specialty polymers, textiles, foams and electronics together form Solo Brands’ bill of materials, and category diversity lowers single-supplier dependence but increases procurement and quality-coordination complexity. Consolidation or input shortages — for example, China produced roughly 55% of global stainless steel in 2024 — can tighten terms and raise lead-time risk. Hedging, multi-sourcing and longer-term contracts partially offset raw-material volatility.
Contract manufacturing flexibility
Use of third-party contract manufacturers gives Solo Brands capacity and seasonal flexibility but fragmented volumes across multiple CMOs reduce bargaining leverage and pricing power. Switching costs are moderate — tooling and QA transfer typically require 3–6 months and incremental spend for requalification. Vendor concentration in Asia raises geopolitical and logistics risk, highlighted by 2020–21 port disruptions. Preferred supplier programs can consolidate spend to improve pricing and shorten lead times.

Proprietary designs and specs
Distinctive Solo Stove designs, Oru folding technology, and ISLE constructions create spec-driven dependencies that elevate supplier leverage. Suppliers of custom components gain bargaining power when qualification pipelines commonly run 6–18 months, locking in lead times and switching costs. Maintaining dual-tooling and at least one second source reduces single-supplier risk. Enforceable IP and strict quality standards preserve product differentiation and margin control.

Scale versus niche volumes
Flagship SKUs carry the bulk of Solo Brands' volumes, while niche items run in low batches, giving suppliers leverage on pricing and allocation; in 2024 suppliers continued to prioritize larger runs for better lead times. Small-batch innovation incurs higher unit costs and lower priority; seasonal peaks further strengthen supplier bargaining power. Forecast accuracy in 2024 remained a key determinant of favorable supplier terms.
- Scale advantage: larger runs win pricing and allocation
- Niche penalty: higher unit costs, weaker priority
- Seasonality: amplifies supplier leverage
- Forecasting: drives contract terms
Logistics and lead-time sensitivity
Long lead times for kayaks and paddleboards (commonly 60–120 days) and bulky fire pits amplify freight-cost exposure, making Solo Brands vulnerable when port congestion or fuel surcharges occur — fuel surcharges can add roughly 5–12% to shipment costs in volatile markets (2024). Shifts in carrier pricing can transfer margin to suppliers/logistics partners. Nearshoring and DC network optimization shorten transit by ~30–70% and cut some freight spend. VMI and tighter S&OP can lower rush-premium shipments by ~15–25%.
- Lead times: 60–120 days
- Fuel surcharges impact: ~5–12%
- Nearshoring transit reduction: ~30–70%
- VMI/S&OP rush-reduction: ~15–25%
Supplier power moderate-high as China supplies ~55% of stainless steel
Supplier power is moderate‑high: China produced ~55% of stainless steel in 2024, long lead times (60–120 days) and custom component qualifications (6–18 months) raise switching costs; flagship SKUs concentrate volume and give suppliers leverage. Multi‑sourcing, preferred suppliers, VMI and nearshoring (transit −30–70%) mitigate risk; fuel surcharges added ~5–12% in 2024.
| Metric | 2024 | Impact |
|---|---|---|
| China stainless steel share | ~55% | Input concentration |
| Lead times | 60–120 days | Switching cost |
| Qualification | 6–18 months | Supplier lock |
| Fuel surcharges | ~5–12% | Freight cost |
What is included in the product
 Detailed Word Document
Comprehensive Porter's Five Forces analysis tailored to Solo Brands, assessing competitive rivalry, supplier and buyer power, threat of substitutes, and barriers to entry to reveal pricing pressures, profitability risks, and strategic opportunities to defend and expand market share.

 Customizable Excel Spreadsheet
Clear, one-sheet Porter's Five Forces for Solo Brands that instantly visualizes strategic pressure with a spider chart and customizable force levels—ready to drop into pitch decks or dashboards.
Customers Bargaining Power

DTC transparency and price discovery
Solo Brands’ direct e-commerce and marketplace footprints make prices instantly comparable, accelerating cross-shopping as global e-commerce surpassed roughly $6 trillion in 2024. Customers use instant comparisons to extract discounts, raising bargaining power, while frequent dynamic promotions further anchor reference pricing. Strong value communication and curated bundles can blunt discount pressure by shifting focus from price to total perceived value.
Low switching costs
Low switching costs hurt Solo because most offerings are one-time or infrequent purchases with many alternatives in a global apparel market valued at about $1.5 trillion in 2023. Functional parity in apparel and boards makes switching trivial for price- or trend-sensitive buyers. Warranty programs, community events and accessory ecosystems increase stickiness by creating recurring revenue touchpoints. Strong post-purchase service and engagement can convert trials into lasting loyalty.

Retail partner influence
Retail partners demand margins, dating, and marketing support, frequently leveraging category power to extract chargebacks and exclusives; Amazon held about 38% of US e-commerce sales in 2024, amplifying its negotiating clout. A diversified channel mix reduces concentration risk by spreading revenue beyond dominant retailers. Data-sharing arrangements are increasingly used to trade richer consumer insights for improved shelf visibility and promotional placement.

Brand community mitigants
Brand communities around Solo Stove, Oru/ISLE and Chubbies lower pure price sensitivity by converting transactions into experiential relationships; UGC and branded events boost perceived value and create social proof that supports premium positioning.
Loyalty programs and limited editions increase willingness to pay while rising NPS reduces returns and service costs, tightening customer bargaining power.
- Solo Stove: strong UGC and events
- Oru/ISLE: enthusiast groups driving repeat buys
- Chubbies: distinctive brand voice reduces price focus
- Loyalty/limited editions: higher WTP
- NPS gains: lower returns/service costs
Economic sensitivity
Discretionary outdoor spend fluctuates with consumer confidence; in 2024 the Conference Board U.S. Consumer Confidence averaged 101.8, tightening budgets and causing buyers to delay or trade down, pressuring price. Financing and entry SKUs can preserve conversion while clear durability and performance proof supports premium positioning. Retailers leaning on promos see margin erosion during downturns.
- Discretionary sensitivity
- Financing preserves conversion
- Entry SKUs limit churn
- Durability proofs protect price
Consumers wield pricing power in a $6T e-commerce era; loyalty raises willingness to pay
Customers wield elevated bargaining power as global e-commerce hit ~$6T in 2024 and Amazon held ~38% of US e-commerce, making prices instantly comparable and promo-driven. Low switching costs in a ~$1.5T apparel market (2023) and discretionary spend pressure (U.S. Consumer Confidence 101.8 in 2024) increase price sensitivity. Brand communities, loyalty and NPS improvements raise willingness to pay and reduce churn.
| Metric | Value |
|---|---|
| Global e-commerce 2024 | $6T |
| Amazon US share 2024 | 38% |
| Apparel market 2023 | $1.5T |
| US Consumer Confidence 2024 | 101.8 |
Preview Before You Purchase
Solo Brands Porter's Five Forces Analysis
This preview shows the exact Solo Brands Porter's Five Forces Analysis you'll receive immediately after purchase—no surprises or placeholders. The document displayed is the complete, professionally formatted analysis, ready for download and immediate use. Once you buy, you’ll get instant access to this identical file.

Don't Miss the Bigger Picture
Solo Brands faces moderate buyer power, rising substitute threats, and supplier leverage shaped by scale, while rivalry intensifies as DTC and retail channels converge. This snapshot highlights key strategic pressure points and operational gaps. Unlock the complete Porter's Five Forces Analysis for force-by-force ratings, visuals, and actionable implications to inform investment or strategy.
Suppliers Bargaining Power
Multi-category input dependence
Steel, aluminum, specialty polymers, textiles, foams and electronics together form Solo Brands’ bill of materials, and category diversity lowers single-supplier dependence but increases procurement and quality-coordination complexity. Consolidation or input shortages — for example, China produced roughly 55% of global stainless steel in 2024 — can tighten terms and raise lead-time risk. Hedging, multi-sourcing and longer-term contracts partially offset raw-material volatility.
Contract manufacturing flexibility
Use of third-party contract manufacturers gives Solo Brands capacity and seasonal flexibility but fragmented volumes across multiple CMOs reduce bargaining leverage and pricing power. Switching costs are moderate — tooling and QA transfer typically require 3–6 months and incremental spend for requalification. Vendor concentration in Asia raises geopolitical and logistics risk, highlighted by 2020–21 port disruptions. Preferred supplier programs can consolidate spend to improve pricing and shorten lead times.
Proprietary designs and specs
Distinctive Solo Stove designs, Oru folding technology, and ISLE constructions create spec-driven dependencies that elevate supplier leverage. Suppliers of custom components gain bargaining power when qualification pipelines commonly run 6–18 months, locking in lead times and switching costs. Maintaining dual-tooling and at least one second source reduces single-supplier risk. Enforceable IP and strict quality standards preserve product differentiation and margin control.
Scale versus niche volumes
Flagship SKUs carry the bulk of Solo Brands' volumes, while niche items run in low batches, giving suppliers leverage on pricing and allocation; in 2024 suppliers continued to prioritize larger runs for better lead times. Small-batch innovation incurs higher unit costs and lower priority; seasonal peaks further strengthen supplier bargaining power. Forecast accuracy in 2024 remained a key determinant of favorable supplier terms.
- Scale advantage: larger runs win pricing and allocation
- Niche penalty: higher unit costs, weaker priority
- Seasonality: amplifies supplier leverage
- Forecasting: drives contract terms
Logistics and lead-time sensitivity
Long lead times for kayaks and paddleboards (commonly 60–120 days) and bulky fire pits amplify freight-cost exposure, making Solo Brands vulnerable when port congestion or fuel surcharges occur — fuel surcharges can add roughly 5–12% to shipment costs in volatile markets (2024). Shifts in carrier pricing can transfer margin to suppliers/logistics partners. Nearshoring and DC network optimization shorten transit by ~30–70% and cut some freight spend. VMI and tighter S&OP can lower rush-premium shipments by ~15–25%.
- Lead times: 60–120 days
- Fuel surcharges impact: ~5–12%
- Nearshoring transit reduction: ~30–70%
- VMI/S&OP rush-reduction: ~15–25%
Supplier power moderate-high as China supplies ~55% of stainless steel
Supplier power is moderate‑high: China produced ~55% of stainless steel in 2024, long lead times (60–120 days) and custom component qualifications (6–18 months) raise switching costs; flagship SKUs concentrate volume and give suppliers leverage. Multi‑sourcing, preferred suppliers, VMI and nearshoring (transit −30–70%) mitigate risk; fuel surcharges added ~5–12% in 2024.
| Metric | 2024 | Impact |
|---|---|---|
| China stainless steel share | ~55% | Input concentration |
| Lead times | 60–120 days | Switching cost |
| Qualification | 6–18 months | Supplier lock |
| Fuel surcharges | ~5–12% | Freight cost |
What is included in the product
Detailed Word Document
Comprehensive Porter's Five Forces analysis tailored to Solo Brands, assessing competitive rivalry, supplier and buyer power, threat of substitutes, and barriers to entry to reveal pricing pressures, profitability risks, and strategic opportunities to defend and expand market share.
Customizable Excel Spreadsheet
Clear, one-sheet Porter's Five Forces for Solo Brands that instantly visualizes strategic pressure with a spider chart and customizable force levels—ready to drop into pitch decks or dashboards.
Customers Bargaining Power
DTC transparency and price discovery
Solo Brands’ direct e-commerce and marketplace footprints make prices instantly comparable, accelerating cross-shopping as global e-commerce surpassed roughly $6 trillion in 2024. Customers use instant comparisons to extract discounts, raising bargaining power, while frequent dynamic promotions further anchor reference pricing. Strong value communication and curated bundles can blunt discount pressure by shifting focus from price to total perceived value.
Low switching costs
Low switching costs hurt Solo because most offerings are one-time or infrequent purchases with many alternatives in a global apparel market valued at about $1.5 trillion in 2023. Functional parity in apparel and boards makes switching trivial for price- or trend-sensitive buyers. Warranty programs, community events and accessory ecosystems increase stickiness by creating recurring revenue touchpoints. Strong post-purchase service and engagement can convert trials into lasting loyalty.
Retail partner influence
Retail partners demand margins, dating, and marketing support, frequently leveraging category power to extract chargebacks and exclusives; Amazon held about 38% of US e-commerce sales in 2024, amplifying its negotiating clout. A diversified channel mix reduces concentration risk by spreading revenue beyond dominant retailers. Data-sharing arrangements are increasingly used to trade richer consumer insights for improved shelf visibility and promotional placement.
Brand community mitigants
Brand communities around Solo Stove, Oru/ISLE and Chubbies lower pure price sensitivity by converting transactions into experiential relationships; UGC and branded events boost perceived value and create social proof that supports premium positioning.
Loyalty programs and limited editions increase willingness to pay while rising NPS reduces returns and service costs, tightening customer bargaining power.
- Solo Stove: strong UGC and events
- Oru/ISLE: enthusiast groups driving repeat buys
- Chubbies: distinctive brand voice reduces price focus
- Loyalty/limited editions: higher WTP
- NPS gains: lower returns/service costs
Economic sensitivity
Discretionary outdoor spend fluctuates with consumer confidence; in 2024 the Conference Board U.S. Consumer Confidence averaged 101.8, tightening budgets and causing buyers to delay or trade down, pressuring price. Financing and entry SKUs can preserve conversion while clear durability and performance proof supports premium positioning. Retailers leaning on promos see margin erosion during downturns.
- Discretionary sensitivity
- Financing preserves conversion
- Entry SKUs limit churn
- Durability proofs protect price
Consumers wield pricing power in a $6T e-commerce era; loyalty raises willingness to pay
Customers wield elevated bargaining power as global e-commerce hit ~$6T in 2024 and Amazon held ~38% of US e-commerce, making prices instantly comparable and promo-driven. Low switching costs in a ~$1.5T apparel market (2023) and discretionary spend pressure (U.S. Consumer Confidence 101.8 in 2024) increase price sensitivity. Brand communities, loyalty and NPS improvements raise willingness to pay and reduce churn.
| Metric | Value |
|---|---|
| Global e-commerce 2024 | $6T |
| Amazon US share 2024 | 38% |
| Apparel market 2023 | $1.5T |
| US Consumer Confidence 2024 | 101.8 |
Preview Before You Purchase
Solo Brands Porter's Five Forces Analysis
This preview shows the exact Solo Brands Porter's Five Forces Analysis you'll receive immediately after purchase—no surprises or placeholders. The document displayed is the complete, professionally formatted analysis, ready for download and immediate use. Once you buy, you’ll get instant access to this identical file.
Description
Don't Miss the Bigger Picture
Solo Brands faces moderate buyer power, rising substitute threats, and supplier leverage shaped by scale, while rivalry intensifies as DTC and retail channels converge. This snapshot highlights key strategic pressure points and operational gaps. Unlock the complete Porter's Five Forces Analysis for force-by-force ratings, visuals, and actionable implications to inform investment or strategy.
Suppliers Bargaining Power
Multi-category input dependence
Steel, aluminum, specialty polymers, textiles, foams and electronics together form Solo Brands’ bill of materials, and category diversity lowers single-supplier dependence but increases procurement and quality-coordination complexity. Consolidation or input shortages — for example, China produced roughly 55% of global stainless steel in 2024 — can tighten terms and raise lead-time risk. Hedging, multi-sourcing and longer-term contracts partially offset raw-material volatility.
Contract manufacturing flexibility
Use of third-party contract manufacturers gives Solo Brands capacity and seasonal flexibility but fragmented volumes across multiple CMOs reduce bargaining leverage and pricing power. Switching costs are moderate — tooling and QA transfer typically require 3–6 months and incremental spend for requalification. Vendor concentration in Asia raises geopolitical and logistics risk, highlighted by 2020–21 port disruptions. Preferred supplier programs can consolidate spend to improve pricing and shorten lead times.
Proprietary designs and specs
Distinctive Solo Stove designs, Oru folding technology, and ISLE constructions create spec-driven dependencies that elevate supplier leverage. Suppliers of custom components gain bargaining power when qualification pipelines commonly run 6–18 months, locking in lead times and switching costs. Maintaining dual-tooling and at least one second source reduces single-supplier risk. Enforceable IP and strict quality standards preserve product differentiation and margin control.
Scale versus niche volumes
Flagship SKUs carry the bulk of Solo Brands' volumes, while niche items run in low batches, giving suppliers leverage on pricing and allocation; in 2024 suppliers continued to prioritize larger runs for better lead times. Small-batch innovation incurs higher unit costs and lower priority; seasonal peaks further strengthen supplier bargaining power. Forecast accuracy in 2024 remained a key determinant of favorable supplier terms.
- Scale advantage: larger runs win pricing and allocation
- Niche penalty: higher unit costs, weaker priority
- Seasonality: amplifies supplier leverage
- Forecasting: drives contract terms
Logistics and lead-time sensitivity
Long lead times for kayaks and paddleboards (commonly 60–120 days) and bulky fire pits amplify freight-cost exposure, making Solo Brands vulnerable when port congestion or fuel surcharges occur — fuel surcharges can add roughly 5–12% to shipment costs in volatile markets (2024). Shifts in carrier pricing can transfer margin to suppliers/logistics partners. Nearshoring and DC network optimization shorten transit by ~30–70% and cut some freight spend. VMI and tighter S&OP can lower rush-premium shipments by ~15–25%.
- Lead times: 60–120 days
- Fuel surcharges impact: ~5–12%
- Nearshoring transit reduction: ~30–70%
- VMI/S&OP rush-reduction: ~15–25%
Supplier power moderate-high as China supplies ~55% of stainless steel
Supplier power is moderate‑high: China produced ~55% of stainless steel in 2024, long lead times (60–120 days) and custom component qualifications (6–18 months) raise switching costs; flagship SKUs concentrate volume and give suppliers leverage. Multi‑sourcing, preferred suppliers, VMI and nearshoring (transit −30–70%) mitigate risk; fuel surcharges added ~5–12% in 2024.
| Metric | 2024 | Impact |
|---|---|---|
| China stainless steel share | ~55% | Input concentration |
| Lead times | 60–120 days | Switching cost |
| Qualification | 6–18 months | Supplier lock |
| Fuel surcharges | ~5–12% | Freight cost |
What is included in the product
Detailed Word Document
Comprehensive Porter's Five Forces analysis tailored to Solo Brands, assessing competitive rivalry, supplier and buyer power, threat of substitutes, and barriers to entry to reveal pricing pressures, profitability risks, and strategic opportunities to defend and expand market share.
Customizable Excel Spreadsheet
Clear, one-sheet Porter's Five Forces for Solo Brands that instantly visualizes strategic pressure with a spider chart and customizable force levels—ready to drop into pitch decks or dashboards.
Customers Bargaining Power
DTC transparency and price discovery
Solo Brands’ direct e-commerce and marketplace footprints make prices instantly comparable, accelerating cross-shopping as global e-commerce surpassed roughly $6 trillion in 2024. Customers use instant comparisons to extract discounts, raising bargaining power, while frequent dynamic promotions further anchor reference pricing. Strong value communication and curated bundles can blunt discount pressure by shifting focus from price to total perceived value.
Low switching costs
Low switching costs hurt Solo because most offerings are one-time or infrequent purchases with many alternatives in a global apparel market valued at about $1.5 trillion in 2023. Functional parity in apparel and boards makes switching trivial for price- or trend-sensitive buyers. Warranty programs, community events and accessory ecosystems increase stickiness by creating recurring revenue touchpoints. Strong post-purchase service and engagement can convert trials into lasting loyalty.
Retail partner influence
Retail partners demand margins, dating, and marketing support, frequently leveraging category power to extract chargebacks and exclusives; Amazon held about 38% of US e-commerce sales in 2024, amplifying its negotiating clout. A diversified channel mix reduces concentration risk by spreading revenue beyond dominant retailers. Data-sharing arrangements are increasingly used to trade richer consumer insights for improved shelf visibility and promotional placement.
Brand community mitigants
Brand communities around Solo Stove, Oru/ISLE and Chubbies lower pure price sensitivity by converting transactions into experiential relationships; UGC and branded events boost perceived value and create social proof that supports premium positioning.
Loyalty programs and limited editions increase willingness to pay while rising NPS reduces returns and service costs, tightening customer bargaining power.
- Solo Stove: strong UGC and events
- Oru/ISLE: enthusiast groups driving repeat buys
- Chubbies: distinctive brand voice reduces price focus
- Loyalty/limited editions: higher WTP
- NPS gains: lower returns/service costs
Economic sensitivity
Discretionary outdoor spend fluctuates with consumer confidence; in 2024 the Conference Board U.S. Consumer Confidence averaged 101.8, tightening budgets and causing buyers to delay or trade down, pressuring price. Financing and entry SKUs can preserve conversion while clear durability and performance proof supports premium positioning. Retailers leaning on promos see margin erosion during downturns.
- Discretionary sensitivity
- Financing preserves conversion
- Entry SKUs limit churn
- Durability proofs protect price
Consumers wield pricing power in a $6T e-commerce era; loyalty raises willingness to pay
Customers wield elevated bargaining power as global e-commerce hit ~$6T in 2024 and Amazon held ~38% of US e-commerce, making prices instantly comparable and promo-driven. Low switching costs in a ~$1.5T apparel market (2023) and discretionary spend pressure (U.S. Consumer Confidence 101.8 in 2024) increase price sensitivity. Brand communities, loyalty and NPS improvements raise willingness to pay and reduce churn.
| Metric | Value |
|---|---|
| Global e-commerce 2024 | $6T |
| Amazon US share 2024 | 38% |
| Apparel market 2023 | $1.5T |
| US Consumer Confidence 2024 | 101.8 |
Preview Before You Purchase
Solo Brands Porter's Five Forces Analysis
This preview shows the exact Solo Brands Porter's Five Forces Analysis you'll receive immediately after purchase—no surprises or placeholders. The document displayed is the complete, professionally formatted analysis, ready for download and immediate use. Once you buy, you’ll get instant access to this identical file.











