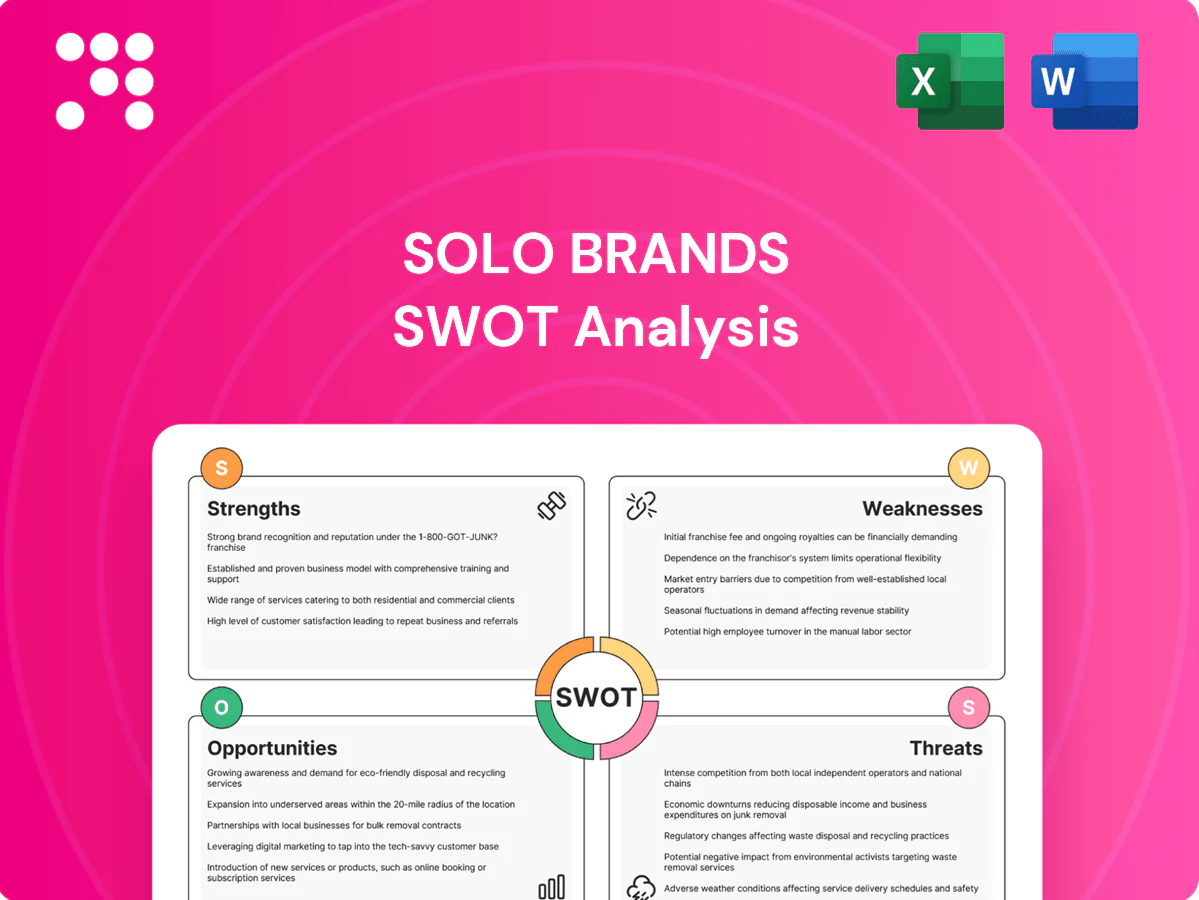
Solo Brands SWOT Analysis

Make Insightful Decisions Backed by Expert Research
Explore Solo Brands’ competitive edge and hidden vulnerabilities with our focused SWOT snapshot — highlighting product portfolio strength, retail channel risks, and acquisition-driven growth opportunities. Want the full strategic playbook? Purchase the complete SWOT analysis for a professionally formatted, editable report and Excel matrix to support investment, planning, or pitch-ready decisions.
Strengths

Distinct DTC portfolio
Solo Brands’ distinct DTC portfolio—Solo Stove, Chubbies, Oru Kayak and ISLE—drives cross-category reach and shared traffic efficiencies across outdoor hardgoods and apparel. Direct channels deliver data ownership, higher gross margins and tighter UX control. Portfolio diversification helps smooth seasonal swings between camping gear and swim/activewear. The Solo Stove brand halo elevates visibility and discovery across the platform.
Product innovation DNA
Flagship designs like smokeless fire pits and folding kayaks differentiate on function rather than price, supporting Solo Brands' premium positioning after reporting approximately $300M revenue in 2023. Continuous iteration and proprietary design sustain word-of-mouth and repeat buying, with the company holding multiple US patents that raise switching costs. This innovation drive increases customer lifetime value and repeat purchase frequency.

Community-driven branding
Engagement around outdoor experiences fuels UGC, ambassadorships and organic reach, turning customers into unpaid marketers; events and social content build identity and loyalty that extend lifetime value beyond one-off purchases. Community feedback loops accelerate insight-to-product cycles, shortening development timelines and reducing R&D waste. Over time this dynamic lowers reliance on paid media and supports more efficient CAC management.

Omnichannel selectivity
Primarily owned e-commerce combined with curated retail partners lets Solo Brands protect margins while using select stores as showrooms for trial; US e-commerce reached about 18% of retail sales in 2024, underscoring the channel's profitability and reach. Controlled distribution preserves brand integrity and pricing, keeping channel conflict limited and reducing reliance on any single channel.
- Omnichannel: owned e-commerce + select retail
- Showroom use: trial without broad channel conflict
- Preserves pricing/brand integrity
- Reduces single-channel dependence
Operational scale synergies
Operational scale synergies let Solo Brands consolidate shared fulfillment, marketing tech, and sourcing to drive lower unit costs and faster inventory turns, while centralized analytics improves cross-sell, upsell, and CAC payback across portfolios. Seasonality balancing across brands smooths demand volatility and enhances inventory turnover. Platform leverage speeds new product launches and time-to-market.
- Shared fulfillment: cost pooling, faster shipping
- Marketing tech: unified ad stack, improved ROAS
- Sourcing: volume discounts, lower COGS
- Analytics: higher LTV/CAC efficiency
- Seasonality: inventory smoothing, higher turns
DTC portfolio fuels cross‑category traffic, premium margins and $300M (2023)
Solo Brands' DTC portfolio (Solo Stove, Chubbies, Oru, ISLE) drives cross‑category traffic, higher gross margins and data ownership; company reported ~300M revenue in 2023. Flagship patented products and premium positioning boost repeat purchase and LTV. Omnichannel control (US e‑commerce ~18% of retail sales in 2024) and shared ops deliver lower COGS, faster turns and CAC efficiency.
| Metric | Value |
|---|---|
| 2023 Revenue | $300M |
| US e‑commerce (2024) | 18% |
| Patents | Multiple US patents |
What is included in the product
 Detailed Word Document
Provides a clear SWOT framework for analyzing Solo Brands by mapping its core strengths and weaknesses, identifying market opportunities from brand diversification and direct-to-consumer channels, and highlighting threats such as competitive pressure, supply-chain risks, and changing consumer trends.

 Customizable Excel Spreadsheet
Provides a concise, visual SWOT matrix tailored to Solo Brands for rapid strategic alignment and easy stakeholder updates.
Weaknesses

DTC demand volatility
Solo Brands reliance on DTC means sales can swing with macro sentiment and higher ad costs; US e-commerce penetration reached about 18% in 2024, amplifying channel exposure.
Performance-marketing efficiency is fragile as platform algorithm shifts have pushed CPMs roughly 15% higher YoY in 2023–24, eroding ROAS.
Limited big-box presence constrains scale in core categories, raising forecasting and inventory risk as retailers tighten purchase cadence.
Seasonality and weather exposure
Products like fire pits, paddle boards and kayaks concentrate sales in warmer months, with industry data showing over 60% of volume clustering in Q2–Q3, exposing revenue to weather swings. Weather anomalies can compress promotional windows, forcing steeper, shorter campaigns and higher peak-day freight and storage costs. Inventory misalignments around these peaks amplify markdown pressure and working capital strain.

Category concentration risk
Outdoor leisure hardgoods carry higher-ticket, lower-frequency purchase patterns—premium fire pits average ASPs of roughly $300–900 (industry 2024 estimates)—so reliance on hero SKUs like flagship fire pits concentrates revenue and sales volatility. Apparel (Chubbies) provides diversification but typically lower margin and may not offset hardgoods swings. Limited services or subscriptions keep recurring revenue below ~10% for many DTC hardgoods players (2024).

Complexity from multi-brand ops
Complexity from multi-brand operations creates divergent product lifecycles, sizing standards, and material requirements that complicate procurement, inventory and forecasting; inconsistent brand voice and risk of cross-brand cannibalization require centralized marketing governance; integrating acquisitions strains ERP and logistics systems and can divert resources away from core product innovation.
- Supply chain fragmentation
- Brand voice inconsistency
- Integration strain on systems
- Diluted R&D focus
Exposure to logistics costs
Bulky product lines drive higher shipping, return and damage costs for Solo Brands, with e-commerce return rates around 20% and oversized handling adding material expense. Parcel and LTL rate inflation—UPS and FedEx announced ~5.9% general rate increases for 2024—compresses gross margins. Cross-border shipments add customs variability and lead times, while sustainable, protective packaging raises per-unit packaging spend.
- Higher returns/damage: ~20% return rate
- Carrier rate pressure: ~5.9% GRI (2024)
- International variability: customs, duties, delays
- Packaging cost increase: sustainability + protection
Heavy DTC, CPMs +15% and 20% returns squeeze margins and spike seasonal volatility
Heavy DTC mix (US e‑commerce ~18% in 2024) and performance‑marketing sensitivity (CPMs +15% YoY 2023–24) compress ROAS; seasonal hardgoods (60%+ sales Q2–Q3) and high ASPs ($300–900) amplify revenue volatility. Returns ~20% and carrier GRIs ~5.9% (2024) erode margins; multi‑brand integration strains systems and forecasting.
| Metric | Value |
|---|---|
| US e‑commerce penetration (2024) | ~18% |
| CPM change (2023–24) | +15% YoY |
| Seasonal share | 60%+ Q2–Q3 |
| ASP (fire pits) | $300–$900 |
| Return rate | ~20% |
| Carrier GRI (2024) | ~5.9% |
| Recurring revenue | <10% |
Same Document Delivered
Solo Brands SWOT Analysis
This is the actual SWOT analysis document you’ll receive upon purchase—no surprises, just professional quality. The preview below is taken directly from the full report you'll get, and the content is ready to use and editable. Buy now to unlock the complete, detailed version.

Make Insightful Decisions Backed by Expert Research
Explore Solo Brands’ competitive edge and hidden vulnerabilities with our focused SWOT snapshot — highlighting product portfolio strength, retail channel risks, and acquisition-driven growth opportunities. Want the full strategic playbook? Purchase the complete SWOT analysis for a professionally formatted, editable report and Excel matrix to support investment, planning, or pitch-ready decisions.
Strengths
Distinct DTC portfolio
Solo Brands’ distinct DTC portfolio—Solo Stove, Chubbies, Oru Kayak and ISLE—drives cross-category reach and shared traffic efficiencies across outdoor hardgoods and apparel. Direct channels deliver data ownership, higher gross margins and tighter UX control. Portfolio diversification helps smooth seasonal swings between camping gear and swim/activewear. The Solo Stove brand halo elevates visibility and discovery across the platform.
Product innovation DNA
Flagship designs like smokeless fire pits and folding kayaks differentiate on function rather than price, supporting Solo Brands' premium positioning after reporting approximately $300M revenue in 2023. Continuous iteration and proprietary design sustain word-of-mouth and repeat buying, with the company holding multiple US patents that raise switching costs. This innovation drive increases customer lifetime value and repeat purchase frequency.
Community-driven branding
Engagement around outdoor experiences fuels UGC, ambassadorships and organic reach, turning customers into unpaid marketers; events and social content build identity and loyalty that extend lifetime value beyond one-off purchases. Community feedback loops accelerate insight-to-product cycles, shortening development timelines and reducing R&D waste. Over time this dynamic lowers reliance on paid media and supports more efficient CAC management.
Omnichannel selectivity
Primarily owned e-commerce combined with curated retail partners lets Solo Brands protect margins while using select stores as showrooms for trial; US e-commerce reached about 18% of retail sales in 2024, underscoring the channel's profitability and reach. Controlled distribution preserves brand integrity and pricing, keeping channel conflict limited and reducing reliance on any single channel.
- Omnichannel: owned e-commerce + select retail
- Showroom use: trial without broad channel conflict
- Preserves pricing/brand integrity
- Reduces single-channel dependence
Operational scale synergies
Operational scale synergies let Solo Brands consolidate shared fulfillment, marketing tech, and sourcing to drive lower unit costs and faster inventory turns, while centralized analytics improves cross-sell, upsell, and CAC payback across portfolios. Seasonality balancing across brands smooths demand volatility and enhances inventory turnover. Platform leverage speeds new product launches and time-to-market.
- Shared fulfillment: cost pooling, faster shipping
- Marketing tech: unified ad stack, improved ROAS
- Sourcing: volume discounts, lower COGS
- Analytics: higher LTV/CAC efficiency
- Seasonality: inventory smoothing, higher turns
DTC portfolio fuels cross‑category traffic, premium margins and $300M (2023)
Solo Brands' DTC portfolio (Solo Stove, Chubbies, Oru, ISLE) drives cross‑category traffic, higher gross margins and data ownership; company reported ~300M revenue in 2023. Flagship patented products and premium positioning boost repeat purchase and LTV. Omnichannel control (US e‑commerce ~18% of retail sales in 2024) and shared ops deliver lower COGS, faster turns and CAC efficiency.
| Metric | Value |
|---|---|
| 2023 Revenue | $300M |
| US e‑commerce (2024) | 18% |
| Patents | Multiple US patents |
What is included in the product
Detailed Word Document
Provides a clear SWOT framework for analyzing Solo Brands by mapping its core strengths and weaknesses, identifying market opportunities from brand diversification and direct-to-consumer channels, and highlighting threats such as competitive pressure, supply-chain risks, and changing consumer trends.
Customizable Excel Spreadsheet
Provides a concise, visual SWOT matrix tailored to Solo Brands for rapid strategic alignment and easy stakeholder updates.
Weaknesses
DTC demand volatility
Solo Brands reliance on DTC means sales can swing with macro sentiment and higher ad costs; US e-commerce penetration reached about 18% in 2024, amplifying channel exposure.
Performance-marketing efficiency is fragile as platform algorithm shifts have pushed CPMs roughly 15% higher YoY in 2023–24, eroding ROAS.
Limited big-box presence constrains scale in core categories, raising forecasting and inventory risk as retailers tighten purchase cadence.
Seasonality and weather exposure
Products like fire pits, paddle boards and kayaks concentrate sales in warmer months, with industry data showing over 60% of volume clustering in Q2–Q3, exposing revenue to weather swings. Weather anomalies can compress promotional windows, forcing steeper, shorter campaigns and higher peak-day freight and storage costs. Inventory misalignments around these peaks amplify markdown pressure and working capital strain.
Category concentration risk
Outdoor leisure hardgoods carry higher-ticket, lower-frequency purchase patterns—premium fire pits average ASPs of roughly $300–900 (industry 2024 estimates)—so reliance on hero SKUs like flagship fire pits concentrates revenue and sales volatility. Apparel (Chubbies) provides diversification but typically lower margin and may not offset hardgoods swings. Limited services or subscriptions keep recurring revenue below ~10% for many DTC hardgoods players (2024).
Complexity from multi-brand ops
Complexity from multi-brand operations creates divergent product lifecycles, sizing standards, and material requirements that complicate procurement, inventory and forecasting; inconsistent brand voice and risk of cross-brand cannibalization require centralized marketing governance; integrating acquisitions strains ERP and logistics systems and can divert resources away from core product innovation.
- Supply chain fragmentation
- Brand voice inconsistency
- Integration strain on systems
- Diluted R&D focus
Exposure to logistics costs
Bulky product lines drive higher shipping, return and damage costs for Solo Brands, with e-commerce return rates around 20% and oversized handling adding material expense. Parcel and LTL rate inflation—UPS and FedEx announced ~5.9% general rate increases for 2024—compresses gross margins. Cross-border shipments add customs variability and lead times, while sustainable, protective packaging raises per-unit packaging spend.
- Higher returns/damage: ~20% return rate
- Carrier rate pressure: ~5.9% GRI (2024)
- International variability: customs, duties, delays
- Packaging cost increase: sustainability + protection
Heavy DTC, CPMs +15% and 20% returns squeeze margins and spike seasonal volatility
Heavy DTC mix (US e‑commerce ~18% in 2024) and performance‑marketing sensitivity (CPMs +15% YoY 2023–24) compress ROAS; seasonal hardgoods (60%+ sales Q2–Q3) and high ASPs ($300–900) amplify revenue volatility. Returns ~20% and carrier GRIs ~5.9% (2024) erode margins; multi‑brand integration strains systems and forecasting.
| Metric | Value |
|---|---|
| US e‑commerce penetration (2024) | ~18% |
| CPM change (2023–24) | +15% YoY |
| Seasonal share | 60%+ Q2–Q3 |
| ASP (fire pits) | $300–$900 |
| Return rate | ~20% |
| Carrier GRI (2024) | ~5.9% |
| Recurring revenue | <10% |
Same Document Delivered
Solo Brands SWOT Analysis
This is the actual SWOT analysis document you’ll receive upon purchase—no surprises, just professional quality. The preview below is taken directly from the full report you'll get, and the content is ready to use and editable. Buy now to unlock the complete, detailed version.
Description
Make Insightful Decisions Backed by Expert Research
Explore Solo Brands’ competitive edge and hidden vulnerabilities with our focused SWOT snapshot — highlighting product portfolio strength, retail channel risks, and acquisition-driven growth opportunities. Want the full strategic playbook? Purchase the complete SWOT analysis for a professionally formatted, editable report and Excel matrix to support investment, planning, or pitch-ready decisions.
Strengths
Distinct DTC portfolio
Solo Brands’ distinct DTC portfolio—Solo Stove, Chubbies, Oru Kayak and ISLE—drives cross-category reach and shared traffic efficiencies across outdoor hardgoods and apparel. Direct channels deliver data ownership, higher gross margins and tighter UX control. Portfolio diversification helps smooth seasonal swings between camping gear and swim/activewear. The Solo Stove brand halo elevates visibility and discovery across the platform.
Product innovation DNA
Flagship designs like smokeless fire pits and folding kayaks differentiate on function rather than price, supporting Solo Brands' premium positioning after reporting approximately $300M revenue in 2023. Continuous iteration and proprietary design sustain word-of-mouth and repeat buying, with the company holding multiple US patents that raise switching costs. This innovation drive increases customer lifetime value and repeat purchase frequency.
Community-driven branding
Engagement around outdoor experiences fuels UGC, ambassadorships and organic reach, turning customers into unpaid marketers; events and social content build identity and loyalty that extend lifetime value beyond one-off purchases. Community feedback loops accelerate insight-to-product cycles, shortening development timelines and reducing R&D waste. Over time this dynamic lowers reliance on paid media and supports more efficient CAC management.
Omnichannel selectivity
Primarily owned e-commerce combined with curated retail partners lets Solo Brands protect margins while using select stores as showrooms for trial; US e-commerce reached about 18% of retail sales in 2024, underscoring the channel's profitability and reach. Controlled distribution preserves brand integrity and pricing, keeping channel conflict limited and reducing reliance on any single channel.
- Omnichannel: owned e-commerce + select retail
- Showroom use: trial without broad channel conflict
- Preserves pricing/brand integrity
- Reduces single-channel dependence
Operational scale synergies
Operational scale synergies let Solo Brands consolidate shared fulfillment, marketing tech, and sourcing to drive lower unit costs and faster inventory turns, while centralized analytics improves cross-sell, upsell, and CAC payback across portfolios. Seasonality balancing across brands smooths demand volatility and enhances inventory turnover. Platform leverage speeds new product launches and time-to-market.
- Shared fulfillment: cost pooling, faster shipping
- Marketing tech: unified ad stack, improved ROAS
- Sourcing: volume discounts, lower COGS
- Analytics: higher LTV/CAC efficiency
- Seasonality: inventory smoothing, higher turns
DTC portfolio fuels cross‑category traffic, premium margins and $300M (2023)
Solo Brands' DTC portfolio (Solo Stove, Chubbies, Oru, ISLE) drives cross‑category traffic, higher gross margins and data ownership; company reported ~300M revenue in 2023. Flagship patented products and premium positioning boost repeat purchase and LTV. Omnichannel control (US e‑commerce ~18% of retail sales in 2024) and shared ops deliver lower COGS, faster turns and CAC efficiency.
| Metric | Value |
|---|---|
| 2023 Revenue | $300M |
| US e‑commerce (2024) | 18% |
| Patents | Multiple US patents |
What is included in the product
Detailed Word Document
Provides a clear SWOT framework for analyzing Solo Brands by mapping its core strengths and weaknesses, identifying market opportunities from brand diversification and direct-to-consumer channels, and highlighting threats such as competitive pressure, supply-chain risks, and changing consumer trends.
Customizable Excel Spreadsheet
Provides a concise, visual SWOT matrix tailored to Solo Brands for rapid strategic alignment and easy stakeholder updates.
Weaknesses
DTC demand volatility
Solo Brands reliance on DTC means sales can swing with macro sentiment and higher ad costs; US e-commerce penetration reached about 18% in 2024, amplifying channel exposure.
Performance-marketing efficiency is fragile as platform algorithm shifts have pushed CPMs roughly 15% higher YoY in 2023–24, eroding ROAS.
Limited big-box presence constrains scale in core categories, raising forecasting and inventory risk as retailers tighten purchase cadence.
Seasonality and weather exposure
Products like fire pits, paddle boards and kayaks concentrate sales in warmer months, with industry data showing over 60% of volume clustering in Q2–Q3, exposing revenue to weather swings. Weather anomalies can compress promotional windows, forcing steeper, shorter campaigns and higher peak-day freight and storage costs. Inventory misalignments around these peaks amplify markdown pressure and working capital strain.
Category concentration risk
Outdoor leisure hardgoods carry higher-ticket, lower-frequency purchase patterns—premium fire pits average ASPs of roughly $300–900 (industry 2024 estimates)—so reliance on hero SKUs like flagship fire pits concentrates revenue and sales volatility. Apparel (Chubbies) provides diversification but typically lower margin and may not offset hardgoods swings. Limited services or subscriptions keep recurring revenue below ~10% for many DTC hardgoods players (2024).
Complexity from multi-brand ops
Complexity from multi-brand operations creates divergent product lifecycles, sizing standards, and material requirements that complicate procurement, inventory and forecasting; inconsistent brand voice and risk of cross-brand cannibalization require centralized marketing governance; integrating acquisitions strains ERP and logistics systems and can divert resources away from core product innovation.
- Supply chain fragmentation
- Brand voice inconsistency
- Integration strain on systems
- Diluted R&D focus
Exposure to logistics costs
Bulky product lines drive higher shipping, return and damage costs for Solo Brands, with e-commerce return rates around 20% and oversized handling adding material expense. Parcel and LTL rate inflation—UPS and FedEx announced ~5.9% general rate increases for 2024—compresses gross margins. Cross-border shipments add customs variability and lead times, while sustainable, protective packaging raises per-unit packaging spend.
- Higher returns/damage: ~20% return rate
- Carrier rate pressure: ~5.9% GRI (2024)
- International variability: customs, duties, delays
- Packaging cost increase: sustainability + protection
Heavy DTC, CPMs +15% and 20% returns squeeze margins and spike seasonal volatility
Heavy DTC mix (US e‑commerce ~18% in 2024) and performance‑marketing sensitivity (CPMs +15% YoY 2023–24) compress ROAS; seasonal hardgoods (60%+ sales Q2–Q3) and high ASPs ($300–900) amplify revenue volatility. Returns ~20% and carrier GRIs ~5.9% (2024) erode margins; multi‑brand integration strains systems and forecasting.
| Metric | Value |
|---|---|
| US e‑commerce penetration (2024) | ~18% |
| CPM change (2023–24) | +15% YoY |
| Seasonal share | 60%+ Q2–Q3 |
| ASP (fire pits) | $300–$900 |
| Return rate | ~20% |
| Carrier GRI (2024) | ~5.9% |
| Recurring revenue | <10% |
Same Document Delivered
Solo Brands SWOT Analysis
This is the actual SWOT analysis document you’ll receive upon purchase—no surprises, just professional quality. The preview below is taken directly from the full report you'll get, and the content is ready to use and editable. Buy now to unlock the complete, detailed version.











