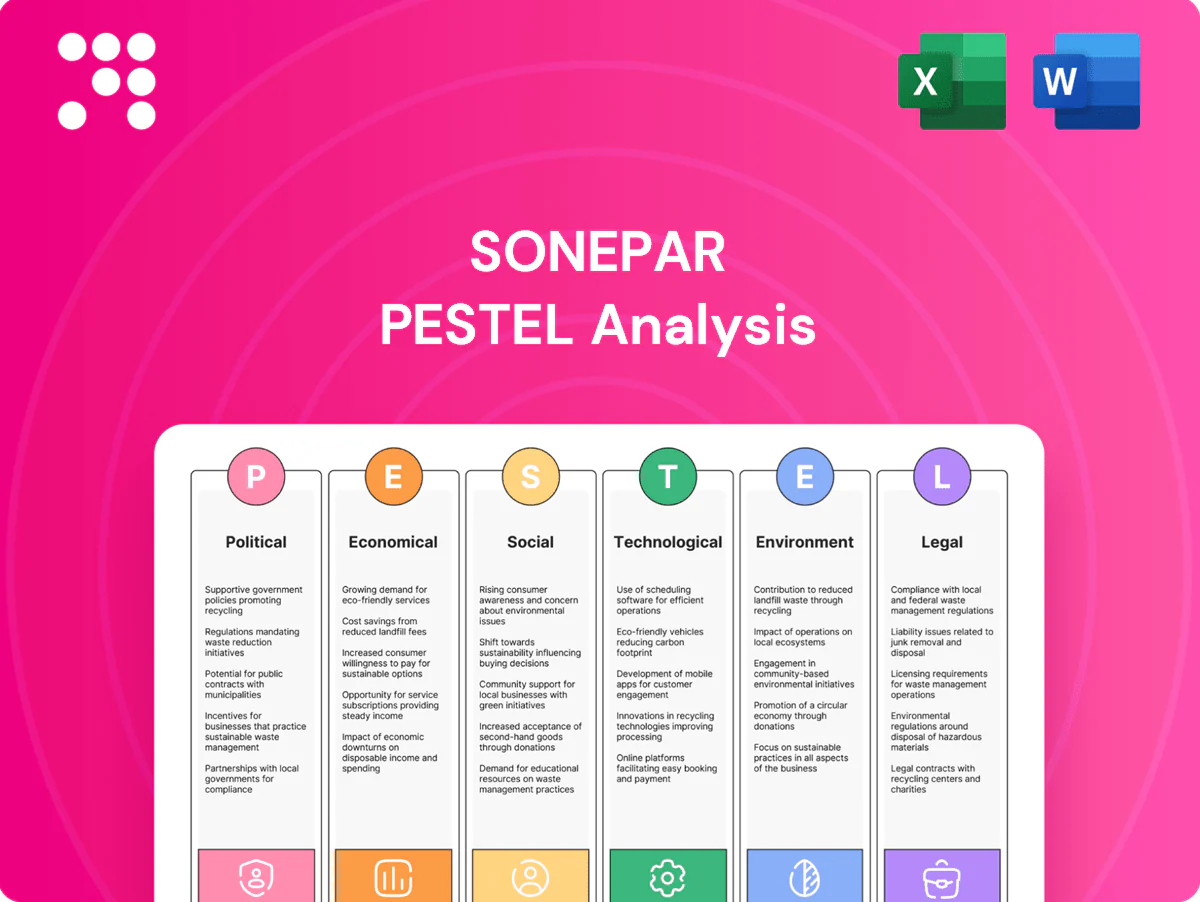
Sonepar PESTLE Analysis

Your Competitive Advantage Starts with This Report
Unlock how political shifts, supply-chain dynamics, and green regulations are reshaping Sonepar’s trajectory. Our concise PESTLE highlights risks and growth levers to inform investment and strategy decisions. Buy the full analysis for the detailed, downloadable report and actionable insights.
Political factors

Energy transition policies
Governments’ decarbonization agendas (eg US IRA ~$369bn in clean energy incentives) are driving stronger demand for electrification, renewables and efficiency products, boosting Sonepar’s addressable market. Incentives and mandates reshape product mix and margins across markets, so Sonepar must track policy timetables and align inventory and solutions. Election cycles and policy reversals can rapidly whipsaw demand planning and working capital needs.
Trade tariffs and geopolitical tensions
Tariffs on electrical components (eg US Section 301 measures up to 25%) can raise landed costs by roughly 10–25% and force sourcing shifts. Sanctions and export controls (eg 2022 US chip curbs) and geopolitical risk can abruptly disrupt supplier availability. Sonepar’s footprint in about 44 countries supports multi-region procurement to mitigate exposure. Contract terms should allocate tariff risk between customers and suppliers.

Public infrastructure and stimulus spending
Government capex in grids, EV charging and public buildings boosts distributor volumes; in the US the 2021 Infrastructure Investment and Jobs Act totals roughly $1.2 trillion with $7.5 billion for EV charging, and the EU’s NextGenerationEU program totals €806.9 billion, underpinning tenders. Timing of appropriations and tenders constrains backlog visibility. Local content rules force adjusted supplier portfolios. Strong public-sector sales capabilities are a clear competitive lever.

Localization and industrial policy
Buy-local rules and reshoring incentives are shifting preferred vendors and SKUs, pressuring Sonepar—present in 44 countries with ~47,000 employees and reported 2023 sales of €36.6bn—to adapt assortments and sourcing. Compliance with origin documentation and certifications is rising in priority across EU and US markets. Regional DC footprints may need rebalancing to meet local content rules, deepening ties with local manufacturers while complicating global contracts.
- Vendor/SKU shifts driven by buy-local and reshoring
- Higher importance of origin docs and certifications
- DC footprint rebalancing to qualify for incentives
- Stronger local manufacturer ties vs more complex global contracts
Political stability and regulatory predictability
Operating through 3,200+ local branches across 40+ countries exposes Sonepar to wide stability profiles; sudden regulatory changes can swiftly alter safety standards, pricing or channel rules and affect local margins. Robust country-risk monitoring guides inventory and credit limits, while insurance and contingency logistics cut disruption costs and preserve working capital.
- 40+ countries
- 3,200+ branches
- ~48,000 employees
- country-risk monitoring drives inventory/credit caps
Electrification surge expands market across 44 countries as tariffs raise landed costs
Decarbonization policies (eg US IRA ~$369bn) and public capex (IIJA ~$1.2tn, EU NextGenerationEU €806.9bn) expand Sonepar’s electrification addressable market but require tight policy-timed inventory. Tariffs up to ~25% and export controls raise landed costs ~10–25% and force multi‑regional sourcing. Buy‑local/reshoring and local content rules pressure assortments, DC footprints and supplier contracts across 44 countries.
| Metric | Value |
|---|---|
| Countries | 44 |
| Branches | ~3,200 |
| Employees | ~47,000 |
| 2023 Sales | €36.6bn |
What is included in the product
 Detailed Word Document
Explores how external macro-environmental factors uniquely affect Sonepar across Political, Economic, Social, Technological, Environmental and Legal dimensions, with data-driven trends and region-specific regulatory context. Designed for executives and advisors, the analysis highlights risks, opportunities and forward-looking scenarios to inform strategy, funding and operational planning.

 Customizable Excel Spreadsheet
A concise, visually segmented Sonepar PESTLE summary that’s easy to drop into presentations, annotate with region- or business-line-specific notes, and share across teams to streamline strategic planning and risk discussions.
Economic factors

Construction and industrial cycles
Residential, commercial and industrial activity directly drive Sonepar order flow; newbuilds boost high-SKU project sales while retrofits lift margin-rich repeat SKUs. MRO and counter-cyclical services smoothed 2024 downturns, supporting recurring revenues. Forecasting must blend PMI (global manufacturing ~50 in 2024), US housing starts (~1.33M annualized in 2024) and capex growth (~2% global 2024).
Commodity and input price volatility
Copper (~$8,500–10,000/t in 2024–25), aluminum and plastics drive cable/component costs, with metals often comprising a large share of BOM costs and causing margin compression when price lists lag spot moves. Rapid spikes have shortened price-list reaction times, so indexed contracts and dynamic pricing tools are increasingly used to pass through cost changes. Closer supplier collaboration and optimized buffer stock reduce exposure during short-lived spikes.

Supply chain and freight costs
Ocean, air and trucking rates drive Sonepar's delivered cost and service: global container rates fell from pandemic peaks near 14,000 USD/FEU to about 2,000 USD/FEU in 2024 (Drewry), while air freight remained roughly 30% above 2019 levels (IATA). Disruptions force 20–30% higher safety stock, tying up working capital and raising inventory days. Network optimization and nearshoring can cut lead-time variability by ~40% (McKinsey), and vendor-managed inventory has reduced stockouts by ~25% in distribution pilots.

Foreign exchange fluctuations
- 44 countries operational footprint
- ~48,000 employees
- Key mitigants: forward hedges, netting, local pricing
- Priority: align supplier-customer currency mix
Interest rates and credit conditions
Higher policy rates (US Fed funds 5.25–5.50% in mid‑2025; ECB deposit ~4.00%) raise carrying costs for inventory and receivables and tighten customer financing, reducing contractor purchasing power; ECB Bank Lending Survey Q1 2025 reports tighter lending standards. Strong credit control and digital collections sustain cash flow, while extended vendor terms and trade receivables securitization can release working capital.
- Carry cost rise: higher short‑term rates
- Customer finance: tighter, hurts contractors
- Mitigant: digital collections, strict credit
- Free WC: vendor terms, securitization
Electrification surge expands market across 44 countries as tariffs raise landed costs
Demand tied to construction and industry: US housing starts ~1.33M (2024) and global PMI ~50 (2024) shape volumes; MRO counters cyclicality. Input-costs volatile: copper ~9,000 USD/t (2024–25) compress margins; indexed contracts mitigate pass-through lag. Logistics and FX impact working capital: global container ~2,000 USD/FEU (2024); FX hedging and vendor terms reduce exposure.
| Metric | Value |
|---|---|
| Countries / Employees | 44 / ~48,000 |
| Copper | ~9,000 USD/t (2024–25) |
| US housing starts | ~1.33M (2024) |
| Container rate | ~2,000 USD/FEU (2024) |
| Fed funds | 5.25–5.50% (mid‑2025) |
Preview Before You Purchase
Sonepar PESTLE Analysis
This Sonepar PESTLE analysis delivers a concise, actionable examination of political, economic, social, technological, legal and environmental factors affecting the company. The content and structure shown in the preview is the same document you’ll download after payment. It's fully formatted and ready to use.

Your Competitive Advantage Starts with This Report
Unlock how political shifts, supply-chain dynamics, and green regulations are reshaping Sonepar’s trajectory. Our concise PESTLE highlights risks and growth levers to inform investment and strategy decisions. Buy the full analysis for the detailed, downloadable report and actionable insights.
Political factors
Energy transition policies
Governments’ decarbonization agendas (eg US IRA ~$369bn in clean energy incentives) are driving stronger demand for electrification, renewables and efficiency products, boosting Sonepar’s addressable market. Incentives and mandates reshape product mix and margins across markets, so Sonepar must track policy timetables and align inventory and solutions. Election cycles and policy reversals can rapidly whipsaw demand planning and working capital needs.
Trade tariffs and geopolitical tensions
Tariffs on electrical components (eg US Section 301 measures up to 25%) can raise landed costs by roughly 10–25% and force sourcing shifts. Sanctions and export controls (eg 2022 US chip curbs) and geopolitical risk can abruptly disrupt supplier availability. Sonepar’s footprint in about 44 countries supports multi-region procurement to mitigate exposure. Contract terms should allocate tariff risk between customers and suppliers.
Public infrastructure and stimulus spending
Government capex in grids, EV charging and public buildings boosts distributor volumes; in the US the 2021 Infrastructure Investment and Jobs Act totals roughly $1.2 trillion with $7.5 billion for EV charging, and the EU’s NextGenerationEU program totals €806.9 billion, underpinning tenders. Timing of appropriations and tenders constrains backlog visibility. Local content rules force adjusted supplier portfolios. Strong public-sector sales capabilities are a clear competitive lever.
Localization and industrial policy
Buy-local rules and reshoring incentives are shifting preferred vendors and SKUs, pressuring Sonepar—present in 44 countries with ~47,000 employees and reported 2023 sales of €36.6bn—to adapt assortments and sourcing. Compliance with origin documentation and certifications is rising in priority across EU and US markets. Regional DC footprints may need rebalancing to meet local content rules, deepening ties with local manufacturers while complicating global contracts.
- Vendor/SKU shifts driven by buy-local and reshoring
- Higher importance of origin docs and certifications
- DC footprint rebalancing to qualify for incentives
- Stronger local manufacturer ties vs more complex global contracts
Political stability and regulatory predictability
Operating through 3,200+ local branches across 40+ countries exposes Sonepar to wide stability profiles; sudden regulatory changes can swiftly alter safety standards, pricing or channel rules and affect local margins. Robust country-risk monitoring guides inventory and credit limits, while insurance and contingency logistics cut disruption costs and preserve working capital.
- 40+ countries
- 3,200+ branches
- ~48,000 employees
- country-risk monitoring drives inventory/credit caps
Electrification surge expands market across 44 countries as tariffs raise landed costs
Decarbonization policies (eg US IRA ~$369bn) and public capex (IIJA ~$1.2tn, EU NextGenerationEU €806.9bn) expand Sonepar’s electrification addressable market but require tight policy-timed inventory. Tariffs up to ~25% and export controls raise landed costs ~10–25% and force multi‑regional sourcing. Buy‑local/reshoring and local content rules pressure assortments, DC footprints and supplier contracts across 44 countries.
| Metric | Value |
|---|---|
| Countries | 44 |
| Branches | ~3,200 |
| Employees | ~47,000 |
| 2023 Sales | €36.6bn |
What is included in the product
Detailed Word Document
Explores how external macro-environmental factors uniquely affect Sonepar across Political, Economic, Social, Technological, Environmental and Legal dimensions, with data-driven trends and region-specific regulatory context. Designed for executives and advisors, the analysis highlights risks, opportunities and forward-looking scenarios to inform strategy, funding and operational planning.
Customizable Excel Spreadsheet
A concise, visually segmented Sonepar PESTLE summary that’s easy to drop into presentations, annotate with region- or business-line-specific notes, and share across teams to streamline strategic planning and risk discussions.
Economic factors
Construction and industrial cycles
Residential, commercial and industrial activity directly drive Sonepar order flow; newbuilds boost high-SKU project sales while retrofits lift margin-rich repeat SKUs. MRO and counter-cyclical services smoothed 2024 downturns, supporting recurring revenues. Forecasting must blend PMI (global manufacturing ~50 in 2024), US housing starts (~1.33M annualized in 2024) and capex growth (~2% global 2024).
Commodity and input price volatility
Copper (~$8,500–10,000/t in 2024–25), aluminum and plastics drive cable/component costs, with metals often comprising a large share of BOM costs and causing margin compression when price lists lag spot moves. Rapid spikes have shortened price-list reaction times, so indexed contracts and dynamic pricing tools are increasingly used to pass through cost changes. Closer supplier collaboration and optimized buffer stock reduce exposure during short-lived spikes.
Supply chain and freight costs
Ocean, air and trucking rates drive Sonepar's delivered cost and service: global container rates fell from pandemic peaks near 14,000 USD/FEU to about 2,000 USD/FEU in 2024 (Drewry), while air freight remained roughly 30% above 2019 levels (IATA). Disruptions force 20–30% higher safety stock, tying up working capital and raising inventory days. Network optimization and nearshoring can cut lead-time variability by ~40% (McKinsey), and vendor-managed inventory has reduced stockouts by ~25% in distribution pilots.
Foreign exchange fluctuations
- 44 countries operational footprint
- ~48,000 employees
- Key mitigants: forward hedges, netting, local pricing
- Priority: align supplier-customer currency mix
Interest rates and credit conditions
Higher policy rates (US Fed funds 5.25–5.50% in mid‑2025; ECB deposit ~4.00%) raise carrying costs for inventory and receivables and tighten customer financing, reducing contractor purchasing power; ECB Bank Lending Survey Q1 2025 reports tighter lending standards. Strong credit control and digital collections sustain cash flow, while extended vendor terms and trade receivables securitization can release working capital.
- Carry cost rise: higher short‑term rates
- Customer finance: tighter, hurts contractors
- Mitigant: digital collections, strict credit
- Free WC: vendor terms, securitization
Electrification surge expands market across 44 countries as tariffs raise landed costs
Demand tied to construction and industry: US housing starts ~1.33M (2024) and global PMI ~50 (2024) shape volumes; MRO counters cyclicality. Input-costs volatile: copper ~9,000 USD/t (2024–25) compress margins; indexed contracts mitigate pass-through lag. Logistics and FX impact working capital: global container ~2,000 USD/FEU (2024); FX hedging and vendor terms reduce exposure.
| Metric | Value |
|---|---|
| Countries / Employees | 44 / ~48,000 |
| Copper | ~9,000 USD/t (2024–25) |
| US housing starts | ~1.33M (2024) |
| Container rate | ~2,000 USD/FEU (2024) |
| Fed funds | 5.25–5.50% (mid‑2025) |
Preview Before You Purchase
Sonepar PESTLE Analysis
This Sonepar PESTLE analysis delivers a concise, actionable examination of political, economic, social, technological, legal and environmental factors affecting the company. The content and structure shown in the preview is the same document you’ll download after payment. It's fully formatted and ready to use.
Description
Your Competitive Advantage Starts with This Report
Unlock how political shifts, supply-chain dynamics, and green regulations are reshaping Sonepar’s trajectory. Our concise PESTLE highlights risks and growth levers to inform investment and strategy decisions. Buy the full analysis for the detailed, downloadable report and actionable insights.
Political factors
Energy transition policies
Governments’ decarbonization agendas (eg US IRA ~$369bn in clean energy incentives) are driving stronger demand for electrification, renewables and efficiency products, boosting Sonepar’s addressable market. Incentives and mandates reshape product mix and margins across markets, so Sonepar must track policy timetables and align inventory and solutions. Election cycles and policy reversals can rapidly whipsaw demand planning and working capital needs.
Trade tariffs and geopolitical tensions
Tariffs on electrical components (eg US Section 301 measures up to 25%) can raise landed costs by roughly 10–25% and force sourcing shifts. Sanctions and export controls (eg 2022 US chip curbs) and geopolitical risk can abruptly disrupt supplier availability. Sonepar’s footprint in about 44 countries supports multi-region procurement to mitigate exposure. Contract terms should allocate tariff risk between customers and suppliers.
Public infrastructure and stimulus spending
Government capex in grids, EV charging and public buildings boosts distributor volumes; in the US the 2021 Infrastructure Investment and Jobs Act totals roughly $1.2 trillion with $7.5 billion for EV charging, and the EU’s NextGenerationEU program totals €806.9 billion, underpinning tenders. Timing of appropriations and tenders constrains backlog visibility. Local content rules force adjusted supplier portfolios. Strong public-sector sales capabilities are a clear competitive lever.
Localization and industrial policy
Buy-local rules and reshoring incentives are shifting preferred vendors and SKUs, pressuring Sonepar—present in 44 countries with ~47,000 employees and reported 2023 sales of €36.6bn—to adapt assortments and sourcing. Compliance with origin documentation and certifications is rising in priority across EU and US markets. Regional DC footprints may need rebalancing to meet local content rules, deepening ties with local manufacturers while complicating global contracts.
- Vendor/SKU shifts driven by buy-local and reshoring
- Higher importance of origin docs and certifications
- DC footprint rebalancing to qualify for incentives
- Stronger local manufacturer ties vs more complex global contracts
Political stability and regulatory predictability
Operating through 3,200+ local branches across 40+ countries exposes Sonepar to wide stability profiles; sudden regulatory changes can swiftly alter safety standards, pricing or channel rules and affect local margins. Robust country-risk monitoring guides inventory and credit limits, while insurance and contingency logistics cut disruption costs and preserve working capital.
- 40+ countries
- 3,200+ branches
- ~48,000 employees
- country-risk monitoring drives inventory/credit caps
Electrification surge expands market across 44 countries as tariffs raise landed costs
Decarbonization policies (eg US IRA ~$369bn) and public capex (IIJA ~$1.2tn, EU NextGenerationEU €806.9bn) expand Sonepar’s electrification addressable market but require tight policy-timed inventory. Tariffs up to ~25% and export controls raise landed costs ~10–25% and force multi‑regional sourcing. Buy‑local/reshoring and local content rules pressure assortments, DC footprints and supplier contracts across 44 countries.
| Metric | Value |
|---|---|
| Countries | 44 |
| Branches | ~3,200 |
| Employees | ~47,000 |
| 2023 Sales | €36.6bn |
What is included in the product
Detailed Word Document
Explores how external macro-environmental factors uniquely affect Sonepar across Political, Economic, Social, Technological, Environmental and Legal dimensions, with data-driven trends and region-specific regulatory context. Designed for executives and advisors, the analysis highlights risks, opportunities and forward-looking scenarios to inform strategy, funding and operational planning.
Customizable Excel Spreadsheet
A concise, visually segmented Sonepar PESTLE summary that’s easy to drop into presentations, annotate with region- or business-line-specific notes, and share across teams to streamline strategic planning and risk discussions.
Economic factors
Construction and industrial cycles
Residential, commercial and industrial activity directly drive Sonepar order flow; newbuilds boost high-SKU project sales while retrofits lift margin-rich repeat SKUs. MRO and counter-cyclical services smoothed 2024 downturns, supporting recurring revenues. Forecasting must blend PMI (global manufacturing ~50 in 2024), US housing starts (~1.33M annualized in 2024) and capex growth (~2% global 2024).
Commodity and input price volatility
Copper (~$8,500–10,000/t in 2024–25), aluminum and plastics drive cable/component costs, with metals often comprising a large share of BOM costs and causing margin compression when price lists lag spot moves. Rapid spikes have shortened price-list reaction times, so indexed contracts and dynamic pricing tools are increasingly used to pass through cost changes. Closer supplier collaboration and optimized buffer stock reduce exposure during short-lived spikes.
Supply chain and freight costs
Ocean, air and trucking rates drive Sonepar's delivered cost and service: global container rates fell from pandemic peaks near 14,000 USD/FEU to about 2,000 USD/FEU in 2024 (Drewry), while air freight remained roughly 30% above 2019 levels (IATA). Disruptions force 20–30% higher safety stock, tying up working capital and raising inventory days. Network optimization and nearshoring can cut lead-time variability by ~40% (McKinsey), and vendor-managed inventory has reduced stockouts by ~25% in distribution pilots.
Foreign exchange fluctuations
- 44 countries operational footprint
- ~48,000 employees
- Key mitigants: forward hedges, netting, local pricing
- Priority: align supplier-customer currency mix
Interest rates and credit conditions
Higher policy rates (US Fed funds 5.25–5.50% in mid‑2025; ECB deposit ~4.00%) raise carrying costs for inventory and receivables and tighten customer financing, reducing contractor purchasing power; ECB Bank Lending Survey Q1 2025 reports tighter lending standards. Strong credit control and digital collections sustain cash flow, while extended vendor terms and trade receivables securitization can release working capital.
- Carry cost rise: higher short‑term rates
- Customer finance: tighter, hurts contractors
- Mitigant: digital collections, strict credit
- Free WC: vendor terms, securitization
Electrification surge expands market across 44 countries as tariffs raise landed costs
Demand tied to construction and industry: US housing starts ~1.33M (2024) and global PMI ~50 (2024) shape volumes; MRO counters cyclicality. Input-costs volatile: copper ~9,000 USD/t (2024–25) compress margins; indexed contracts mitigate pass-through lag. Logistics and FX impact working capital: global container ~2,000 USD/FEU (2024); FX hedging and vendor terms reduce exposure.
| Metric | Value |
|---|---|
| Countries / Employees | 44 / ~48,000 |
| Copper | ~9,000 USD/t (2024–25) |
| US housing starts | ~1.33M (2024) |
| Container rate | ~2,000 USD/FEU (2024) |
| Fed funds | 5.25–5.50% (mid‑2025) |
Preview Before You Purchase
Sonepar PESTLE Analysis
This Sonepar PESTLE analysis delivers a concise, actionable examination of political, economic, social, technological, legal and environmental factors affecting the company. The content and structure shown in the preview is the same document you’ll download after payment. It's fully formatted and ready to use.











