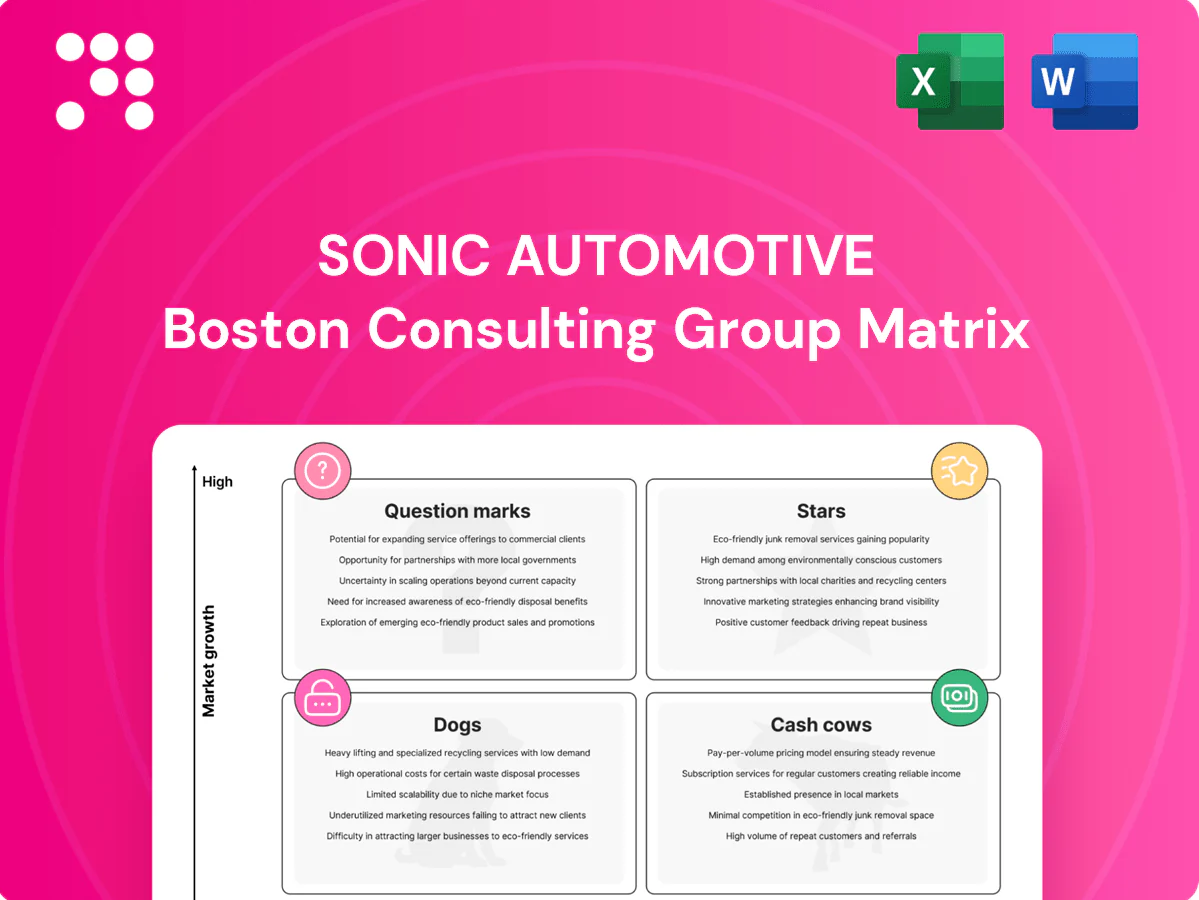
Sonic Automotive Boston Consulting Group Matrix

See the Bigger Picture
Sonic Automotive’s BCG Matrix snapshot shows where its dealerships and services sit—some units driving growth, others quietly funding operations, and a few that need tough decisions. Want the full picture with quadrant placements, data-backed recommendations, and a clear playbook for reallocating capital? Purchase the complete BCG Matrix for a downloadable Word report and an Excel summary you can use in board meetings and strategy sessions—instant clarity, no guesswork.
Stars

Scaled used-vehicle retail
Scaled used-vehicle retail is a Star for Sonic: 2024 US used-retail demand remained robust (≈28M retail units), and Sonic’s scale across 100+ locations drives strong local share, supporting pricing and turn rates. Continued investment in marketing and inventory tech is required to keep velocity high. As growth moderates, maintaining share will convert this segment into a cash cow.
F&I products and protection plans
High attach rates in a growing penetration market make F&I products and protection plans a clear leader inside Sonic stores, turning every retail sale into a shot on goal for service contracts, GAP, and ancillaries. Sustaining momentum requires robust training and compliance muscle to protect margins and reputation. Continued investment is warranted — F&I is highly cash-generative and still underpenetrated versus its long-term potential.

Light truck and SUV retail mix
U.S. light-truck and SUV retail share reached about 73% in 2024, and Sonic sells these vehicles at scale across its franchise portfolio, supporting higher unit volumes and average selling prices. High share across multiple brands drives elevated gross per unit and contributes materially to retail margins. Marketing, allocation and dealer-level flooring still require heavy investment and operational attention. As the category normalizes, this Stars segment can transition into cash cow status.

Service retention on newer vehicle cohorts
Warranty and first‑owner service lanes are packed and Sonic has the physical bay capacity to capture them; with the US light‑vehicle parc at about 283 million in 2024 and average vehicle age ~12.5 years, newer cohorts drive increasing factory warranty work and higher capture rates, reinforcing Sonic’s share leadership. Keeping throughput needs skilled techs, expanded capacity, and advanced scheduling tools to lock future cash‑cow service margins.
- Capture rate: leverages growing newer‑vehicle parc (US parc ~283M in 2024)
- Operational needs: bay capacity, certified techs, real‑time scheduling
- Financial payoff: sustain edge to secure recurring high‑margin service cash flow
Digital retail lead-gen + desking
Online lead capture and remote desking expanded in 2024, with Sonic reporting digital lead volume growth of ~35% year-over-year and conversion rates up about 20% as workflows improved, signaling share leadership across its footprint.
Continued investment in paid media, UX tweaks and BDC staffing is required; maintain spend cadence — today's digital investment seeds tomorrow's cash.
- digital-growth: 35% (2024)
- conversion-lift: 20% (2024)
- needs: paid-media, UX, BDC
Used-vehicle boom: 28M retail, 73% SUV mix boosts margins
Scaled used-vehicle retail, high F&I attach, SUV/light‑truck dominance, and service capture are Sonic Stars in 2024, driven by ~28M US used-retail, 73% SUV mix, and 283M vehicle parc. Digital lead volume rose ~35% (2024) with conversion +20%, supporting share and margins. Continued investment in marketing, tech, certified techs and flooring will convert Stars to cash cows.
| Metric | 2024 |
|---|---|
| US used retail | ≈28M units |
| SUV/light‑truck mix | 73% |
| US parc | 283M vehicles |
| Digital lead growth | +35% |
| Digital conversion lift | +20% |
What is included in the product
 Detailed Word Document
BCG analysis of Sonic Automotive: Stars, Cash Cows, Question Marks, Dogs with investment, hold, divest guidance and trend context.

 Customizable Excel Spreadsheet
One-page BCG matrix for Sonic Automotive, placing each business unit in a quadrant to spotlight priorities and relieve decision bottlenecks.
Cash Cows

Franchised new-car sales in mature segments
Franchised new-car sales in mature segments are Sonic Automotive’s dependable cash cow: steady demand and tight OEM relationships (SAH) plus strong local share at its 100+ franchise locations generate consistent monthly floorplan turns. Margins are modest but high volumes and factory incentive programs smooth EBITDA variability; low incremental promotional spend keeps unit economics stable. Cash flow funds working capital and debt service.
Core parts and service (out-of-warranty)
Core parts and out-of-warranty service at Sonic Automotive remained steady in 2024, delivering predictable ticket volumes and a loyal customer base. These fixed operations sustain higher gross margins with low top-line growth, fitting a classic cash cow profile. Targeted 2024 investments in bays and tooling improved throughput and labor productivity. Generated cash is funneled to support growth bets like digital retailing and new franchise acquisitions.

Trade-in sourcing from repeat customers
Trade-in sourcing from repeat customers provides Sonic Automotive a reliable, low-CAC inventory stream that supports modest same-store used-vehicle growth and steady margins; in 2024 Sonic reported roughly $12 billion in revenue, with used-vehicle operations remaining a key cash generator. Small reconditioning and process tweaks shorten cycles and lift gross per unit, quietly producing free cash flow with minimal incremental spend.

Local market leader dealerships
Local market leader dealerships sustain entrenched brand equity and typically lead PMA share, making them difficult for competitors to dislodge; in 2024 these locations continued to deliver higher fixed-ops profitability and steadier retail margins compared with fringe stores. Minimal promotional spend beyond presence and community engagement preserves margin; keep productivity flat-to-up and harvest cash flows.
- Market leadership: defensive moat
- Promo: low incremental spend
- Ops: prioritize flat→up productivity
- Strategy: harvest gains, fund reinvestment
Finance reserve on prime credit
Stable lender relationships and investment in prime paper produced predictable reserve income for Sonic Automotive, aided by a US prime rate of 8.50% and fed funds near 5.25–5.50% in 2024; compliance-driven processes keep credit risk low while reserves reliably cover overhead and support dividend policy.
- Stable yields: short-term prime paper ~5% (2024)
- Low risk: strict compliance/process controls
- Cash use: covers operating costs + dividends
Franchise cash engine: steady free cash flow funds digital retailing and selective growth
Franchised new-car sales, fixed operations and trade-in sourcing were Sonic Automotive’s primary cash cows in 2024, funding capex and acquisitions while generating steady free cash flow. Low incremental promo spend and strong PMA positions preserved margins; lender yields and reserves added predictable income. Harvest cash to fund digital retailing and selective franchise growth.
| Metric | 2024 |
|---|---|
| Revenue | $12.0B |
| Franchise locations | 100+ |
| US prime rate | 8.50% |
| Short-term yields | ~5% |
What You See Is What You Get
Sonic Automotive BCG Matrix
The file you're previewing on this page is the exact Sonic Automotive BCG Matrix you'll receive after purchase. No watermarks or demo placeholders—just a fully formatted, market-savvy analysis ready for strategy meetings. After buying, the full editable report is delivered instantly to your inbox. Use it for presentations, planning, or investor decks with confidence.

See the Bigger Picture
Sonic Automotive’s BCG Matrix snapshot shows where its dealerships and services sit—some units driving growth, others quietly funding operations, and a few that need tough decisions. Want the full picture with quadrant placements, data-backed recommendations, and a clear playbook for reallocating capital? Purchase the complete BCG Matrix for a downloadable Word report and an Excel summary you can use in board meetings and strategy sessions—instant clarity, no guesswork.
Stars
Scaled used-vehicle retail
Scaled used-vehicle retail is a Star for Sonic: 2024 US used-retail demand remained robust (≈28M retail units), and Sonic’s scale across 100+ locations drives strong local share, supporting pricing and turn rates. Continued investment in marketing and inventory tech is required to keep velocity high. As growth moderates, maintaining share will convert this segment into a cash cow.
F&I products and protection plans
High attach rates in a growing penetration market make F&I products and protection plans a clear leader inside Sonic stores, turning every retail sale into a shot on goal for service contracts, GAP, and ancillaries. Sustaining momentum requires robust training and compliance muscle to protect margins and reputation. Continued investment is warranted — F&I is highly cash-generative and still underpenetrated versus its long-term potential.
Light truck and SUV retail mix
U.S. light-truck and SUV retail share reached about 73% in 2024, and Sonic sells these vehicles at scale across its franchise portfolio, supporting higher unit volumes and average selling prices. High share across multiple brands drives elevated gross per unit and contributes materially to retail margins. Marketing, allocation and dealer-level flooring still require heavy investment and operational attention. As the category normalizes, this Stars segment can transition into cash cow status.
Service retention on newer vehicle cohorts
Warranty and first‑owner service lanes are packed and Sonic has the physical bay capacity to capture them; with the US light‑vehicle parc at about 283 million in 2024 and average vehicle age ~12.5 years, newer cohorts drive increasing factory warranty work and higher capture rates, reinforcing Sonic’s share leadership. Keeping throughput needs skilled techs, expanded capacity, and advanced scheduling tools to lock future cash‑cow service margins.
- Capture rate: leverages growing newer‑vehicle parc (US parc ~283M in 2024)
- Operational needs: bay capacity, certified techs, real‑time scheduling
- Financial payoff: sustain edge to secure recurring high‑margin service cash flow
Digital retail lead-gen + desking
Online lead capture and remote desking expanded in 2024, with Sonic reporting digital lead volume growth of ~35% year-over-year and conversion rates up about 20% as workflows improved, signaling share leadership across its footprint.
Continued investment in paid media, UX tweaks and BDC staffing is required; maintain spend cadence — today's digital investment seeds tomorrow's cash.
- digital-growth: 35% (2024)
- conversion-lift: 20% (2024)
- needs: paid-media, UX, BDC
Used-vehicle boom: 28M retail, 73% SUV mix boosts margins
Scaled used-vehicle retail, high F&I attach, SUV/light‑truck dominance, and service capture are Sonic Stars in 2024, driven by ~28M US used-retail, 73% SUV mix, and 283M vehicle parc. Digital lead volume rose ~35% (2024) with conversion +20%, supporting share and margins. Continued investment in marketing, tech, certified techs and flooring will convert Stars to cash cows.
| Metric | 2024 |
|---|---|
| US used retail | ≈28M units |
| SUV/light‑truck mix | 73% |
| US parc | 283M vehicles |
| Digital lead growth | +35% |
| Digital conversion lift | +20% |
What is included in the product
Detailed Word Document
BCG analysis of Sonic Automotive: Stars, Cash Cows, Question Marks, Dogs with investment, hold, divest guidance and trend context.
Customizable Excel Spreadsheet
One-page BCG matrix for Sonic Automotive, placing each business unit in a quadrant to spotlight priorities and relieve decision bottlenecks.
Cash Cows
Franchised new-car sales in mature segments
Franchised new-car sales in mature segments are Sonic Automotive’s dependable cash cow: steady demand and tight OEM relationships (SAH) plus strong local share at its 100+ franchise locations generate consistent monthly floorplan turns. Margins are modest but high volumes and factory incentive programs smooth EBITDA variability; low incremental promotional spend keeps unit economics stable. Cash flow funds working capital and debt service.
Core parts and service (out-of-warranty)
Core parts and out-of-warranty service at Sonic Automotive remained steady in 2024, delivering predictable ticket volumes and a loyal customer base. These fixed operations sustain higher gross margins with low top-line growth, fitting a classic cash cow profile. Targeted 2024 investments in bays and tooling improved throughput and labor productivity. Generated cash is funneled to support growth bets like digital retailing and new franchise acquisitions.
Trade-in sourcing from repeat customers
Trade-in sourcing from repeat customers provides Sonic Automotive a reliable, low-CAC inventory stream that supports modest same-store used-vehicle growth and steady margins; in 2024 Sonic reported roughly $12 billion in revenue, with used-vehicle operations remaining a key cash generator. Small reconditioning and process tweaks shorten cycles and lift gross per unit, quietly producing free cash flow with minimal incremental spend.
Local market leader dealerships
Local market leader dealerships sustain entrenched brand equity and typically lead PMA share, making them difficult for competitors to dislodge; in 2024 these locations continued to deliver higher fixed-ops profitability and steadier retail margins compared with fringe stores. Minimal promotional spend beyond presence and community engagement preserves margin; keep productivity flat-to-up and harvest cash flows.
- Market leadership: defensive moat
- Promo: low incremental spend
- Ops: prioritize flat→up productivity
- Strategy: harvest gains, fund reinvestment
Finance reserve on prime credit
Stable lender relationships and investment in prime paper produced predictable reserve income for Sonic Automotive, aided by a US prime rate of 8.50% and fed funds near 5.25–5.50% in 2024; compliance-driven processes keep credit risk low while reserves reliably cover overhead and support dividend policy.
- Stable yields: short-term prime paper ~5% (2024)
- Low risk: strict compliance/process controls
- Cash use: covers operating costs + dividends
Franchise cash engine: steady free cash flow funds digital retailing and selective growth
Franchised new-car sales, fixed operations and trade-in sourcing were Sonic Automotive’s primary cash cows in 2024, funding capex and acquisitions while generating steady free cash flow. Low incremental promo spend and strong PMA positions preserved margins; lender yields and reserves added predictable income. Harvest cash to fund digital retailing and selective franchise growth.
| Metric | 2024 |
|---|---|
| Revenue | $12.0B |
| Franchise locations | 100+ |
| US prime rate | 8.50% |
| Short-term yields | ~5% |
What You See Is What You Get
Sonic Automotive BCG Matrix
The file you're previewing on this page is the exact Sonic Automotive BCG Matrix you'll receive after purchase. No watermarks or demo placeholders—just a fully formatted, market-savvy analysis ready for strategy meetings. After buying, the full editable report is delivered instantly to your inbox. Use it for presentations, planning, or investor decks with confidence.
Original: $10.00
-65%$10.00
$3.50Description
See the Bigger Picture
Sonic Automotive’s BCG Matrix snapshot shows where its dealerships and services sit—some units driving growth, others quietly funding operations, and a few that need tough decisions. Want the full picture with quadrant placements, data-backed recommendations, and a clear playbook for reallocating capital? Purchase the complete BCG Matrix for a downloadable Word report and an Excel summary you can use in board meetings and strategy sessions—instant clarity, no guesswork.
Stars
Scaled used-vehicle retail
Scaled used-vehicle retail is a Star for Sonic: 2024 US used-retail demand remained robust (≈28M retail units), and Sonic’s scale across 100+ locations drives strong local share, supporting pricing and turn rates. Continued investment in marketing and inventory tech is required to keep velocity high. As growth moderates, maintaining share will convert this segment into a cash cow.
F&I products and protection plans
High attach rates in a growing penetration market make F&I products and protection plans a clear leader inside Sonic stores, turning every retail sale into a shot on goal for service contracts, GAP, and ancillaries. Sustaining momentum requires robust training and compliance muscle to protect margins and reputation. Continued investment is warranted — F&I is highly cash-generative and still underpenetrated versus its long-term potential.
Light truck and SUV retail mix
U.S. light-truck and SUV retail share reached about 73% in 2024, and Sonic sells these vehicles at scale across its franchise portfolio, supporting higher unit volumes and average selling prices. High share across multiple brands drives elevated gross per unit and contributes materially to retail margins. Marketing, allocation and dealer-level flooring still require heavy investment and operational attention. As the category normalizes, this Stars segment can transition into cash cow status.
Service retention on newer vehicle cohorts
Warranty and first‑owner service lanes are packed and Sonic has the physical bay capacity to capture them; with the US light‑vehicle parc at about 283 million in 2024 and average vehicle age ~12.5 years, newer cohorts drive increasing factory warranty work and higher capture rates, reinforcing Sonic’s share leadership. Keeping throughput needs skilled techs, expanded capacity, and advanced scheduling tools to lock future cash‑cow service margins.
- Capture rate: leverages growing newer‑vehicle parc (US parc ~283M in 2024)
- Operational needs: bay capacity, certified techs, real‑time scheduling
- Financial payoff: sustain edge to secure recurring high‑margin service cash flow
Digital retail lead-gen + desking
Online lead capture and remote desking expanded in 2024, with Sonic reporting digital lead volume growth of ~35% year-over-year and conversion rates up about 20% as workflows improved, signaling share leadership across its footprint.
Continued investment in paid media, UX tweaks and BDC staffing is required; maintain spend cadence — today's digital investment seeds tomorrow's cash.
- digital-growth: 35% (2024)
- conversion-lift: 20% (2024)
- needs: paid-media, UX, BDC
Used-vehicle boom: 28M retail, 73% SUV mix boosts margins
Scaled used-vehicle retail, high F&I attach, SUV/light‑truck dominance, and service capture are Sonic Stars in 2024, driven by ~28M US used-retail, 73% SUV mix, and 283M vehicle parc. Digital lead volume rose ~35% (2024) with conversion +20%, supporting share and margins. Continued investment in marketing, tech, certified techs and flooring will convert Stars to cash cows.
| Metric | 2024 |
|---|---|
| US used retail | ≈28M units |
| SUV/light‑truck mix | 73% |
| US parc | 283M vehicles |
| Digital lead growth | +35% |
| Digital conversion lift | +20% |
What is included in the product
Detailed Word Document
BCG analysis of Sonic Automotive: Stars, Cash Cows, Question Marks, Dogs with investment, hold, divest guidance and trend context.
Customizable Excel Spreadsheet
One-page BCG matrix for Sonic Automotive, placing each business unit in a quadrant to spotlight priorities and relieve decision bottlenecks.
Cash Cows
Franchised new-car sales in mature segments
Franchised new-car sales in mature segments are Sonic Automotive’s dependable cash cow: steady demand and tight OEM relationships (SAH) plus strong local share at its 100+ franchise locations generate consistent monthly floorplan turns. Margins are modest but high volumes and factory incentive programs smooth EBITDA variability; low incremental promotional spend keeps unit economics stable. Cash flow funds working capital and debt service.
Core parts and service (out-of-warranty)
Core parts and out-of-warranty service at Sonic Automotive remained steady in 2024, delivering predictable ticket volumes and a loyal customer base. These fixed operations sustain higher gross margins with low top-line growth, fitting a classic cash cow profile. Targeted 2024 investments in bays and tooling improved throughput and labor productivity. Generated cash is funneled to support growth bets like digital retailing and new franchise acquisitions.
Trade-in sourcing from repeat customers
Trade-in sourcing from repeat customers provides Sonic Automotive a reliable, low-CAC inventory stream that supports modest same-store used-vehicle growth and steady margins; in 2024 Sonic reported roughly $12 billion in revenue, with used-vehicle operations remaining a key cash generator. Small reconditioning and process tweaks shorten cycles and lift gross per unit, quietly producing free cash flow with minimal incremental spend.
Local market leader dealerships
Local market leader dealerships sustain entrenched brand equity and typically lead PMA share, making them difficult for competitors to dislodge; in 2024 these locations continued to deliver higher fixed-ops profitability and steadier retail margins compared with fringe stores. Minimal promotional spend beyond presence and community engagement preserves margin; keep productivity flat-to-up and harvest cash flows.
- Market leadership: defensive moat
- Promo: low incremental spend
- Ops: prioritize flat→up productivity
- Strategy: harvest gains, fund reinvestment
Finance reserve on prime credit
Stable lender relationships and investment in prime paper produced predictable reserve income for Sonic Automotive, aided by a US prime rate of 8.50% and fed funds near 5.25–5.50% in 2024; compliance-driven processes keep credit risk low while reserves reliably cover overhead and support dividend policy.
- Stable yields: short-term prime paper ~5% (2024)
- Low risk: strict compliance/process controls
- Cash use: covers operating costs + dividends
Franchise cash engine: steady free cash flow funds digital retailing and selective growth
Franchised new-car sales, fixed operations and trade-in sourcing were Sonic Automotive’s primary cash cows in 2024, funding capex and acquisitions while generating steady free cash flow. Low incremental promo spend and strong PMA positions preserved margins; lender yields and reserves added predictable income. Harvest cash to fund digital retailing and selective franchise growth.
| Metric | 2024 |
|---|---|
| Revenue | $12.0B |
| Franchise locations | 100+ |
| US prime rate | 8.50% |
| Short-term yields | ~5% |
What You See Is What You Get
Sonic Automotive BCG Matrix
The file you're previewing on this page is the exact Sonic Automotive BCG Matrix you'll receive after purchase. No watermarks or demo placeholders—just a fully formatted, market-savvy analysis ready for strategy meetings. After buying, the full editable report is delivered instantly to your inbox. Use it for presentations, planning, or investor decks with confidence.











