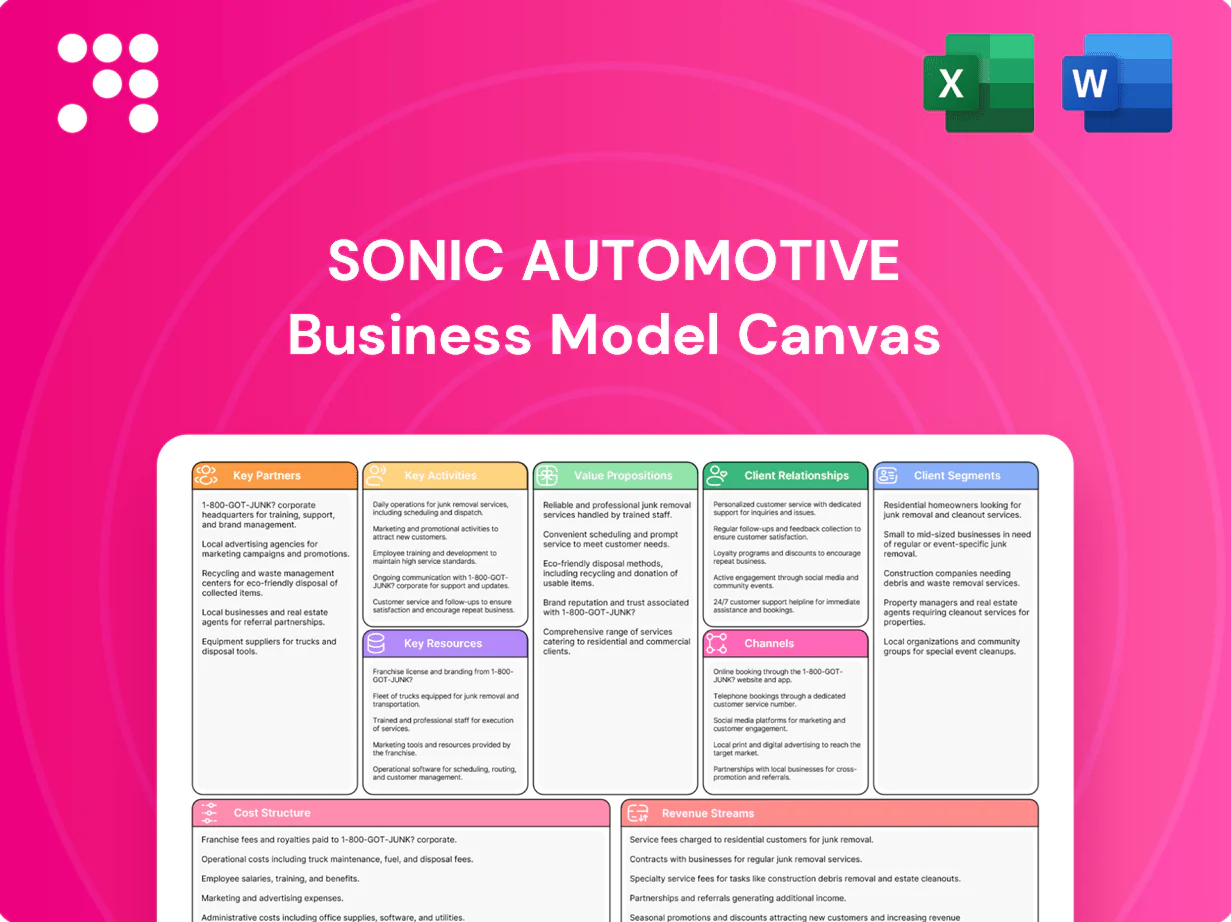
Sonic Automotive Business Model Canvas

Explore a leading auto dealer group's Business Model Canvas: value props, network, revenue
Explore Sonic Automotive’s Business Model Canvas to see how its value propositions, dealer network, and revenue streams align to drive scale and margin. This concise snapshot highlights strategic levers and competitive advantages. Purchase the full canvas for a section-by-section breakdown, editable Word/Excel files, and actionable insights for investors and strategists.
Partnerships

OEM franchise partners
OEM franchise partners secure vehicle supply, training, and brand standards; Sonic Automotive (NYSE: SAH) leverages these ties to support its scale—company revenue was $13.73 billion in 2023—while priority allocations and incentive programs improve margins and inventory mix. Co-op marketing and warranty support boost customer trust and aftersales throughput, and strict OEM KPI compliance sustains franchise value and renewals.
Auto lenders and captive finance
Partnerships with banks and captive finance arms like Ford Credit and Toyota Financial enable Sonic to offer competitive loan and lease options and access OEM subvention programs, including 0% APR offers used to boost affordability.
Faster approvals from integrated lenders raise close rates and deal profitability; U.S. auto loan balances exceeded $1.5 trillion in 2023 (Federal Reserve), underscoring financing scale.
Data integrations streamline F&I workflow and compliance, reducing processing times and shrinkage in paper-based errors.

Insurance and F&I product underwriters
Sonic Automotive (NYSE: SAH) partners with allied underwriters to supply VSCs, GAP, tire-and-wheel and ancillary protection plans that drive F&I revenue and retention.
Shared-risk models and reinsurance structures improve profit per unit while smoothing volatility, aligning with industry moves in 2023–2024 toward captive reinsurance.
Claims support and compliance frameworks reduce chargebacks and protect customer experience, lowering regulatory risk.
Co-developed products are tailored to Sonic’s brand and customer segments to boost take rates and lifetime value.

Parts, tires, and aftermarket suppliers
Reliable parts, tire and aftermarket suppliers keep OEM and aftermarket components in stock, supporting Sonic Automotive’s fixed-ops continuity; the U.S. aftermarket parts market exceeded 300 billion dollars in 2024, underpinning service volume growth. Tiered pricing, volume rebates and preferred-program discounts boost service gross margins, while just-in-time logistics cut bay downtime and inventory carrying costs. Supplier technical support shortens repair cycles and eases warranty claim resolution.
- Reliable OEM availability — supports uptime
- Pricing tiers & rebates — improve margins
- Just-in-time logistics — reduce inventory costs
- Technical support — expedites complex repairs
Auction platforms and remarketers
Auction platforms and remarketers help Sonic Automotive balance aged inventory by channeling vehicles from lots to wholesale and digital marketplaces in 2024, while data-driven bidding tightens acquisition cost control for used vehicles.
- Floorplan rotation: improves cash flow and inventory turns
- Data-driven bidding: lowers acquisition cost
- Condition reports & arbitration: cut reconditioning surprises
Franchise network drives sales: revenue 13.73B, loans > 1.5T, aftermarket > 300B
OEMs, lenders, insurers, suppliers and remarketers form Sonic Automotive’s core partnerships, securing franchise supply, competitive finance offers, F&I products and parts/service continuity that drive sales and fixed-ops margin; company revenue was 13.73 billion in 2023. Integrated lenders and captive finance access tap a US auto loan market >1.5 trillion (2023), while aftermarket suppliers link to a >300 billion US parts market (2024).
| Partnership | Role | 2023/24 Metric |
|---|---|---|
| OEMs | Inventory, brand support | Company revenue 13.73B (2023) |
| Finance partners | Loans, subvention | US auto loans >1.5T (2023) |
| Aftermarket suppliers | Parts, service throughput | US aftermarket >300B (2024) |
What is included in the product
 Detailed Word Document
A comprehensive Business Model Canvas for Sonic Automotive detailing nine blocks—customer segments, value propositions, channels, customer relationships, revenue streams, key resources, activities, partners and cost structure—aligning real-world dealership operations, competitive advantages and linked SWOT to support presentations, investor discussions and strategic decision-making.

 Customizable Excel Spreadsheet
High-level, editable Business Model Canvas tailored to Sonic Automotive that condenses dealership operations, wholesale/retail channels, and service revenue streams into a single page, saving hours of structuring. Shareable and adaptable for teams to quickly identify pain points, optimize inventory/financing strategies, and align sales and service operations.
Activities

Multi-brand vehicle retailing
Sales operations match customers to new and used vehicles across approximately 100 dealerships in 17 states, leveraging digital inventory and CRM to increase conversion. Trade-in appraisals and dynamic pricing management boost front-end gross, supporting Sonic Automotive’s retail scale of roughly 100,000 vehicle retail transactions annually. Streamlined test drives, desking, and delivery processes shorten time-to-sale, while rigorous compliance and documentation ensure regulatory adherence.
F&I origination and product bundling
F&I origination—credit apps, lender matching and deal structuring—drives backend profit, with F&I and fixed ops typically contributing ~30% of dealership gross profit. Menu selling boosts protection-product attach rates by 10–20% by aligning offers to needs. eContracting can cut deal cycle time by ~25–30% and reduce paperwork errors by ~50%. Ongoing lender relations keep spreads and program terms competitive.

Service, maintenance, and repairs
Fixed ops schedule and execute warranty and customer-pay work across Sonic Automotive's dealer network, prioritizing efficient bay utilization and parts availability to lift hours per RO. Ongoing technician training maintains OEM certification quality and reduces comebacks. Customer amenities and shuttle services boost retention and service-lane capture, strengthening recurring revenue streams.

Inventory sourcing and reconditioning
Procurement via trade-ins, off-lease returns, and wholesale auctions fills inventory gaps and matches local demand through targeted buying, leveraging Sonic Automotive (NYSE: SAH) dealer networks.
Consistent reconditioning standards enable certified and retail-ready quality, reducing time-to-retail and warranty exposure while preserving resale value.
Pricing tools and real-time market data optimize turn and margin; professional photoing and merchandising accelerate online conversion and reduce days-to-sale.
- procurement: trade-ins, off-lease, auctions
- quality: certified reconditioning standards
- pricing: market-data-driven turn and margin
- merchandising: photos + listings speed conversion
Digital marketing and omnichannel sales
Digital marketing—SEO, SEM and listings—drives the majority of high-intent leads, with digital influencing about 80% of auto purchase journeys in 2024 (Google). Online pricing, instant trade valuations and refundable deposits enabled remote transactions accounting for roughly 10–20% of retail sales in 2024. CRM follow-ups raised appointment show rates by ~15%, while analytics tightened lead-to-sale cycles and improved ROAS.
- SEO/SEM: 80% digital influence (2024)
- Remote sales: 10–20% of retail (2024)
- CRM: +15% show rates
- Analytics: improved ROAS, shorter sales cycles
80% digital; ~100 dealerships; ~100k sales/yr
Sonic Automotive operates ~100 dealerships (17 states) delivering ~100,000 retail transactions/year; F&I and fixed ops contribute ~30% of dealer gross. Digital influences ~80% of purchases (2024) and remote sales account for 10–20% of retail; eContracting cuts cycle time ~25–30% while pricing/merchandising speed turn and margin.
| Metric | 2024 |
|---|---|
| Dealerships | ~100 |
| Annual retail units | ~100,000 |
| F&I+Fixed ops % gross | ~30% |
| Digital influence | 80% |
| Remote sales | 10–20% |
Delivered as Displayed
Business Model Canvas
This Sonic Automotive Business Model Canvas preview is the actual deliverable, not a mockup, and reflects the full strategic layout used to analyze customers, channels, value propositions, revenues, costs, and partnerships. When you purchase, you’ll receive this same document in editable formats, complete with all sections and ready for presentation or customization. There are no hidden pages or reduced content—what you see is what you get.

Explore a leading auto dealer group's Business Model Canvas: value props, network, revenue
Explore Sonic Automotive’s Business Model Canvas to see how its value propositions, dealer network, and revenue streams align to drive scale and margin. This concise snapshot highlights strategic levers and competitive advantages. Purchase the full canvas for a section-by-section breakdown, editable Word/Excel files, and actionable insights for investors and strategists.
Partnerships
OEM franchise partners
OEM franchise partners secure vehicle supply, training, and brand standards; Sonic Automotive (NYSE: SAH) leverages these ties to support its scale—company revenue was $13.73 billion in 2023—while priority allocations and incentive programs improve margins and inventory mix. Co-op marketing and warranty support boost customer trust and aftersales throughput, and strict OEM KPI compliance sustains franchise value and renewals.
Auto lenders and captive finance
Partnerships with banks and captive finance arms like Ford Credit and Toyota Financial enable Sonic to offer competitive loan and lease options and access OEM subvention programs, including 0% APR offers used to boost affordability.
Faster approvals from integrated lenders raise close rates and deal profitability; U.S. auto loan balances exceeded $1.5 trillion in 2023 (Federal Reserve), underscoring financing scale.
Data integrations streamline F&I workflow and compliance, reducing processing times and shrinkage in paper-based errors.
Insurance and F&I product underwriters
Sonic Automotive (NYSE: SAH) partners with allied underwriters to supply VSCs, GAP, tire-and-wheel and ancillary protection plans that drive F&I revenue and retention.
Shared-risk models and reinsurance structures improve profit per unit while smoothing volatility, aligning with industry moves in 2023–2024 toward captive reinsurance.
Claims support and compliance frameworks reduce chargebacks and protect customer experience, lowering regulatory risk.
Co-developed products are tailored to Sonic’s brand and customer segments to boost take rates and lifetime value.
Parts, tires, and aftermarket suppliers
Reliable parts, tire and aftermarket suppliers keep OEM and aftermarket components in stock, supporting Sonic Automotive’s fixed-ops continuity; the U.S. aftermarket parts market exceeded 300 billion dollars in 2024, underpinning service volume growth. Tiered pricing, volume rebates and preferred-program discounts boost service gross margins, while just-in-time logistics cut bay downtime and inventory carrying costs. Supplier technical support shortens repair cycles and eases warranty claim resolution.
- Reliable OEM availability — supports uptime
- Pricing tiers & rebates — improve margins
- Just-in-time logistics — reduce inventory costs
- Technical support — expedites complex repairs
Auction platforms and remarketers
Auction platforms and remarketers help Sonic Automotive balance aged inventory by channeling vehicles from lots to wholesale and digital marketplaces in 2024, while data-driven bidding tightens acquisition cost control for used vehicles.
- Floorplan rotation: improves cash flow and inventory turns
- Data-driven bidding: lowers acquisition cost
- Condition reports & arbitration: cut reconditioning surprises
Franchise network drives sales: revenue 13.73B, loans > 1.5T, aftermarket > 300B
OEMs, lenders, insurers, suppliers and remarketers form Sonic Automotive’s core partnerships, securing franchise supply, competitive finance offers, F&I products and parts/service continuity that drive sales and fixed-ops margin; company revenue was 13.73 billion in 2023. Integrated lenders and captive finance access tap a US auto loan market >1.5 trillion (2023), while aftermarket suppliers link to a >300 billion US parts market (2024).
| Partnership | Role | 2023/24 Metric |
|---|---|---|
| OEMs | Inventory, brand support | Company revenue 13.73B (2023) |
| Finance partners | Loans, subvention | US auto loans >1.5T (2023) |
| Aftermarket suppliers | Parts, service throughput | US aftermarket >300B (2024) |
What is included in the product
Detailed Word Document
A comprehensive Business Model Canvas for Sonic Automotive detailing nine blocks—customer segments, value propositions, channels, customer relationships, revenue streams, key resources, activities, partners and cost structure—aligning real-world dealership operations, competitive advantages and linked SWOT to support presentations, investor discussions and strategic decision-making.
Customizable Excel Spreadsheet
High-level, editable Business Model Canvas tailored to Sonic Automotive that condenses dealership operations, wholesale/retail channels, and service revenue streams into a single page, saving hours of structuring. Shareable and adaptable for teams to quickly identify pain points, optimize inventory/financing strategies, and align sales and service operations.
Activities
Multi-brand vehicle retailing
Sales operations match customers to new and used vehicles across approximately 100 dealerships in 17 states, leveraging digital inventory and CRM to increase conversion. Trade-in appraisals and dynamic pricing management boost front-end gross, supporting Sonic Automotive’s retail scale of roughly 100,000 vehicle retail transactions annually. Streamlined test drives, desking, and delivery processes shorten time-to-sale, while rigorous compliance and documentation ensure regulatory adherence.
F&I origination and product bundling
F&I origination—credit apps, lender matching and deal structuring—drives backend profit, with F&I and fixed ops typically contributing ~30% of dealership gross profit. Menu selling boosts protection-product attach rates by 10–20% by aligning offers to needs. eContracting can cut deal cycle time by ~25–30% and reduce paperwork errors by ~50%. Ongoing lender relations keep spreads and program terms competitive.
Service, maintenance, and repairs
Fixed ops schedule and execute warranty and customer-pay work across Sonic Automotive's dealer network, prioritizing efficient bay utilization and parts availability to lift hours per RO. Ongoing technician training maintains OEM certification quality and reduces comebacks. Customer amenities and shuttle services boost retention and service-lane capture, strengthening recurring revenue streams.
Inventory sourcing and reconditioning
Procurement via trade-ins, off-lease returns, and wholesale auctions fills inventory gaps and matches local demand through targeted buying, leveraging Sonic Automotive (NYSE: SAH) dealer networks.
Consistent reconditioning standards enable certified and retail-ready quality, reducing time-to-retail and warranty exposure while preserving resale value.
Pricing tools and real-time market data optimize turn and margin; professional photoing and merchandising accelerate online conversion and reduce days-to-sale.
- procurement: trade-ins, off-lease, auctions
- quality: certified reconditioning standards
- pricing: market-data-driven turn and margin
- merchandising: photos + listings speed conversion
Digital marketing and omnichannel sales
Digital marketing—SEO, SEM and listings—drives the majority of high-intent leads, with digital influencing about 80% of auto purchase journeys in 2024 (Google). Online pricing, instant trade valuations and refundable deposits enabled remote transactions accounting for roughly 10–20% of retail sales in 2024. CRM follow-ups raised appointment show rates by ~15%, while analytics tightened lead-to-sale cycles and improved ROAS.
- SEO/SEM: 80% digital influence (2024)
- Remote sales: 10–20% of retail (2024)
- CRM: +15% show rates
- Analytics: improved ROAS, shorter sales cycles
80% digital; ~100 dealerships; ~100k sales/yr
Sonic Automotive operates ~100 dealerships (17 states) delivering ~100,000 retail transactions/year; F&I and fixed ops contribute ~30% of dealer gross. Digital influences ~80% of purchases (2024) and remote sales account for 10–20% of retail; eContracting cuts cycle time ~25–30% while pricing/merchandising speed turn and margin.
| Metric | 2024 |
|---|---|
| Dealerships | ~100 |
| Annual retail units | ~100,000 |
| F&I+Fixed ops % gross | ~30% |
| Digital influence | 80% |
| Remote sales | 10–20% |
Delivered as Displayed
Business Model Canvas
This Sonic Automotive Business Model Canvas preview is the actual deliverable, not a mockup, and reflects the full strategic layout used to analyze customers, channels, value propositions, revenues, costs, and partnerships. When you purchase, you’ll receive this same document in editable formats, complete with all sections and ready for presentation or customization. There are no hidden pages or reduced content—what you see is what you get.
Description
Explore a leading auto dealer group's Business Model Canvas: value props, network, revenue
Explore Sonic Automotive’s Business Model Canvas to see how its value propositions, dealer network, and revenue streams align to drive scale and margin. This concise snapshot highlights strategic levers and competitive advantages. Purchase the full canvas for a section-by-section breakdown, editable Word/Excel files, and actionable insights for investors and strategists.
Partnerships
OEM franchise partners
OEM franchise partners secure vehicle supply, training, and brand standards; Sonic Automotive (NYSE: SAH) leverages these ties to support its scale—company revenue was $13.73 billion in 2023—while priority allocations and incentive programs improve margins and inventory mix. Co-op marketing and warranty support boost customer trust and aftersales throughput, and strict OEM KPI compliance sustains franchise value and renewals.
Auto lenders and captive finance
Partnerships with banks and captive finance arms like Ford Credit and Toyota Financial enable Sonic to offer competitive loan and lease options and access OEM subvention programs, including 0% APR offers used to boost affordability.
Faster approvals from integrated lenders raise close rates and deal profitability; U.S. auto loan balances exceeded $1.5 trillion in 2023 (Federal Reserve), underscoring financing scale.
Data integrations streamline F&I workflow and compliance, reducing processing times and shrinkage in paper-based errors.
Insurance and F&I product underwriters
Sonic Automotive (NYSE: SAH) partners with allied underwriters to supply VSCs, GAP, tire-and-wheel and ancillary protection plans that drive F&I revenue and retention.
Shared-risk models and reinsurance structures improve profit per unit while smoothing volatility, aligning with industry moves in 2023–2024 toward captive reinsurance.
Claims support and compliance frameworks reduce chargebacks and protect customer experience, lowering regulatory risk.
Co-developed products are tailored to Sonic’s brand and customer segments to boost take rates and lifetime value.
Parts, tires, and aftermarket suppliers
Reliable parts, tire and aftermarket suppliers keep OEM and aftermarket components in stock, supporting Sonic Automotive’s fixed-ops continuity; the U.S. aftermarket parts market exceeded 300 billion dollars in 2024, underpinning service volume growth. Tiered pricing, volume rebates and preferred-program discounts boost service gross margins, while just-in-time logistics cut bay downtime and inventory carrying costs. Supplier technical support shortens repair cycles and eases warranty claim resolution.
- Reliable OEM availability — supports uptime
- Pricing tiers & rebates — improve margins
- Just-in-time logistics — reduce inventory costs
- Technical support — expedites complex repairs
Auction platforms and remarketers
Auction platforms and remarketers help Sonic Automotive balance aged inventory by channeling vehicles from lots to wholesale and digital marketplaces in 2024, while data-driven bidding tightens acquisition cost control for used vehicles.
- Floorplan rotation: improves cash flow and inventory turns
- Data-driven bidding: lowers acquisition cost
- Condition reports & arbitration: cut reconditioning surprises
Franchise network drives sales: revenue 13.73B, loans > 1.5T, aftermarket > 300B
OEMs, lenders, insurers, suppliers and remarketers form Sonic Automotive’s core partnerships, securing franchise supply, competitive finance offers, F&I products and parts/service continuity that drive sales and fixed-ops margin; company revenue was 13.73 billion in 2023. Integrated lenders and captive finance access tap a US auto loan market >1.5 trillion (2023), while aftermarket suppliers link to a >300 billion US parts market (2024).
| Partnership | Role | 2023/24 Metric |
|---|---|---|
| OEMs | Inventory, brand support | Company revenue 13.73B (2023) |
| Finance partners | Loans, subvention | US auto loans >1.5T (2023) |
| Aftermarket suppliers | Parts, service throughput | US aftermarket >300B (2024) |
What is included in the product
Detailed Word Document
A comprehensive Business Model Canvas for Sonic Automotive detailing nine blocks—customer segments, value propositions, channels, customer relationships, revenue streams, key resources, activities, partners and cost structure—aligning real-world dealership operations, competitive advantages and linked SWOT to support presentations, investor discussions and strategic decision-making.
Customizable Excel Spreadsheet
High-level, editable Business Model Canvas tailored to Sonic Automotive that condenses dealership operations, wholesale/retail channels, and service revenue streams into a single page, saving hours of structuring. Shareable and adaptable for teams to quickly identify pain points, optimize inventory/financing strategies, and align sales and service operations.
Activities
Multi-brand vehicle retailing
Sales operations match customers to new and used vehicles across approximately 100 dealerships in 17 states, leveraging digital inventory and CRM to increase conversion. Trade-in appraisals and dynamic pricing management boost front-end gross, supporting Sonic Automotive’s retail scale of roughly 100,000 vehicle retail transactions annually. Streamlined test drives, desking, and delivery processes shorten time-to-sale, while rigorous compliance and documentation ensure regulatory adherence.
F&I origination and product bundling
F&I origination—credit apps, lender matching and deal structuring—drives backend profit, with F&I and fixed ops typically contributing ~30% of dealership gross profit. Menu selling boosts protection-product attach rates by 10–20% by aligning offers to needs. eContracting can cut deal cycle time by ~25–30% and reduce paperwork errors by ~50%. Ongoing lender relations keep spreads and program terms competitive.
Service, maintenance, and repairs
Fixed ops schedule and execute warranty and customer-pay work across Sonic Automotive's dealer network, prioritizing efficient bay utilization and parts availability to lift hours per RO. Ongoing technician training maintains OEM certification quality and reduces comebacks. Customer amenities and shuttle services boost retention and service-lane capture, strengthening recurring revenue streams.
Inventory sourcing and reconditioning
Procurement via trade-ins, off-lease returns, and wholesale auctions fills inventory gaps and matches local demand through targeted buying, leveraging Sonic Automotive (NYSE: SAH) dealer networks.
Consistent reconditioning standards enable certified and retail-ready quality, reducing time-to-retail and warranty exposure while preserving resale value.
Pricing tools and real-time market data optimize turn and margin; professional photoing and merchandising accelerate online conversion and reduce days-to-sale.
- procurement: trade-ins, off-lease, auctions
- quality: certified reconditioning standards
- pricing: market-data-driven turn and margin
- merchandising: photos + listings speed conversion
Digital marketing and omnichannel sales
Digital marketing—SEO, SEM and listings—drives the majority of high-intent leads, with digital influencing about 80% of auto purchase journeys in 2024 (Google). Online pricing, instant trade valuations and refundable deposits enabled remote transactions accounting for roughly 10–20% of retail sales in 2024. CRM follow-ups raised appointment show rates by ~15%, while analytics tightened lead-to-sale cycles and improved ROAS.
- SEO/SEM: 80% digital influence (2024)
- Remote sales: 10–20% of retail (2024)
- CRM: +15% show rates
- Analytics: improved ROAS, shorter sales cycles
80% digital; ~100 dealerships; ~100k sales/yr
Sonic Automotive operates ~100 dealerships (17 states) delivering ~100,000 retail transactions/year; F&I and fixed ops contribute ~30% of dealer gross. Digital influences ~80% of purchases (2024) and remote sales account for 10–20% of retail; eContracting cuts cycle time ~25–30% while pricing/merchandising speed turn and margin.
| Metric | 2024 |
|---|---|
| Dealerships | ~100 |
| Annual retail units | ~100,000 |
| F&I+Fixed ops % gross | ~30% |
| Digital influence | 80% |
| Remote sales | 10–20% |
Delivered as Displayed
Business Model Canvas
This Sonic Automotive Business Model Canvas preview is the actual deliverable, not a mockup, and reflects the full strategic layout used to analyze customers, channels, value propositions, revenues, costs, and partnerships. When you purchase, you’ll receive this same document in editable formats, complete with all sections and ready for presentation or customization. There are no hidden pages or reduced content—what you see is what you get.











