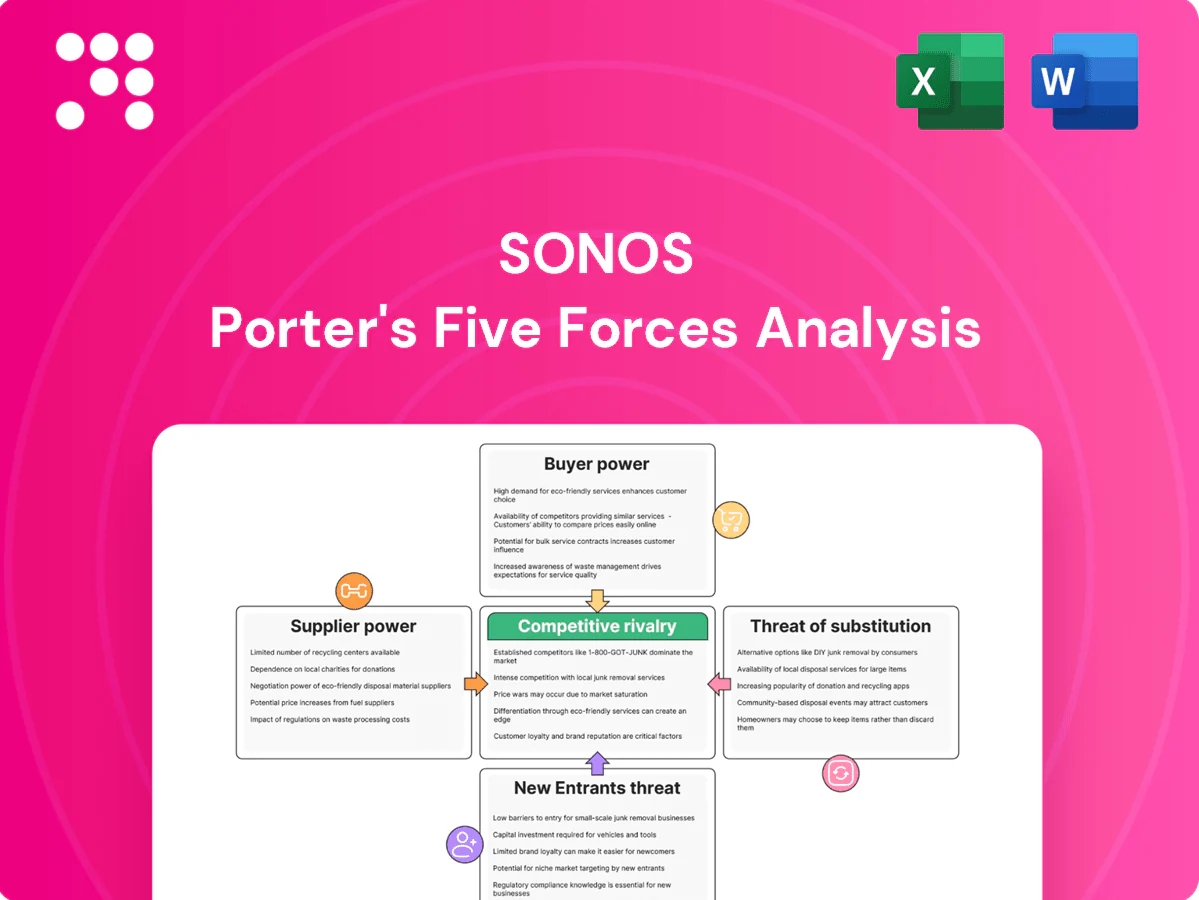
Sonos Porter's Five Forces Analysis

Elevate Your Analysis with the Complete Porter's Five Forces Analysis
Sonos faces intense competitive rivalry from tech giants and low-cost audio rivals, moderate supplier leverage over components, growing buyer power via price comparison, and meaningful substitute threats from smart speakers and integrated ecosystems. Barriers to entry are moderate but scaling and brand matter. This brief snapshot only scratches the surface—unlock the full Porter's Five Forces Analysis to explore Sonos’s competitive dynamics in detail.
Suppliers Bargaining Power

Concentrated chipset and module vendors
Wi‑Fi/Bluetooth chipsets, DSPs and voice‑assistant modules come from a concentrated supplier set (eg Broadcom, Qualcomm, MediaTek), giving vendors leverage over pricing and allocation. Supply constraints or semiconductor node transitions (eg 7nm→5nm) can raise Sonos’ component costs and delay product timelines. Long qualification cycles, commonly 12–24 months, make rapid sourcing shifts difficult and elevate supplier bargaining power.
Licensing for codecs and streaming services
Sonos depends on licensed codecs, DRM and integrations with major streaming platforms, and in fiscal 2024 reported roughly $1.86 billion in revenue, so shifts in licensing or API access can materially affect product features and margins. Suppliers offering must-have services—streaming platforms and codec licensors—hold negotiation leverage over fees and functionality. Compliance and certification requirements further lock Sonos into specific contractual terms and upgrade timelines.

Contract manufacturing and logistics dependence
Sonos relies on EMS/ODM partners for production, making factory capacity and yields critical to meeting demand; Sonos reported fiscal 2023 revenue of $1.63 billion, so supplier disruptions can materially affect top-line delivery.
Shifts in labor costs, freight rates and geopolitics can rapidly raise input costs—global container rates and regional wage shifts in 2022–24 showed volatile swings that tighten margins.
Diversifying plants lowers concentration risk but increases setup time and overhead, so manufacturing partners retain bargaining influence during tight capacity cycles.

Specialized drivers and materials
Specialized acoustic drivers, magnets and high‑tolerance enclosures rely on niche vendors, and quality variations directly affect Sonos brand perception; Sonos reported roughly $1.57B revenue in 2023, so supplier disruptions hit materiality. China accounts for over 60% of rare‑earth processing (2023), and commodity swings (e.g., copper/resin) have increased BOM volatility, giving niche suppliers leverage to press for favorable terms.
- Concentration: rare‑earths >60% China (2023)
- Brand sensitivity: high quality variance risk
- Cost exposure: metal/resin price swings drive BOM volatility
- Supplier leverage: niche capability limits easy swaps
Switching costs and dual‑sourcing limits
Requalifying components alters acoustics, certifications and app tuning, materially raising switching costs for Sonos; many acoustic drivers and tuned DSP modules lack second sources at equivalent performance, and tooling plus firmware dependencies deepen lock‑in, giving suppliers growing leverage over time.
- requalification raises switch costs
- limited true second sources
- tooling & firmware lock‑in
- structural friction increases supplier power
Suppliers hold leverage: concentrated chipsets, >60% China rare‑earths, $1.86B, 12–24mo
Concentrated chipset and niche acoustic suppliers (rare‑earths >60% China, 2023) give suppliers pricing and allocation leverage. Licensing/platform dependencies and $1.86B revenue (FY2024) raise materiality of API/codec risk. EMS/ODM capacity and long requalification (12–24 months) make switching costly and elevate supplier power.
| Metric | Value |
|---|---|
| FY2024 revenue | $1.86B |
| Requalification time | 12–24 months |
| Rare‑earths processing | >60% China (2023) |
What is included in the product
 Detailed Word Document
Analyzes key drivers of competition, buyer and supplier power, threats from substitutes and new entrants, and rivalry intensity specific to Sonos, highlighting disruptive technologies and market dynamics that affect pricing, margins, and market share.

 Customizable Excel Spreadsheet
Concise Porter's Five Forces snapshot for Sonos—clarifies competitive, supplier, and buyer pressures to quickly surface strategic pain points and prioritize responses. Clean, slide-ready layout lets you tweak force intensities and drop straight into pitch decks or strategy reviews.
Customers Bargaining Power

High price transparency
Consumers can compare Sonos with Bose, Sony, Apple and Amazon in seconds, e.g., Sonos One ~199, Apple HomePod mini 99, Amazon Echo 99, Bose Smart Speaker 300 ~379, making price a front-line metric. Deal cycles and review sites (hundreds to thousands of product reviews per model) magnify price sensitivity. When features seem similar buyers push harder for discounts. This transparency elevates buyer bargaining power.
Ecosystem lock‑in moderates switching
Existing Sonos owners face meaningful switching costs from multi‑room setups and app familiarity, with Sonos reporting about 8.9 million active accounts in 2024 that amplify inertia. Accessory compatibility and whole‑home synchronization curb churn by keeping ecosystems stickier. Cross‑platform streaming (AirPlay, Spotify Connect) reduces lock‑in compared with earlier years. Net buyer power is mixed: high for new buyers, lower for entrenched users.

Premium expectations and service demands
Premium buyers demand superior sound, reliability and multi-year support; any lapse often triggers returns or negative reviews that compress pricing power and force tougher warranty terms. In 2024 Sonos reported roughly $1.1B in revenue, underscoring reliance on a premium segment where churn or reputation hits scale quickly. This dynamic raises buyer leverage to insist on consistent performance. Sonos must consistently justify price premiums with proven durability and updates.

Retail and e‑commerce channel leverage
Large retailers and marketplaces (Amazon ~40% of US e‑commerce in 2024) push Sonos for co‑op marketing and promotional pricing; prominent placement and reviews on these channels materially lift conversion rates, while channel partners extract favorable terms during peak seasons, creating indirect buyer power through intermediaries.
- Retail leverage: co‑op and promo demands
- Visibility: placement & reviews drive conversion
- Seasonal negotiation: peak‑period concessions
- Indirect buyer power via intermediaries
Limited enterprise volume
Sonos skews toward consumer households rather than large B2B contracts, with FY2024 revenue about $1.3B reflecting a predominantly retail mix. Fewer volume buyers mean less concentrated buyer power than in enterprise electronics, though hospitality and custom installers can negotiate on bundles and service packages. The fragmented retail base moderates aggregate buyer leverage.
- Retail-focused revenue: FY2024 ~$1.3B
- Low enterprise concentration: limited large-volume buyers
- Negotiation pockets: hospitality/custom installers
High price visibility and retail promos squeeze margins despite 8.9M
Buyers have high price visibility vs competitors, raising bargaining power for new purchasers. Existing Sonos owners (≈8.9M active accounts in 2024) show higher stickiness, lowering churn. Retail channels (Amazon ~40% US e‑commerce) and seasonal promos squeeze margins; FY2024 revenue ≈$1.3B underscores premium reliance.
| Metric | 2024 | Implication |
|---|---|---|
| Active accounts | 8.9M | Higher inertia |
| Revenue | $1.3B | Premium exposure |
| Amazon share | ~40% | Channel leverage |
Preview the Actual Deliverable
Sonos Porter's Five Forces Analysis
This preview shows the exact Sonos Porter’s Five Forces analysis you’ll receive immediately after purchase—no placeholders or samples. The document is fully formatted, comprehensive, and ready to download for strategic use. What you see is precisely what you’ll get.

Elevate Your Analysis with the Complete Porter's Five Forces Analysis
Sonos faces intense competitive rivalry from tech giants and low-cost audio rivals, moderate supplier leverage over components, growing buyer power via price comparison, and meaningful substitute threats from smart speakers and integrated ecosystems. Barriers to entry are moderate but scaling and brand matter. This brief snapshot only scratches the surface—unlock the full Porter's Five Forces Analysis to explore Sonos’s competitive dynamics in detail.
Suppliers Bargaining Power
Concentrated chipset and module vendors
Wi‑Fi/Bluetooth chipsets, DSPs and voice‑assistant modules come from a concentrated supplier set (eg Broadcom, Qualcomm, MediaTek), giving vendors leverage over pricing and allocation. Supply constraints or semiconductor node transitions (eg 7nm→5nm) can raise Sonos’ component costs and delay product timelines. Long qualification cycles, commonly 12–24 months, make rapid sourcing shifts difficult and elevate supplier bargaining power.
Licensing for codecs and streaming services
Sonos depends on licensed codecs, DRM and integrations with major streaming platforms, and in fiscal 2024 reported roughly $1.86 billion in revenue, so shifts in licensing or API access can materially affect product features and margins. Suppliers offering must-have services—streaming platforms and codec licensors—hold negotiation leverage over fees and functionality. Compliance and certification requirements further lock Sonos into specific contractual terms and upgrade timelines.
Contract manufacturing and logistics dependence
Sonos relies on EMS/ODM partners for production, making factory capacity and yields critical to meeting demand; Sonos reported fiscal 2023 revenue of $1.63 billion, so supplier disruptions can materially affect top-line delivery.
Shifts in labor costs, freight rates and geopolitics can rapidly raise input costs—global container rates and regional wage shifts in 2022–24 showed volatile swings that tighten margins.
Diversifying plants lowers concentration risk but increases setup time and overhead, so manufacturing partners retain bargaining influence during tight capacity cycles.
Specialized drivers and materials
Specialized acoustic drivers, magnets and high‑tolerance enclosures rely on niche vendors, and quality variations directly affect Sonos brand perception; Sonos reported roughly $1.57B revenue in 2023, so supplier disruptions hit materiality. China accounts for over 60% of rare‑earth processing (2023), and commodity swings (e.g., copper/resin) have increased BOM volatility, giving niche suppliers leverage to press for favorable terms.
- Concentration: rare‑earths >60% China (2023)
- Brand sensitivity: high quality variance risk
- Cost exposure: metal/resin price swings drive BOM volatility
- Supplier leverage: niche capability limits easy swaps
Switching costs and dual‑sourcing limits
Requalifying components alters acoustics, certifications and app tuning, materially raising switching costs for Sonos; many acoustic drivers and tuned DSP modules lack second sources at equivalent performance, and tooling plus firmware dependencies deepen lock‑in, giving suppliers growing leverage over time.
- requalification raises switch costs
- limited true second sources
- tooling & firmware lock‑in
- structural friction increases supplier power
Suppliers hold leverage: concentrated chipsets, >60% China rare‑earths, $1.86B, 12–24mo
Concentrated chipset and niche acoustic suppliers (rare‑earths >60% China, 2023) give suppliers pricing and allocation leverage. Licensing/platform dependencies and $1.86B revenue (FY2024) raise materiality of API/codec risk. EMS/ODM capacity and long requalification (12–24 months) make switching costly and elevate supplier power.
| Metric | Value |
|---|---|
| FY2024 revenue | $1.86B |
| Requalification time | 12–24 months |
| Rare‑earths processing | >60% China (2023) |
What is included in the product
Detailed Word Document
Analyzes key drivers of competition, buyer and supplier power, threats from substitutes and new entrants, and rivalry intensity specific to Sonos, highlighting disruptive technologies and market dynamics that affect pricing, margins, and market share.
Customizable Excel Spreadsheet
Concise Porter's Five Forces snapshot for Sonos—clarifies competitive, supplier, and buyer pressures to quickly surface strategic pain points and prioritize responses. Clean, slide-ready layout lets you tweak force intensities and drop straight into pitch decks or strategy reviews.
Customers Bargaining Power
High price transparency
Consumers can compare Sonos with Bose, Sony, Apple and Amazon in seconds, e.g., Sonos One ~199, Apple HomePod mini 99, Amazon Echo 99, Bose Smart Speaker 300 ~379, making price a front-line metric. Deal cycles and review sites (hundreds to thousands of product reviews per model) magnify price sensitivity. When features seem similar buyers push harder for discounts. This transparency elevates buyer bargaining power.
Ecosystem lock‑in moderates switching
Existing Sonos owners face meaningful switching costs from multi‑room setups and app familiarity, with Sonos reporting about 8.9 million active accounts in 2024 that amplify inertia. Accessory compatibility and whole‑home synchronization curb churn by keeping ecosystems stickier. Cross‑platform streaming (AirPlay, Spotify Connect) reduces lock‑in compared with earlier years. Net buyer power is mixed: high for new buyers, lower for entrenched users.
Premium expectations and service demands
Premium buyers demand superior sound, reliability and multi-year support; any lapse often triggers returns or negative reviews that compress pricing power and force tougher warranty terms. In 2024 Sonos reported roughly $1.1B in revenue, underscoring reliance on a premium segment where churn or reputation hits scale quickly. This dynamic raises buyer leverage to insist on consistent performance. Sonos must consistently justify price premiums with proven durability and updates.
Retail and e‑commerce channel leverage
Large retailers and marketplaces (Amazon ~40% of US e‑commerce in 2024) push Sonos for co‑op marketing and promotional pricing; prominent placement and reviews on these channels materially lift conversion rates, while channel partners extract favorable terms during peak seasons, creating indirect buyer power through intermediaries.
- Retail leverage: co‑op and promo demands
- Visibility: placement & reviews drive conversion
- Seasonal negotiation: peak‑period concessions
- Indirect buyer power via intermediaries
Limited enterprise volume
Sonos skews toward consumer households rather than large B2B contracts, with FY2024 revenue about $1.3B reflecting a predominantly retail mix. Fewer volume buyers mean less concentrated buyer power than in enterprise electronics, though hospitality and custom installers can negotiate on bundles and service packages. The fragmented retail base moderates aggregate buyer leverage.
- Retail-focused revenue: FY2024 ~$1.3B
- Low enterprise concentration: limited large-volume buyers
- Negotiation pockets: hospitality/custom installers
High price visibility and retail promos squeeze margins despite 8.9M
Buyers have high price visibility vs competitors, raising bargaining power for new purchasers. Existing Sonos owners (≈8.9M active accounts in 2024) show higher stickiness, lowering churn. Retail channels (Amazon ~40% US e‑commerce) and seasonal promos squeeze margins; FY2024 revenue ≈$1.3B underscores premium reliance.
| Metric | 2024 | Implication |
|---|---|---|
| Active accounts | 8.9M | Higher inertia |
| Revenue | $1.3B | Premium exposure |
| Amazon share | ~40% | Channel leverage |
Preview the Actual Deliverable
Sonos Porter's Five Forces Analysis
This preview shows the exact Sonos Porter’s Five Forces analysis you’ll receive immediately after purchase—no placeholders or samples. The document is fully formatted, comprehensive, and ready to download for strategic use. What you see is precisely what you’ll get.
Description
Elevate Your Analysis with the Complete Porter's Five Forces Analysis
Sonos faces intense competitive rivalry from tech giants and low-cost audio rivals, moderate supplier leverage over components, growing buyer power via price comparison, and meaningful substitute threats from smart speakers and integrated ecosystems. Barriers to entry are moderate but scaling and brand matter. This brief snapshot only scratches the surface—unlock the full Porter's Five Forces Analysis to explore Sonos’s competitive dynamics in detail.
Suppliers Bargaining Power
Concentrated chipset and module vendors
Wi‑Fi/Bluetooth chipsets, DSPs and voice‑assistant modules come from a concentrated supplier set (eg Broadcom, Qualcomm, MediaTek), giving vendors leverage over pricing and allocation. Supply constraints or semiconductor node transitions (eg 7nm→5nm) can raise Sonos’ component costs and delay product timelines. Long qualification cycles, commonly 12–24 months, make rapid sourcing shifts difficult and elevate supplier bargaining power.
Licensing for codecs and streaming services
Sonos depends on licensed codecs, DRM and integrations with major streaming platforms, and in fiscal 2024 reported roughly $1.86 billion in revenue, so shifts in licensing or API access can materially affect product features and margins. Suppliers offering must-have services—streaming platforms and codec licensors—hold negotiation leverage over fees and functionality. Compliance and certification requirements further lock Sonos into specific contractual terms and upgrade timelines.
Contract manufacturing and logistics dependence
Sonos relies on EMS/ODM partners for production, making factory capacity and yields critical to meeting demand; Sonos reported fiscal 2023 revenue of $1.63 billion, so supplier disruptions can materially affect top-line delivery.
Shifts in labor costs, freight rates and geopolitics can rapidly raise input costs—global container rates and regional wage shifts in 2022–24 showed volatile swings that tighten margins.
Diversifying plants lowers concentration risk but increases setup time and overhead, so manufacturing partners retain bargaining influence during tight capacity cycles.
Specialized drivers and materials
Specialized acoustic drivers, magnets and high‑tolerance enclosures rely on niche vendors, and quality variations directly affect Sonos brand perception; Sonos reported roughly $1.57B revenue in 2023, so supplier disruptions hit materiality. China accounts for over 60% of rare‑earth processing (2023), and commodity swings (e.g., copper/resin) have increased BOM volatility, giving niche suppliers leverage to press for favorable terms.
- Concentration: rare‑earths >60% China (2023)
- Brand sensitivity: high quality variance risk
- Cost exposure: metal/resin price swings drive BOM volatility
- Supplier leverage: niche capability limits easy swaps
Switching costs and dual‑sourcing limits
Requalifying components alters acoustics, certifications and app tuning, materially raising switching costs for Sonos; many acoustic drivers and tuned DSP modules lack second sources at equivalent performance, and tooling plus firmware dependencies deepen lock‑in, giving suppliers growing leverage over time.
- requalification raises switch costs
- limited true second sources
- tooling & firmware lock‑in
- structural friction increases supplier power
Suppliers hold leverage: concentrated chipsets, >60% China rare‑earths, $1.86B, 12–24mo
Concentrated chipset and niche acoustic suppliers (rare‑earths >60% China, 2023) give suppliers pricing and allocation leverage. Licensing/platform dependencies and $1.86B revenue (FY2024) raise materiality of API/codec risk. EMS/ODM capacity and long requalification (12–24 months) make switching costly and elevate supplier power.
| Metric | Value |
|---|---|
| FY2024 revenue | $1.86B |
| Requalification time | 12–24 months |
| Rare‑earths processing | >60% China (2023) |
What is included in the product
Detailed Word Document
Analyzes key drivers of competition, buyer and supplier power, threats from substitutes and new entrants, and rivalry intensity specific to Sonos, highlighting disruptive technologies and market dynamics that affect pricing, margins, and market share.
Customizable Excel Spreadsheet
Concise Porter's Five Forces snapshot for Sonos—clarifies competitive, supplier, and buyer pressures to quickly surface strategic pain points and prioritize responses. Clean, slide-ready layout lets you tweak force intensities and drop straight into pitch decks or strategy reviews.
Customers Bargaining Power
High price transparency
Consumers can compare Sonos with Bose, Sony, Apple and Amazon in seconds, e.g., Sonos One ~199, Apple HomePod mini 99, Amazon Echo 99, Bose Smart Speaker 300 ~379, making price a front-line metric. Deal cycles and review sites (hundreds to thousands of product reviews per model) magnify price sensitivity. When features seem similar buyers push harder for discounts. This transparency elevates buyer bargaining power.
Ecosystem lock‑in moderates switching
Existing Sonos owners face meaningful switching costs from multi‑room setups and app familiarity, with Sonos reporting about 8.9 million active accounts in 2024 that amplify inertia. Accessory compatibility and whole‑home synchronization curb churn by keeping ecosystems stickier. Cross‑platform streaming (AirPlay, Spotify Connect) reduces lock‑in compared with earlier years. Net buyer power is mixed: high for new buyers, lower for entrenched users.
Premium expectations and service demands
Premium buyers demand superior sound, reliability and multi-year support; any lapse often triggers returns or negative reviews that compress pricing power and force tougher warranty terms. In 2024 Sonos reported roughly $1.1B in revenue, underscoring reliance on a premium segment where churn or reputation hits scale quickly. This dynamic raises buyer leverage to insist on consistent performance. Sonos must consistently justify price premiums with proven durability and updates.
Retail and e‑commerce channel leverage
Large retailers and marketplaces (Amazon ~40% of US e‑commerce in 2024) push Sonos for co‑op marketing and promotional pricing; prominent placement and reviews on these channels materially lift conversion rates, while channel partners extract favorable terms during peak seasons, creating indirect buyer power through intermediaries.
- Retail leverage: co‑op and promo demands
- Visibility: placement & reviews drive conversion
- Seasonal negotiation: peak‑period concessions
- Indirect buyer power via intermediaries
Limited enterprise volume
Sonos skews toward consumer households rather than large B2B contracts, with FY2024 revenue about $1.3B reflecting a predominantly retail mix. Fewer volume buyers mean less concentrated buyer power than in enterprise electronics, though hospitality and custom installers can negotiate on bundles and service packages. The fragmented retail base moderates aggregate buyer leverage.
- Retail-focused revenue: FY2024 ~$1.3B
- Low enterprise concentration: limited large-volume buyers
- Negotiation pockets: hospitality/custom installers
High price visibility and retail promos squeeze margins despite 8.9M
Buyers have high price visibility vs competitors, raising bargaining power for new purchasers. Existing Sonos owners (≈8.9M active accounts in 2024) show higher stickiness, lowering churn. Retail channels (Amazon ~40% US e‑commerce) and seasonal promos squeeze margins; FY2024 revenue ≈$1.3B underscores premium reliance.
| Metric | 2024 | Implication |
|---|---|---|
| Active accounts | 8.9M | Higher inertia |
| Revenue | $1.3B | Premium exposure |
| Amazon share | ~40% | Channel leverage |
Preview the Actual Deliverable
Sonos Porter's Five Forces Analysis
This preview shows the exact Sonos Porter’s Five Forces analysis you’ll receive immediately after purchase—no placeholders or samples. The document is fully formatted, comprehensive, and ready to download for strategic use. What you see is precisely what you’ll get.











