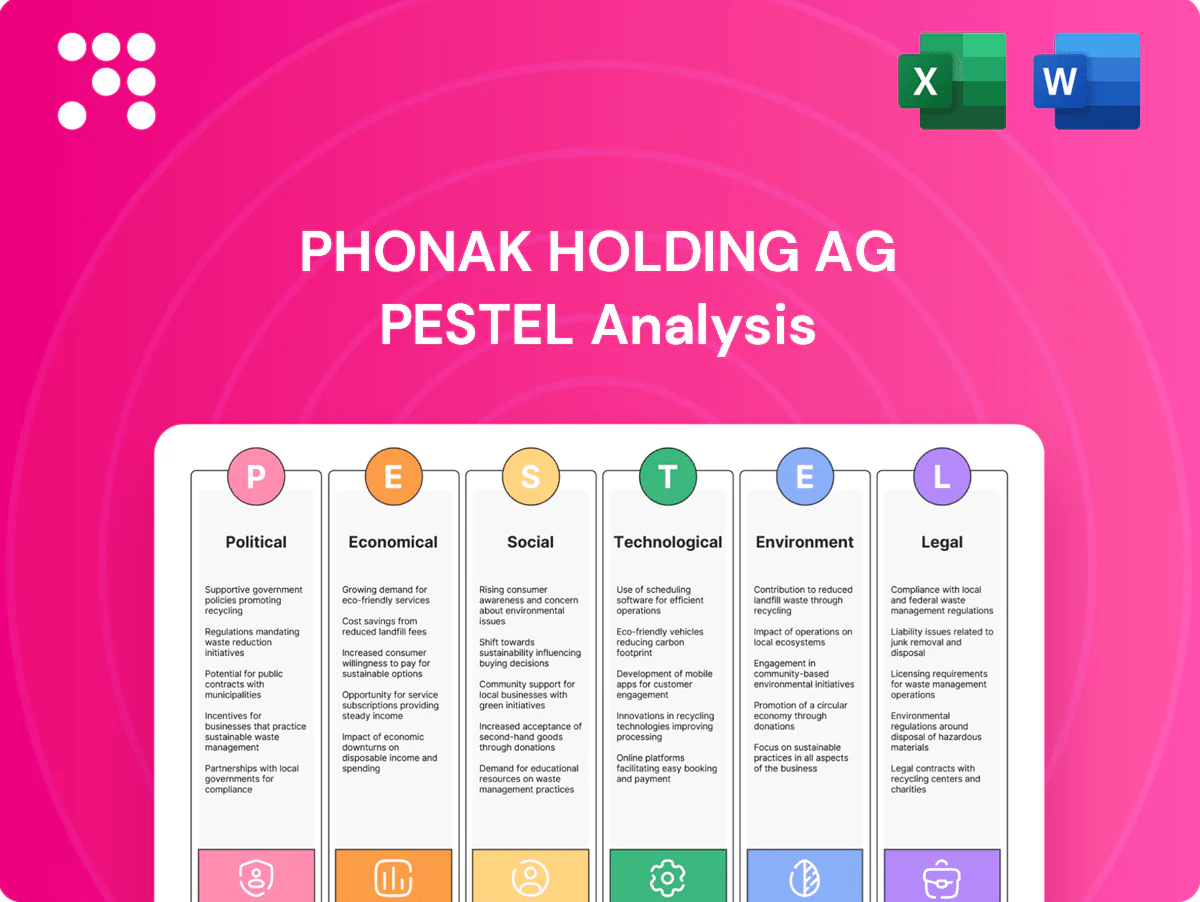
Phonak Holding AG PESTLE Analysis

Plan Smarter. Present Sharper. Compete Stronger.
Unlock strategic advantage with our targeted PESTLE Analysis of Phonak Holding AG—three to five expert insights into how political, economic, social, technological, legal, and environmental forces will shape its prospects. Use this concise overview to inform investment theses and strategic plans. Purchase the full analysis now for the complete data-driven breakdown and ready-to-use recommendations.
Political factors

Healthcare reimbursement and public funding
Government reimbursement and public insurance shape affordability and uptake of hearing aids/implants, with WHO estimating 430 million people with disabling hearing loss; global hearing-aid market ~USD 8.5bn (2023). Policy shifts in EU, persistent lack of broad Medicare coverage in the US, and Japan's ageing population can expand or constrain demand. Sonova/Phonak must align pricing and generate health-economic evidence to match payer priorities; advocacy and outcomes data are critical to sustain funding.
Trade policy, tariffs, and geopolitics
Global supply chains for components such as semiconductors and MEMS microphones face tariff and export-control risks after US expanded semiconductor export controls in 2023 and the CHIPS Act ($52 billion) reshaped incentives. Geopolitical tensions raise logistics costs and lead times; diversified sourcing and regional manufacturing reduce exposure. Proactive inventory and trade-compliance management help preserve clinic service levels.

Public health priorities and aging policies
National agendas on healthy aging and productivity shape screening and intervention demand as WHO estimates 430 million people had disabling hearing loss in 2021 and projects 1.5 billion by 2050; UN projects one in six people will be 60 or older by 2030, expanding target cohorts. Government-backed school and eldercare screening programs and public health partnerships (e.g., NHS hearing services) expand funnels, while budget cycles and election outcomes can interrupt program continuity.

Regulatory harmonization and standards setting
Participation in standards bodies shapes interoperability for Bluetooth LE Audio and Auracast (multicast launched 2023) and influences assistive-tech procurement mandates.
Regulatory alignment cuts fragmentation and certification burdens, while divergent national rules extend time-to-market; EU Accessibility Act enforcement from June 2025 raises compliance urgency.
Early compliance yields first-mover edge in public tenders for Phonak/Sonova-scale suppliers.
Government incentives for R&D and manufacturing
Government R&D tax credits (commonly covering ~10–25% of qualifying costs) and grants in 2024 materially support acoustic algorithm development, AI fitting tools and low‑power chip design; targeted local manufacturing incentives justify regional assembly hubs and reduce landed cost. Policymaker backing for medtech clusters strengthens talent pipelines; ongoing policy monitoring lets Phonak optimize footprint and capex.
- R&D credits: 10–25%
- Grants: bolster AI/fitting and chip R&D
- Local incentives: enable regional assembly
- Cluster support: talent pipeline
- Policy watch: optimizes footprint & capex
Affordability pressures and new EU/CHIPS rules reshape the USD 8.5bn hearing-aid market
Reimbursement policies and limited US Medicare coverage constrain affordability despite a ~USD 8.5bn global hearing‑aid market (2023) and WHO 430m with disabling hearing loss (2021), rising to 1.5bn by 2050. EU Accessibility Act effective June 2025 and Auracast (2023) push compliance costs and procurement opportunities. CHIPS Act $52bn and 10–25% R&D tax credits reshape sourcing and innovation incentives.
| Item | Value/Year |
|---|---|
| Global market | USD 8.5bn (2023) |
| Disabling hearing loss | 430m (2021); 1.5bn by 2050 |
| EU Act | Effective Jun 2025 |
| CHIPS Act | USD 52bn (2022–) |
| R&D credits | 10–25% |
What is included in the product
 Detailed Word Document
Explores how Political, Economic, Social, Technological, Environmental and Legal forces uniquely impact Phonak Holding AG, with data-driven trends, region- and industry-specific examples, forward-looking scenarios and actionable insights to help executives, investors and strategists identify risks and opportunities.

 Customizable Excel Spreadsheet
A concise, visually segmented PESTLE summary of Phonak Holding AG that clarifies external risks and market drivers for quick alignment in meetings or presentations; editable notes enable region- or business-line specific context and easy drop-in to slides or strategy packs.
Economic factors

Macroeconomic cycles and consumer spending
Discretionary upgrades and private-pay segments are highly sensitive to macro downturns, driving patients toward lower-cost options and delaying premium purchases; WHO estimates over 430 million people have disabling hearing loss (2021), underpinning long-term demand.
Persisting inflation in 2024 compressed clinic traffic and shifted purchases to entry tiers, while value-based bundles and point-of-sale financing have proven effective at maintaining unit volumes.
Active mix management—promoting mid-tier models and service bundles—helps preserve margins when premium demand softens; industry forecasts (2024) project mid-single-digit CAGR for hearing aid revenues, supporting volume-focused strategies.
Payer mix and reimbursement rates
Revenue for Phonak hinges on the balance of private pay, third-party payers and public programs, with shifts in payer mix materially affecting top-line and channel volume.
Reimbursement cuts compress average selling prices and redirect volume into tightly contracted channels, pressuring margins.
Robust evidence of clinical outcomes and total-cost-of-care reductions supports negotiation for favorable rates, while disciplined contracting and SKU architecture preserve profitability.

Currency volatility and global footprint
Multi-currency exposure (CHF, USD, EUR, JPY, CNY) materially affects reported results, as FX swings feed through component costs and pricing competitiveness across markets. Active hedging programs and natural offsets from geographically balanced sales reduce earnings volatility. Local pricing strategies in 2024 were employed to protect market share while preserving brand equity.

Input costs and component supply
Rising costs for silicon, button-cell batteries and specialty plastics materially pressure Phonak's COGS, with manufacturers reporting material cost inflation through 2024 that trimmed industry gross margins. Tight semiconductor supply (lead times often >20 weeks in 2024) forces higher buffer inventory and extended sourcing cycles. Strategic supplier partnerships and dual-sourcing have reduced disruption risk. Design-to-cost and platform reuse helped preserve margins by enabling component standardization.
- Silicon, batteries, plastics → higher COGS, margin pressure
- Semiconductor lead times >20 weeks (2024) → buffer inventory
- Dual-sourcing & supplier partnerships → continuity
- Design-to-cost/platform reuse → sustained gross margins
Clinic network productivity and utilization
Sonova’s Phonak-led retail and audiological services—with Sonova operating over 5,000 points of care worldwide in 2024—drive recurring fittings and revenue; throughput, clinician capacity and typical outpatient no-show rates (~20%) materially affect per-clinic economics. Digital scheduling, remote follow-ups and omni-channel lead capture have been shown to raise utilization and reduce no-shows, while cross-selling accessories can boost average ticket by roughly 15–20%.
- Retail footprint: >5,000 points of care (2024)
- No-show impact: ~20% baseline
- Cross-sell uplift: ~15–20% avg. ticket
- Efficiency levers: digital scheduling, remote follow-ups, omni-channel leads
Affordability pressures and new EU/CHIPS rules reshape the USD 8.5bn hearing-aid market
Demand is backed by 430 million with disabling hearing loss (WHO 2021), yet premium upgrades fall in downturns. Sonova/Phonak operate >5,000 points of care (2024); no-show ~20% hits throughput. COGS rose in 2024 from silicon, batteries, plastics; semiconductor lead times >20 weeks. FX (CHF, USD, EUR, JPY, CNY) and payer mix materially affect revenue.
| Metric | 2024 |
|---|---|
| Addressable with disabling loss | 430M (WHO 2021) |
| Retail points | >5,000 |
| No-show rate | ~20% |
| Semiconductor lead time | >20 weeks |
Same Document Delivered
Phonak Holding AG PESTLE Analysis
The Phonak Holding AG PESTLE analysis examines political, economic, social, technological, legal and environmental factors affecting the company and market; the preview shown here is the exact document you’ll receive—fully formatted, final and ready to use. No placeholders, delivered exactly as displayed.

Plan Smarter. Present Sharper. Compete Stronger.
Unlock strategic advantage with our targeted PESTLE Analysis of Phonak Holding AG—three to five expert insights into how political, economic, social, technological, legal, and environmental forces will shape its prospects. Use this concise overview to inform investment theses and strategic plans. Purchase the full analysis now for the complete data-driven breakdown and ready-to-use recommendations.
Political factors
Healthcare reimbursement and public funding
Government reimbursement and public insurance shape affordability and uptake of hearing aids/implants, with WHO estimating 430 million people with disabling hearing loss; global hearing-aid market ~USD 8.5bn (2023). Policy shifts in EU, persistent lack of broad Medicare coverage in the US, and Japan's ageing population can expand or constrain demand. Sonova/Phonak must align pricing and generate health-economic evidence to match payer priorities; advocacy and outcomes data are critical to sustain funding.
Trade policy, tariffs, and geopolitics
Global supply chains for components such as semiconductors and MEMS microphones face tariff and export-control risks after US expanded semiconductor export controls in 2023 and the CHIPS Act ($52 billion) reshaped incentives. Geopolitical tensions raise logistics costs and lead times; diversified sourcing and regional manufacturing reduce exposure. Proactive inventory and trade-compliance management help preserve clinic service levels.
Public health priorities and aging policies
National agendas on healthy aging and productivity shape screening and intervention demand as WHO estimates 430 million people had disabling hearing loss in 2021 and projects 1.5 billion by 2050; UN projects one in six people will be 60 or older by 2030, expanding target cohorts. Government-backed school and eldercare screening programs and public health partnerships (e.g., NHS hearing services) expand funnels, while budget cycles and election outcomes can interrupt program continuity.
Regulatory harmonization and standards setting
Participation in standards bodies shapes interoperability for Bluetooth LE Audio and Auracast (multicast launched 2023) and influences assistive-tech procurement mandates.
Regulatory alignment cuts fragmentation and certification burdens, while divergent national rules extend time-to-market; EU Accessibility Act enforcement from June 2025 raises compliance urgency.
Early compliance yields first-mover edge in public tenders for Phonak/Sonova-scale suppliers.
Government incentives for R&D and manufacturing
Government R&D tax credits (commonly covering ~10–25% of qualifying costs) and grants in 2024 materially support acoustic algorithm development, AI fitting tools and low‑power chip design; targeted local manufacturing incentives justify regional assembly hubs and reduce landed cost. Policymaker backing for medtech clusters strengthens talent pipelines; ongoing policy monitoring lets Phonak optimize footprint and capex.
- R&D credits: 10–25%
- Grants: bolster AI/fitting and chip R&D
- Local incentives: enable regional assembly
- Cluster support: talent pipeline
- Policy watch: optimizes footprint & capex
Affordability pressures and new EU/CHIPS rules reshape the USD 8.5bn hearing-aid market
Reimbursement policies and limited US Medicare coverage constrain affordability despite a ~USD 8.5bn global hearing‑aid market (2023) and WHO 430m with disabling hearing loss (2021), rising to 1.5bn by 2050. EU Accessibility Act effective June 2025 and Auracast (2023) push compliance costs and procurement opportunities. CHIPS Act $52bn and 10–25% R&D tax credits reshape sourcing and innovation incentives.
| Item | Value/Year |
|---|---|
| Global market | USD 8.5bn (2023) |
| Disabling hearing loss | 430m (2021); 1.5bn by 2050 |
| EU Act | Effective Jun 2025 |
| CHIPS Act | USD 52bn (2022–) |
| R&D credits | 10–25% |
What is included in the product
Detailed Word Document
Explores how Political, Economic, Social, Technological, Environmental and Legal forces uniquely impact Phonak Holding AG, with data-driven trends, region- and industry-specific examples, forward-looking scenarios and actionable insights to help executives, investors and strategists identify risks and opportunities.
Customizable Excel Spreadsheet
A concise, visually segmented PESTLE summary of Phonak Holding AG that clarifies external risks and market drivers for quick alignment in meetings or presentations; editable notes enable region- or business-line specific context and easy drop-in to slides or strategy packs.
Economic factors
Macroeconomic cycles and consumer spending
Discretionary upgrades and private-pay segments are highly sensitive to macro downturns, driving patients toward lower-cost options and delaying premium purchases; WHO estimates over 430 million people have disabling hearing loss (2021), underpinning long-term demand.
Persisting inflation in 2024 compressed clinic traffic and shifted purchases to entry tiers, while value-based bundles and point-of-sale financing have proven effective at maintaining unit volumes.
Active mix management—promoting mid-tier models and service bundles—helps preserve margins when premium demand softens; industry forecasts (2024) project mid-single-digit CAGR for hearing aid revenues, supporting volume-focused strategies.
Payer mix and reimbursement rates
Revenue for Phonak hinges on the balance of private pay, third-party payers and public programs, with shifts in payer mix materially affecting top-line and channel volume.
Reimbursement cuts compress average selling prices and redirect volume into tightly contracted channels, pressuring margins.
Robust evidence of clinical outcomes and total-cost-of-care reductions supports negotiation for favorable rates, while disciplined contracting and SKU architecture preserve profitability.
Currency volatility and global footprint
Multi-currency exposure (CHF, USD, EUR, JPY, CNY) materially affects reported results, as FX swings feed through component costs and pricing competitiveness across markets. Active hedging programs and natural offsets from geographically balanced sales reduce earnings volatility. Local pricing strategies in 2024 were employed to protect market share while preserving brand equity.
Input costs and component supply
Rising costs for silicon, button-cell batteries and specialty plastics materially pressure Phonak's COGS, with manufacturers reporting material cost inflation through 2024 that trimmed industry gross margins. Tight semiconductor supply (lead times often >20 weeks in 2024) forces higher buffer inventory and extended sourcing cycles. Strategic supplier partnerships and dual-sourcing have reduced disruption risk. Design-to-cost and platform reuse helped preserve margins by enabling component standardization.
- Silicon, batteries, plastics → higher COGS, margin pressure
- Semiconductor lead times >20 weeks (2024) → buffer inventory
- Dual-sourcing & supplier partnerships → continuity
- Design-to-cost/platform reuse → sustained gross margins
Clinic network productivity and utilization
Sonova’s Phonak-led retail and audiological services—with Sonova operating over 5,000 points of care worldwide in 2024—drive recurring fittings and revenue; throughput, clinician capacity and typical outpatient no-show rates (~20%) materially affect per-clinic economics. Digital scheduling, remote follow-ups and omni-channel lead capture have been shown to raise utilization and reduce no-shows, while cross-selling accessories can boost average ticket by roughly 15–20%.
- Retail footprint: >5,000 points of care (2024)
- No-show impact: ~20% baseline
- Cross-sell uplift: ~15–20% avg. ticket
- Efficiency levers: digital scheduling, remote follow-ups, omni-channel leads
Affordability pressures and new EU/CHIPS rules reshape the USD 8.5bn hearing-aid market
Demand is backed by 430 million with disabling hearing loss (WHO 2021), yet premium upgrades fall in downturns. Sonova/Phonak operate >5,000 points of care (2024); no-show ~20% hits throughput. COGS rose in 2024 from silicon, batteries, plastics; semiconductor lead times >20 weeks. FX (CHF, USD, EUR, JPY, CNY) and payer mix materially affect revenue.
| Metric | 2024 |
|---|---|
| Addressable with disabling loss | 430M (WHO 2021) |
| Retail points | >5,000 |
| No-show rate | ~20% |
| Semiconductor lead time | >20 weeks |
Same Document Delivered
Phonak Holding AG PESTLE Analysis
The Phonak Holding AG PESTLE analysis examines political, economic, social, technological, legal and environmental factors affecting the company and market; the preview shown here is the exact document you’ll receive—fully formatted, final and ready to use. No placeholders, delivered exactly as displayed.
Original: $10.00
-65%$10.00
$3.50Description
Plan Smarter. Present Sharper. Compete Stronger.
Unlock strategic advantage with our targeted PESTLE Analysis of Phonak Holding AG—three to five expert insights into how political, economic, social, technological, legal, and environmental forces will shape its prospects. Use this concise overview to inform investment theses and strategic plans. Purchase the full analysis now for the complete data-driven breakdown and ready-to-use recommendations.
Political factors
Healthcare reimbursement and public funding
Government reimbursement and public insurance shape affordability and uptake of hearing aids/implants, with WHO estimating 430 million people with disabling hearing loss; global hearing-aid market ~USD 8.5bn (2023). Policy shifts in EU, persistent lack of broad Medicare coverage in the US, and Japan's ageing population can expand or constrain demand. Sonova/Phonak must align pricing and generate health-economic evidence to match payer priorities; advocacy and outcomes data are critical to sustain funding.
Trade policy, tariffs, and geopolitics
Global supply chains for components such as semiconductors and MEMS microphones face tariff and export-control risks after US expanded semiconductor export controls in 2023 and the CHIPS Act ($52 billion) reshaped incentives. Geopolitical tensions raise logistics costs and lead times; diversified sourcing and regional manufacturing reduce exposure. Proactive inventory and trade-compliance management help preserve clinic service levels.
Public health priorities and aging policies
National agendas on healthy aging and productivity shape screening and intervention demand as WHO estimates 430 million people had disabling hearing loss in 2021 and projects 1.5 billion by 2050; UN projects one in six people will be 60 or older by 2030, expanding target cohorts. Government-backed school and eldercare screening programs and public health partnerships (e.g., NHS hearing services) expand funnels, while budget cycles and election outcomes can interrupt program continuity.
Regulatory harmonization and standards setting
Participation in standards bodies shapes interoperability for Bluetooth LE Audio and Auracast (multicast launched 2023) and influences assistive-tech procurement mandates.
Regulatory alignment cuts fragmentation and certification burdens, while divergent national rules extend time-to-market; EU Accessibility Act enforcement from June 2025 raises compliance urgency.
Early compliance yields first-mover edge in public tenders for Phonak/Sonova-scale suppliers.
Government incentives for R&D and manufacturing
Government R&D tax credits (commonly covering ~10–25% of qualifying costs) and grants in 2024 materially support acoustic algorithm development, AI fitting tools and low‑power chip design; targeted local manufacturing incentives justify regional assembly hubs and reduce landed cost. Policymaker backing for medtech clusters strengthens talent pipelines; ongoing policy monitoring lets Phonak optimize footprint and capex.
- R&D credits: 10–25%
- Grants: bolster AI/fitting and chip R&D
- Local incentives: enable regional assembly
- Cluster support: talent pipeline
- Policy watch: optimizes footprint & capex
Affordability pressures and new EU/CHIPS rules reshape the USD 8.5bn hearing-aid market
Reimbursement policies and limited US Medicare coverage constrain affordability despite a ~USD 8.5bn global hearing‑aid market (2023) and WHO 430m with disabling hearing loss (2021), rising to 1.5bn by 2050. EU Accessibility Act effective June 2025 and Auracast (2023) push compliance costs and procurement opportunities. CHIPS Act $52bn and 10–25% R&D tax credits reshape sourcing and innovation incentives.
| Item | Value/Year |
|---|---|
| Global market | USD 8.5bn (2023) |
| Disabling hearing loss | 430m (2021); 1.5bn by 2050 |
| EU Act | Effective Jun 2025 |
| CHIPS Act | USD 52bn (2022–) |
| R&D credits | 10–25% |
What is included in the product
Detailed Word Document
Explores how Political, Economic, Social, Technological, Environmental and Legal forces uniquely impact Phonak Holding AG, with data-driven trends, region- and industry-specific examples, forward-looking scenarios and actionable insights to help executives, investors and strategists identify risks and opportunities.
Customizable Excel Spreadsheet
A concise, visually segmented PESTLE summary of Phonak Holding AG that clarifies external risks and market drivers for quick alignment in meetings or presentations; editable notes enable region- or business-line specific context and easy drop-in to slides or strategy packs.
Economic factors
Macroeconomic cycles and consumer spending
Discretionary upgrades and private-pay segments are highly sensitive to macro downturns, driving patients toward lower-cost options and delaying premium purchases; WHO estimates over 430 million people have disabling hearing loss (2021), underpinning long-term demand.
Persisting inflation in 2024 compressed clinic traffic and shifted purchases to entry tiers, while value-based bundles and point-of-sale financing have proven effective at maintaining unit volumes.
Active mix management—promoting mid-tier models and service bundles—helps preserve margins when premium demand softens; industry forecasts (2024) project mid-single-digit CAGR for hearing aid revenues, supporting volume-focused strategies.
Payer mix and reimbursement rates
Revenue for Phonak hinges on the balance of private pay, third-party payers and public programs, with shifts in payer mix materially affecting top-line and channel volume.
Reimbursement cuts compress average selling prices and redirect volume into tightly contracted channels, pressuring margins.
Robust evidence of clinical outcomes and total-cost-of-care reductions supports negotiation for favorable rates, while disciplined contracting and SKU architecture preserve profitability.
Currency volatility and global footprint
Multi-currency exposure (CHF, USD, EUR, JPY, CNY) materially affects reported results, as FX swings feed through component costs and pricing competitiveness across markets. Active hedging programs and natural offsets from geographically balanced sales reduce earnings volatility. Local pricing strategies in 2024 were employed to protect market share while preserving brand equity.
Input costs and component supply
Rising costs for silicon, button-cell batteries and specialty plastics materially pressure Phonak's COGS, with manufacturers reporting material cost inflation through 2024 that trimmed industry gross margins. Tight semiconductor supply (lead times often >20 weeks in 2024) forces higher buffer inventory and extended sourcing cycles. Strategic supplier partnerships and dual-sourcing have reduced disruption risk. Design-to-cost and platform reuse helped preserve margins by enabling component standardization.
- Silicon, batteries, plastics → higher COGS, margin pressure
- Semiconductor lead times >20 weeks (2024) → buffer inventory
- Dual-sourcing & supplier partnerships → continuity
- Design-to-cost/platform reuse → sustained gross margins
Clinic network productivity and utilization
Sonova’s Phonak-led retail and audiological services—with Sonova operating over 5,000 points of care worldwide in 2024—drive recurring fittings and revenue; throughput, clinician capacity and typical outpatient no-show rates (~20%) materially affect per-clinic economics. Digital scheduling, remote follow-ups and omni-channel lead capture have been shown to raise utilization and reduce no-shows, while cross-selling accessories can boost average ticket by roughly 15–20%.
- Retail footprint: >5,000 points of care (2024)
- No-show impact: ~20% baseline
- Cross-sell uplift: ~15–20% avg. ticket
- Efficiency levers: digital scheduling, remote follow-ups, omni-channel leads
Affordability pressures and new EU/CHIPS rules reshape the USD 8.5bn hearing-aid market
Demand is backed by 430 million with disabling hearing loss (WHO 2021), yet premium upgrades fall in downturns. Sonova/Phonak operate >5,000 points of care (2024); no-show ~20% hits throughput. COGS rose in 2024 from silicon, batteries, plastics; semiconductor lead times >20 weeks. FX (CHF, USD, EUR, JPY, CNY) and payer mix materially affect revenue.
| Metric | 2024 |
|---|---|
| Addressable with disabling loss | 430M (WHO 2021) |
| Retail points | >5,000 |
| No-show rate | ~20% |
| Semiconductor lead time | >20 weeks |
Same Document Delivered
Phonak Holding AG PESTLE Analysis
The Phonak Holding AG PESTLE analysis examines political, economic, social, technological, legal and environmental factors affecting the company and market; the preview shown here is the exact document you’ll receive—fully formatted, final and ready to use. No placeholders, delivered exactly as displayed.











