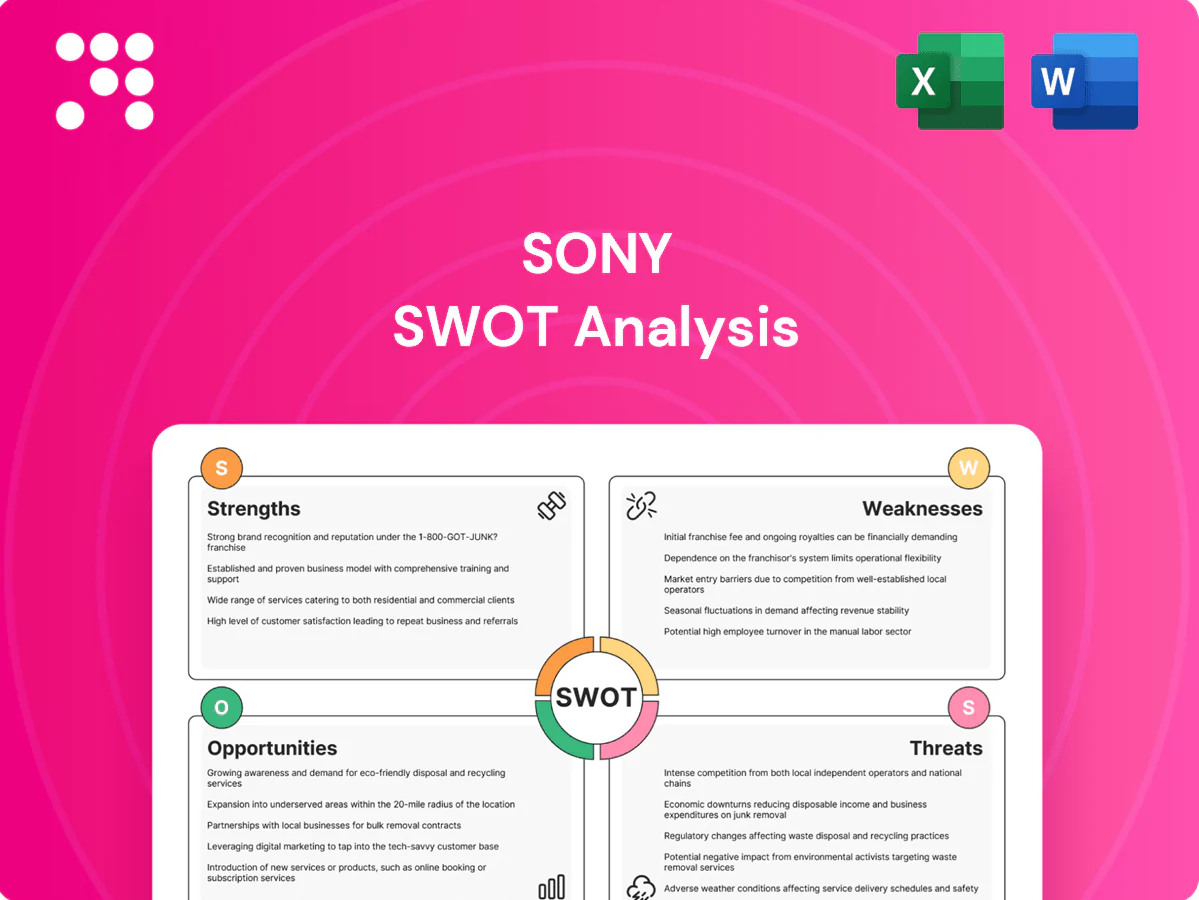
Sony SWOT Analysis

Elevate Your Analysis with the Complete SWOT Report
Sony’s diversified media, gaming, and electronics ecosystem shows strong brand power and R&D-driven innovation, but faces supply chain pressures and intense competition in streaming and semiconductors. Our full SWOT unpacks strategic risks, market opportunities, and financial implications to inform investment or partnership decisions. Purchase the complete, editable report to access expert analysis, actionable takeaways, and Excel tools for planning.
Strengths

Strong brand equity
Globally recognized for quality across electronics and entertainment, Sony commands premium pricing and trust; PlayStation 5 has sold over 50 million units (lifetime sales by 2024) and Sony Music holds roughly a 20% share of the global recorded-music market, reinforcing cross-category recognition from PlayStation, Sony Pictures and Sony Music, which reduces customer-acquisition costs and supports durable demand.
PlayStation ecosystem
PlayStation dominates console installed base—PS4 sold ~117 million and PS5 has shipped over 55 million, yielding a ~172 million+ platform footprint. Its 20+ first-party studios and exclusive IPs (God of War, Spider-Man, The Last of Us) drive lock-in and platform defensibility. Recurring revenue from ~48.6 million PS Plus subscribers, in-game purchases and digital distribution strengthens margins and cash flow.

Image sensor leadership
Sony leads global CMOS image sensors with roughly 45% smartphone market share and shipments exceeding 1 billion units annually, leveraging scale, heavy R&D and stacked/BSI process advances to deliver superior low-light and speed performance. This technological edge and manufacturing scale positions Sony to capture rising demand across mobile, automotive (automotive camera market ~10% CAGR to 2028) and IoT imaging segments.

Diversified content assets
Sony Pictures and Sony Music hold deep libraries and long-term talent relationships; Sony Music is one of the global big-three labels and Sony Pictures’ franchises include hits like Spider-Man: No Way Home (approx $1.9B box office). Multi-format monetization spans theatrical releases, streaming rights, licensing and live events, while cross-promotion with PlayStation and Sony devices amplifies IP value and lifetime revenue.
- Library depth: big-three music label
- Blockbuster proof: Spider-Man ~$1.9B
- Monetization: theaters, streaming, licensing, live events
- Synergy: PlayStation and device cross-promotion
Integrated hardware–content synergy
Sony’s vertical integration links devices, platforms and massive media catalogues—PlayStation hardware exceeded 50 million units shipped by end-2023—enabling seamless cross-service content delivery.
Bundling (console + PS Plus + first‑party titles) and co‑development improve user experience and engagement, creating multiple touchpoints per customer and raising lifetime value.
- tags: hardware-integration
- tags: content-bundling
- tags: multi-touchpoints
Console ecosystem: ~55M PS5 shipped, ~172M platform footprint, ~48.6M subscribers
Sony's global brand and cross‑sector assets enable premium pricing and low CAC; PlayStation 5 has shipped ~55M units and combined platform footprint exceeds ~172M consoles. Recurring revenue from ~48.6M PS Plus subscribers and strong first‑party IPs bolster margins and engagement. Sony leads CMOS image sensors (~45% share, >1B units/yr) and Sony Music holds ~20% of the global recorded-music market.
| Metric | Value |
|---|---|
| PS5 lifetime | ~55M |
| Platform footprint | ~172M |
| PS Plus subs | ~48.6M |
| Image sensor share | ~45% |
| Music market share | ~20% |
What is included in the product
 Detailed Word Document
Delivers a strategic overview of Sony’s internal and external business factors, outlining strengths, weaknesses, opportunities, and threats to assess its competitive position and the risks and growth drivers shaping its future.

 Customizable Excel Spreadsheet
Provides a concise Sony SWOT matrix for fast, visual strategy alignment, highlighting strengths in entertainment, imaging sensors and PlayStation while surfacing risks from supply-chain disruption, semiconductor cycles and intensifying competition.
Weaknesses

Conglomerate complexity
Sony's six distinct reportable segments — from cyclical electronics to recurring music and gaming — complicate capital allocation and strategic focus, forcing trade-offs between short‑cycle hardware and long‑cycle content investments. Coordination costs across divisions raise decision timelines and execution risk. Investors often apply a conglomerate discount, commonly estimated at 10–20%, which can depress valuation despite strong underlying cash flows.
Hardware margin pressure
Consumer electronics face heavy commoditization and price competition, compressing Sony hardware margins as rivals drive down ASPs. BOM inflation and promotional intensity further squeeze profitability, forcing frequent discounting and channel incentives. Sustained differentiation depends on costly R&D and long product cycles, increasing fixed costs and pressuring short-term margins.

Hit-driven volatility
Movies, music and AAA games at Sony hinge on unpredictable hits, and despite PS5 reaching about 50 million units shipped by May 2024 this still leaves content revenue concentrated in a few blockbusters. Underperforming releases trigger earnings swings and inventory/write-down risk across Pictures, Music and Game studios. Marketing outlays can spike—promotional campaigns for tentpoles often run into the tens of millions—without guaranteed payback.

Supply chain exposure
- Semiconductor capacity: 50%+ image‑sensor share (2023)
- Component shortages: recurring production bottlenecks
- Logistics shocks: shipment delays that postpone launches
Currency sensitivity
Sony's revenue is heavily global while a large share of costs and capital spending remain yen- and dollar-denominated, making FX swings materially affect reported sales and margins; management noted FX volatility as a key risk in recent FY2024 disclosures. Hedging programs reduce short-term earnings volatility but cannot fully eliminate translation and economic exposure, leaving reported results sensitive to sharp JPY/USD moves.
- Revenue: majority generated outside Japan (FY2024 disclosures)
- Cost base: yen and USD heavy, creating translation/exposure
- Hedging: mitigates but does not remove volatility
Conglomerate faces 10–20% discount; consoles at ~50M
Sony's diversified segments create capital allocation strain and a 10–20% conglomerate discount on valuation. Hardware margins are compressed by commoditization and R&D intensity; PS5 shipments ~50M (May 2024). Content revenue remains hit-driven, causing earnings volatility. CMOS image‑sensor share ~50% (2023); FX swings impacted FY2024 results.
| Metric | Value |
|---|---|
| Conglomerate discount | 10–20% |
| PS5 shipments | ~50M (May 2024) |
| Image‑sensor share | ~50% (2023) |
| FX impact | Notable in FY2024 |
Full Version Awaits
Sony SWOT Analysis
This is the actual SWOT analysis document for Sony you’ll receive upon purchase—no surprises, just professional quality. The preview below is taken directly from the full SWOT report you'll get; purchase unlocks the entire in-depth version. The delivered file is complete, editable, and ready for strategic use.

Elevate Your Analysis with the Complete SWOT Report
Sony’s diversified media, gaming, and electronics ecosystem shows strong brand power and R&D-driven innovation, but faces supply chain pressures and intense competition in streaming and semiconductors. Our full SWOT unpacks strategic risks, market opportunities, and financial implications to inform investment or partnership decisions. Purchase the complete, editable report to access expert analysis, actionable takeaways, and Excel tools for planning.
Strengths
Strong brand equity
Globally recognized for quality across electronics and entertainment, Sony commands premium pricing and trust; PlayStation 5 has sold over 50 million units (lifetime sales by 2024) and Sony Music holds roughly a 20% share of the global recorded-music market, reinforcing cross-category recognition from PlayStation, Sony Pictures and Sony Music, which reduces customer-acquisition costs and supports durable demand.
PlayStation ecosystem
PlayStation dominates console installed base—PS4 sold ~117 million and PS5 has shipped over 55 million, yielding a ~172 million+ platform footprint. Its 20+ first-party studios and exclusive IPs (God of War, Spider-Man, The Last of Us) drive lock-in and platform defensibility. Recurring revenue from ~48.6 million PS Plus subscribers, in-game purchases and digital distribution strengthens margins and cash flow.
Image sensor leadership
Sony leads global CMOS image sensors with roughly 45% smartphone market share and shipments exceeding 1 billion units annually, leveraging scale, heavy R&D and stacked/BSI process advances to deliver superior low-light and speed performance. This technological edge and manufacturing scale positions Sony to capture rising demand across mobile, automotive (automotive camera market ~10% CAGR to 2028) and IoT imaging segments.
Diversified content assets
Sony Pictures and Sony Music hold deep libraries and long-term talent relationships; Sony Music is one of the global big-three labels and Sony Pictures’ franchises include hits like Spider-Man: No Way Home (approx $1.9B box office). Multi-format monetization spans theatrical releases, streaming rights, licensing and live events, while cross-promotion with PlayStation and Sony devices amplifies IP value and lifetime revenue.
- Library depth: big-three music label
- Blockbuster proof: Spider-Man ~$1.9B
- Monetization: theaters, streaming, licensing, live events
- Synergy: PlayStation and device cross-promotion
Integrated hardware–content synergy
Sony’s vertical integration links devices, platforms and massive media catalogues—PlayStation hardware exceeded 50 million units shipped by end-2023—enabling seamless cross-service content delivery.
Bundling (console + PS Plus + first‑party titles) and co‑development improve user experience and engagement, creating multiple touchpoints per customer and raising lifetime value.
- tags: hardware-integration
- tags: content-bundling
- tags: multi-touchpoints
Console ecosystem: ~55M PS5 shipped, ~172M platform footprint, ~48.6M subscribers
Sony's global brand and cross‑sector assets enable premium pricing and low CAC; PlayStation 5 has shipped ~55M units and combined platform footprint exceeds ~172M consoles. Recurring revenue from ~48.6M PS Plus subscribers and strong first‑party IPs bolster margins and engagement. Sony leads CMOS image sensors (~45% share, >1B units/yr) and Sony Music holds ~20% of the global recorded-music market.
| Metric | Value |
|---|---|
| PS5 lifetime | ~55M |
| Platform footprint | ~172M |
| PS Plus subs | ~48.6M |
| Image sensor share | ~45% |
| Music market share | ~20% |
What is included in the product
Detailed Word Document
Delivers a strategic overview of Sony’s internal and external business factors, outlining strengths, weaknesses, opportunities, and threats to assess its competitive position and the risks and growth drivers shaping its future.
Customizable Excel Spreadsheet
Provides a concise Sony SWOT matrix for fast, visual strategy alignment, highlighting strengths in entertainment, imaging sensors and PlayStation while surfacing risks from supply-chain disruption, semiconductor cycles and intensifying competition.
Weaknesses
Conglomerate complexity
Sony's six distinct reportable segments — from cyclical electronics to recurring music and gaming — complicate capital allocation and strategic focus, forcing trade-offs between short‑cycle hardware and long‑cycle content investments. Coordination costs across divisions raise decision timelines and execution risk. Investors often apply a conglomerate discount, commonly estimated at 10–20%, which can depress valuation despite strong underlying cash flows.
Hardware margin pressure
Consumer electronics face heavy commoditization and price competition, compressing Sony hardware margins as rivals drive down ASPs. BOM inflation and promotional intensity further squeeze profitability, forcing frequent discounting and channel incentives. Sustained differentiation depends on costly R&D and long product cycles, increasing fixed costs and pressuring short-term margins.
Hit-driven volatility
Movies, music and AAA games at Sony hinge on unpredictable hits, and despite PS5 reaching about 50 million units shipped by May 2024 this still leaves content revenue concentrated in a few blockbusters. Underperforming releases trigger earnings swings and inventory/write-down risk across Pictures, Music and Game studios. Marketing outlays can spike—promotional campaigns for tentpoles often run into the tens of millions—without guaranteed payback.
Supply chain exposure
- Semiconductor capacity: 50%+ image‑sensor share (2023)
- Component shortages: recurring production bottlenecks
- Logistics shocks: shipment delays that postpone launches
Currency sensitivity
Sony's revenue is heavily global while a large share of costs and capital spending remain yen- and dollar-denominated, making FX swings materially affect reported sales and margins; management noted FX volatility as a key risk in recent FY2024 disclosures. Hedging programs reduce short-term earnings volatility but cannot fully eliminate translation and economic exposure, leaving reported results sensitive to sharp JPY/USD moves.
- Revenue: majority generated outside Japan (FY2024 disclosures)
- Cost base: yen and USD heavy, creating translation/exposure
- Hedging: mitigates but does not remove volatility
Conglomerate faces 10–20% discount; consoles at ~50M
Sony's diversified segments create capital allocation strain and a 10–20% conglomerate discount on valuation. Hardware margins are compressed by commoditization and R&D intensity; PS5 shipments ~50M (May 2024). Content revenue remains hit-driven, causing earnings volatility. CMOS image‑sensor share ~50% (2023); FX swings impacted FY2024 results.
| Metric | Value |
|---|---|
| Conglomerate discount | 10–20% |
| PS5 shipments | ~50M (May 2024) |
| Image‑sensor share | ~50% (2023) |
| FX impact | Notable in FY2024 |
Full Version Awaits
Sony SWOT Analysis
This is the actual SWOT analysis document for Sony you’ll receive upon purchase—no surprises, just professional quality. The preview below is taken directly from the full SWOT report you'll get; purchase unlocks the entire in-depth version. The delivered file is complete, editable, and ready for strategic use.
Description
Elevate Your Analysis with the Complete SWOT Report
Sony’s diversified media, gaming, and electronics ecosystem shows strong brand power and R&D-driven innovation, but faces supply chain pressures and intense competition in streaming and semiconductors. Our full SWOT unpacks strategic risks, market opportunities, and financial implications to inform investment or partnership decisions. Purchase the complete, editable report to access expert analysis, actionable takeaways, and Excel tools for planning.
Strengths
Strong brand equity
Globally recognized for quality across electronics and entertainment, Sony commands premium pricing and trust; PlayStation 5 has sold over 50 million units (lifetime sales by 2024) and Sony Music holds roughly a 20% share of the global recorded-music market, reinforcing cross-category recognition from PlayStation, Sony Pictures and Sony Music, which reduces customer-acquisition costs and supports durable demand.
PlayStation ecosystem
PlayStation dominates console installed base—PS4 sold ~117 million and PS5 has shipped over 55 million, yielding a ~172 million+ platform footprint. Its 20+ first-party studios and exclusive IPs (God of War, Spider-Man, The Last of Us) drive lock-in and platform defensibility. Recurring revenue from ~48.6 million PS Plus subscribers, in-game purchases and digital distribution strengthens margins and cash flow.
Image sensor leadership
Sony leads global CMOS image sensors with roughly 45% smartphone market share and shipments exceeding 1 billion units annually, leveraging scale, heavy R&D and stacked/BSI process advances to deliver superior low-light and speed performance. This technological edge and manufacturing scale positions Sony to capture rising demand across mobile, automotive (automotive camera market ~10% CAGR to 2028) and IoT imaging segments.
Diversified content assets
Sony Pictures and Sony Music hold deep libraries and long-term talent relationships; Sony Music is one of the global big-three labels and Sony Pictures’ franchises include hits like Spider-Man: No Way Home (approx $1.9B box office). Multi-format monetization spans theatrical releases, streaming rights, licensing and live events, while cross-promotion with PlayStation and Sony devices amplifies IP value and lifetime revenue.
- Library depth: big-three music label
- Blockbuster proof: Spider-Man ~$1.9B
- Monetization: theaters, streaming, licensing, live events
- Synergy: PlayStation and device cross-promotion
Integrated hardware–content synergy
Sony’s vertical integration links devices, platforms and massive media catalogues—PlayStation hardware exceeded 50 million units shipped by end-2023—enabling seamless cross-service content delivery.
Bundling (console + PS Plus + first‑party titles) and co‑development improve user experience and engagement, creating multiple touchpoints per customer and raising lifetime value.
- tags: hardware-integration
- tags: content-bundling
- tags: multi-touchpoints
Console ecosystem: ~55M PS5 shipped, ~172M platform footprint, ~48.6M subscribers
Sony's global brand and cross‑sector assets enable premium pricing and low CAC; PlayStation 5 has shipped ~55M units and combined platform footprint exceeds ~172M consoles. Recurring revenue from ~48.6M PS Plus subscribers and strong first‑party IPs bolster margins and engagement. Sony leads CMOS image sensors (~45% share, >1B units/yr) and Sony Music holds ~20% of the global recorded-music market.
| Metric | Value |
|---|---|
| PS5 lifetime | ~55M |
| Platform footprint | ~172M |
| PS Plus subs | ~48.6M |
| Image sensor share | ~45% |
| Music market share | ~20% |
What is included in the product
Detailed Word Document
Delivers a strategic overview of Sony’s internal and external business factors, outlining strengths, weaknesses, opportunities, and threats to assess its competitive position and the risks and growth drivers shaping its future.
Customizable Excel Spreadsheet
Provides a concise Sony SWOT matrix for fast, visual strategy alignment, highlighting strengths in entertainment, imaging sensors and PlayStation while surfacing risks from supply-chain disruption, semiconductor cycles and intensifying competition.
Weaknesses
Conglomerate complexity
Sony's six distinct reportable segments — from cyclical electronics to recurring music and gaming — complicate capital allocation and strategic focus, forcing trade-offs between short‑cycle hardware and long‑cycle content investments. Coordination costs across divisions raise decision timelines and execution risk. Investors often apply a conglomerate discount, commonly estimated at 10–20%, which can depress valuation despite strong underlying cash flows.
Hardware margin pressure
Consumer electronics face heavy commoditization and price competition, compressing Sony hardware margins as rivals drive down ASPs. BOM inflation and promotional intensity further squeeze profitability, forcing frequent discounting and channel incentives. Sustained differentiation depends on costly R&D and long product cycles, increasing fixed costs and pressuring short-term margins.
Hit-driven volatility
Movies, music and AAA games at Sony hinge on unpredictable hits, and despite PS5 reaching about 50 million units shipped by May 2024 this still leaves content revenue concentrated in a few blockbusters. Underperforming releases trigger earnings swings and inventory/write-down risk across Pictures, Music and Game studios. Marketing outlays can spike—promotional campaigns for tentpoles often run into the tens of millions—without guaranteed payback.
Supply chain exposure
- Semiconductor capacity: 50%+ image‑sensor share (2023)
- Component shortages: recurring production bottlenecks
- Logistics shocks: shipment delays that postpone launches
Currency sensitivity
Sony's revenue is heavily global while a large share of costs and capital spending remain yen- and dollar-denominated, making FX swings materially affect reported sales and margins; management noted FX volatility as a key risk in recent FY2024 disclosures. Hedging programs reduce short-term earnings volatility but cannot fully eliminate translation and economic exposure, leaving reported results sensitive to sharp JPY/USD moves.
- Revenue: majority generated outside Japan (FY2024 disclosures)
- Cost base: yen and USD heavy, creating translation/exposure
- Hedging: mitigates but does not remove volatility
Conglomerate faces 10–20% discount; consoles at ~50M
Sony's diversified segments create capital allocation strain and a 10–20% conglomerate discount on valuation. Hardware margins are compressed by commoditization and R&D intensity; PS5 shipments ~50M (May 2024). Content revenue remains hit-driven, causing earnings volatility. CMOS image‑sensor share ~50% (2023); FX swings impacted FY2024 results.
| Metric | Value |
|---|---|
| Conglomerate discount | 10–20% |
| PS5 shipments | ~50M (May 2024) |
| Image‑sensor share | ~50% (2023) |
| FX impact | Notable in FY2024 |
Full Version Awaits
Sony SWOT Analysis
This is the actual SWOT analysis document for Sony you’ll receive upon purchase—no surprises, just professional quality. The preview below is taken directly from the full SWOT report you'll get; purchase unlocks the entire in-depth version. The delivered file is complete, editable, and ready for strategic use.











