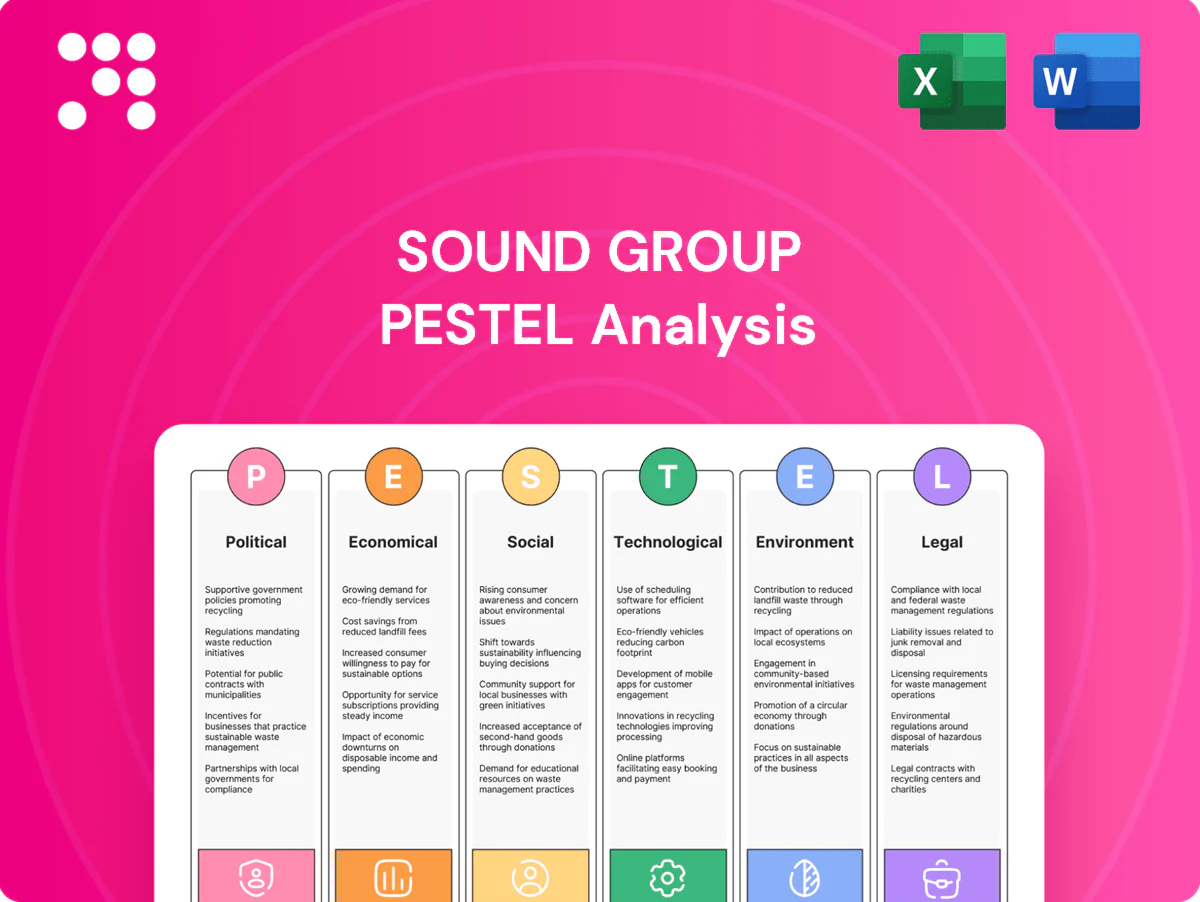
Sound Group PESTLE Analysis

Your Shortcut to Market Insight Starts Here
Unlock strategic advantage with our concise PESTLE Analysis of Sound Group—three to five critical sentences revealing how political, economic, social, technological, legal, and environmental forces are reshaping its prospects. Tailored for investors and strategists, this snapshot highlights risks and growth levers you can act on immediately. Purchase the full, editable report for the complete, actionable breakdown and download instantly.
Political factors

Platform regulation
Governments are tightening platform regulation — notably the EU Digital Services Act (fines up to 6% of global turnover) and the UK Online Safety Act 2023 — raising requirements on safety, misinformation and content accountability. Compliance shapes product features, moderation intensity and transparency reporting and can add hundreds of millions to billions in operating costs for large platforms. Shifts in rules can constrain engagement mechanics, while proactive policy engagement and sandboxing reduce risk of abrupt regulatory shocks.
Data localization
Several countries, notably China, Russia, Indonesia and Nigeria, mandate local storage or restrict cross-border transfers under frameworks like EU GDPR, fragmenting infrastructure and complicating global architecture choices. This raises latency and per-user cloud costs and hinders feature parity. With major clouds now spanning 60+ regions globally, strategic cloud-region planning is critical for scalable, compliant deployment.

Geopolitical tensions
Geopolitical tensions can curtail market access via cross-border frictions and app bans, as seen when India banned 59 Chinese apps in June 2020. Payment flows and ad demand face disruption—e.g., SWIFT exclusions of Russian banks in 2022 constrained transactions. Vendor and developer partnerships increasingly face regulatory scrutiny under measures like the EU Digital Markets Act. Diversifying revenue and markets reduces concentration risk.

Subsidies and incentives
Digital economy grants and tax incentives can materially offset R&D and hiring costs; EU Digital Europe allocates €7.5 billion for 2021–2027, illustrating scale. Eligibility typically hinges on local footprint and regulatory compliance, so onshore operations and documentation are essential. Leveraging incentives can improve unit economics for new features, but sunset clauses (many programmes end in 2027) require forward planning to avoid post-incentive cost cliffs.
- Program scale: EU Digital Europe €7.5B (2021–2027)
- Eligibility: local footprint + compliance
- Benefit: lowers R&D/hiring unit costs
- Risk: sunset clauses → plan for post-incentive costs
Trade and standards
Global standards for AI, encryption and telecoms (ETSI, 3GPP, ITU) directly shape Sound Group product design; the EU AI Act reached political agreement in 2023 and moved toward adoption in 2024, while US export controls on high-end GPUs and cloud AI tools tightened in 2023–24, limiting transfers to certain jurisdictions.
- Align with ETSI/3GPP/ITU
- Monitor EU AI Act timelines (2024)
- Assess US export controls (2023–24)
- Join standards bodies early
Global tech compliance costs surge: DSA fines, data localization, AI export limits
Regulatory tightening (EU DSA fines up to 6% global turnover; UK Online Safety Act 2023) raises moderation, reporting and compliance costs. Data localization rules (GDPR local restrictions; China/India/Indonesia) increase latency and cloud costs. Geopolitics (India 2020 app bans; SWIFT exclusions 2022) and AI/export controls (US 2023–24; EU AI Act 2024) constrain markets and tech transfers.
| Risk | Key number |
|---|---|
| DSA fines | Up to 6% turnover |
| EU Digital Europe | €7.5B (2021–27) |
| AI/Export rules | EU AI Act 2024; US controls 2023–24 |
What is included in the product
 Detailed Word Document
Explores how external macro-environmental factors uniquely affect the Sound Group across six dimensions—Political, Economic, Social, Technological, Environmental, and Legal—using current data and trend analysis. Designed to help executives, consultants, and entrepreneurs identify actionable threats and opportunities for strategy and funding decisions.

 Customizable Excel Spreadsheet
A concise, visually segmented PESTLE summary for Sound Group that’s editable and easily shareable, easing cross-team alignment and speeding strategic decision-making during planning sessions.
Economic factors

Ad cycle sensitivity
Advertising budgets typically contract 10–20% in downturns, pressuring CPMs and fill rates with CPMs often falling 15–30% in weak markets. Audio inventory has shown resilience—streaming and podcast hours grew materially through 2019–2024—but remains vulnerable to ad cycles. Diversifying into subscriptions and virtual goods smooths revenue while dynamic pricing and yield optimization help preserve ARPU.
Consumer spending
Discretionary spend cuts reduce subscriptions, tips and microtransactions; US inflation eased to about 3.4% in 2024, squeezing entertainment budgets. With Spotify at ~232 million paid subscribers (Q4 2024), bundles and regional pricing have proven to defend conversion. Flexible, lower‑tier plans and promotional trials materially lower churn during weak macro periods.

FX and cross-border
Multi-currency revenues expose Sound Group to translation volatility amid a global FX market trading about $7.5 trillion daily (BIS 2022). App store settlements from Apple and Google are processed monthly, and ad-network payment cycles create timing mismatches. Natural hedges from localizing costs reduce net exposure. Formal hedging policies further stabilize cash flows for planning.

Scale economies
Scale economies in audio delivery arise from shared CDN and cloud infrastructure—AWS S3 standard storage in 2024 was about $0.023/GB‑month and spot instances can cut compute costs up to 90%—so fixed R&D and moderation spend amortize as users grow, while network effects historically reduce CAC. Peak concurrency, however, can spike variable CDN/compute costs if not managed.
- Cloud price: S3 ~$0.023/GB‑mo (2024)
- Spot savings: up to 90%
- Fixed costs amortize with scale
- Peak concurrency raises variable costs
Creator economy dynamics
Creator supply and monetization options shape platform take rates, which typically range from 5 to 30% across major platforms; competing platforms’ incentive programs have pushed creator acquisition costs higher, with industry reports indicating mid-double-digit YoY increases in CAC during 2023–24. Tools that boost creator earnings—subscriptions, tipping, commerce—improved retention; major platforms paid creators over 15 billion USD in 2023, while transparent, timely payouts correlate with higher lifetime creator loyalty.
- take-rates: 5–30%
- creator-payouts: >15B USD (2023)
- CAC: mid-double-digit YoY rise (2023–24)
- retention: higher with earnings-tools + transparent payouts
Global tech compliance costs surge: DSA fines, data localization, AI export limits
Ad spend drops 10–20% in downturns, CPMs fall 15–30%; audio hours grew 2019–24 but remain ad-cycle sensitive. US inflation ~3.4% (2024); Spotify ~232M paid (Q4 2024). FX trades ~$7.5T/day; S3 ~$0.023/GB‑mo (2024). Creator payouts >15B USD (2023); take‑rates 5–30%; CAC rose mid‑double digits (2023–24).
| Metric | Value |
|---|---|
| Ad cut | 10–20% |
| CPM fall | 15–30% |
| Inflation (US) | ~3.4% (2024) |
| Spotify paid | ~232M (Q4 2024) |
| FX volume | $7.5T/day |
| S3 price | $0.023/GB‑mo (2024) |
| Creator payouts | >$15B (2023) |
| Take‑rates | 5–30% |
| CAC change | mid‑double digits (2023–24) |
Preview the Actual Deliverable
Sound Group PESTLE Analysis
The preview shown here is the exact Sound Group PESTLE Analysis document you’ll receive after purchase—fully formatted, professionally structured, and ready to use. No placeholders or teasers; the layout, content, and structure are identical to the downloadable file.

Your Shortcut to Market Insight Starts Here
Unlock strategic advantage with our concise PESTLE Analysis of Sound Group—three to five critical sentences revealing how political, economic, social, technological, legal, and environmental forces are reshaping its prospects. Tailored for investors and strategists, this snapshot highlights risks and growth levers you can act on immediately. Purchase the full, editable report for the complete, actionable breakdown and download instantly.
Political factors
Platform regulation
Governments are tightening platform regulation — notably the EU Digital Services Act (fines up to 6% of global turnover) and the UK Online Safety Act 2023 — raising requirements on safety, misinformation and content accountability. Compliance shapes product features, moderation intensity and transparency reporting and can add hundreds of millions to billions in operating costs for large platforms. Shifts in rules can constrain engagement mechanics, while proactive policy engagement and sandboxing reduce risk of abrupt regulatory shocks.
Data localization
Several countries, notably China, Russia, Indonesia and Nigeria, mandate local storage or restrict cross-border transfers under frameworks like EU GDPR, fragmenting infrastructure and complicating global architecture choices. This raises latency and per-user cloud costs and hinders feature parity. With major clouds now spanning 60+ regions globally, strategic cloud-region planning is critical for scalable, compliant deployment.
Geopolitical tensions
Geopolitical tensions can curtail market access via cross-border frictions and app bans, as seen when India banned 59 Chinese apps in June 2020. Payment flows and ad demand face disruption—e.g., SWIFT exclusions of Russian banks in 2022 constrained transactions. Vendor and developer partnerships increasingly face regulatory scrutiny under measures like the EU Digital Markets Act. Diversifying revenue and markets reduces concentration risk.
Subsidies and incentives
Digital economy grants and tax incentives can materially offset R&D and hiring costs; EU Digital Europe allocates €7.5 billion for 2021–2027, illustrating scale. Eligibility typically hinges on local footprint and regulatory compliance, so onshore operations and documentation are essential. Leveraging incentives can improve unit economics for new features, but sunset clauses (many programmes end in 2027) require forward planning to avoid post-incentive cost cliffs.
- Program scale: EU Digital Europe €7.5B (2021–2027)
- Eligibility: local footprint + compliance
- Benefit: lowers R&D/hiring unit costs
- Risk: sunset clauses → plan for post-incentive costs
Trade and standards
Global standards for AI, encryption and telecoms (ETSI, 3GPP, ITU) directly shape Sound Group product design; the EU AI Act reached political agreement in 2023 and moved toward adoption in 2024, while US export controls on high-end GPUs and cloud AI tools tightened in 2023–24, limiting transfers to certain jurisdictions.
- Align with ETSI/3GPP/ITU
- Monitor EU AI Act timelines (2024)
- Assess US export controls (2023–24)
- Join standards bodies early
Global tech compliance costs surge: DSA fines, data localization, AI export limits
Regulatory tightening (EU DSA fines up to 6% global turnover; UK Online Safety Act 2023) raises moderation, reporting and compliance costs. Data localization rules (GDPR local restrictions; China/India/Indonesia) increase latency and cloud costs. Geopolitics (India 2020 app bans; SWIFT exclusions 2022) and AI/export controls (US 2023–24; EU AI Act 2024) constrain markets and tech transfers.
| Risk | Key number |
|---|---|
| DSA fines | Up to 6% turnover |
| EU Digital Europe | €7.5B (2021–27) |
| AI/Export rules | EU AI Act 2024; US controls 2023–24 |
What is included in the product
Detailed Word Document
Explores how external macro-environmental factors uniquely affect the Sound Group across six dimensions—Political, Economic, Social, Technological, Environmental, and Legal—using current data and trend analysis. Designed to help executives, consultants, and entrepreneurs identify actionable threats and opportunities for strategy and funding decisions.
Customizable Excel Spreadsheet
A concise, visually segmented PESTLE summary for Sound Group that’s editable and easily shareable, easing cross-team alignment and speeding strategic decision-making during planning sessions.
Economic factors
Ad cycle sensitivity
Advertising budgets typically contract 10–20% in downturns, pressuring CPMs and fill rates with CPMs often falling 15–30% in weak markets. Audio inventory has shown resilience—streaming and podcast hours grew materially through 2019–2024—but remains vulnerable to ad cycles. Diversifying into subscriptions and virtual goods smooths revenue while dynamic pricing and yield optimization help preserve ARPU.
Consumer spending
Discretionary spend cuts reduce subscriptions, tips and microtransactions; US inflation eased to about 3.4% in 2024, squeezing entertainment budgets. With Spotify at ~232 million paid subscribers (Q4 2024), bundles and regional pricing have proven to defend conversion. Flexible, lower‑tier plans and promotional trials materially lower churn during weak macro periods.
FX and cross-border
Multi-currency revenues expose Sound Group to translation volatility amid a global FX market trading about $7.5 trillion daily (BIS 2022). App store settlements from Apple and Google are processed monthly, and ad-network payment cycles create timing mismatches. Natural hedges from localizing costs reduce net exposure. Formal hedging policies further stabilize cash flows for planning.
Scale economies
Scale economies in audio delivery arise from shared CDN and cloud infrastructure—AWS S3 standard storage in 2024 was about $0.023/GB‑month and spot instances can cut compute costs up to 90%—so fixed R&D and moderation spend amortize as users grow, while network effects historically reduce CAC. Peak concurrency, however, can spike variable CDN/compute costs if not managed.
- Cloud price: S3 ~$0.023/GB‑mo (2024)
- Spot savings: up to 90%
- Fixed costs amortize with scale
- Peak concurrency raises variable costs
Creator economy dynamics
Creator supply and monetization options shape platform take rates, which typically range from 5 to 30% across major platforms; competing platforms’ incentive programs have pushed creator acquisition costs higher, with industry reports indicating mid-double-digit YoY increases in CAC during 2023–24. Tools that boost creator earnings—subscriptions, tipping, commerce—improved retention; major platforms paid creators over 15 billion USD in 2023, while transparent, timely payouts correlate with higher lifetime creator loyalty.
- take-rates: 5–30%
- creator-payouts: >15B USD (2023)
- CAC: mid-double-digit YoY rise (2023–24)
- retention: higher with earnings-tools + transparent payouts
Global tech compliance costs surge: DSA fines, data localization, AI export limits
Ad spend drops 10–20% in downturns, CPMs fall 15–30%; audio hours grew 2019–24 but remain ad-cycle sensitive. US inflation ~3.4% (2024); Spotify ~232M paid (Q4 2024). FX trades ~$7.5T/day; S3 ~$0.023/GB‑mo (2024). Creator payouts >15B USD (2023); take‑rates 5–30%; CAC rose mid‑double digits (2023–24).
| Metric | Value |
|---|---|
| Ad cut | 10–20% |
| CPM fall | 15–30% |
| Inflation (US) | ~3.4% (2024) |
| Spotify paid | ~232M (Q4 2024) |
| FX volume | $7.5T/day |
| S3 price | $0.023/GB‑mo (2024) |
| Creator payouts | >$15B (2023) |
| Take‑rates | 5–30% |
| CAC change | mid‑double digits (2023–24) |
Preview the Actual Deliverable
Sound Group PESTLE Analysis
The preview shown here is the exact Sound Group PESTLE Analysis document you’ll receive after purchase—fully formatted, professionally structured, and ready to use. No placeholders or teasers; the layout, content, and structure are identical to the downloadable file.
Original: $10.00
-65%$10.00
$3.50Description
Your Shortcut to Market Insight Starts Here
Unlock strategic advantage with our concise PESTLE Analysis of Sound Group—three to five critical sentences revealing how political, economic, social, technological, legal, and environmental forces are reshaping its prospects. Tailored for investors and strategists, this snapshot highlights risks and growth levers you can act on immediately. Purchase the full, editable report for the complete, actionable breakdown and download instantly.
Political factors
Platform regulation
Governments are tightening platform regulation — notably the EU Digital Services Act (fines up to 6% of global turnover) and the UK Online Safety Act 2023 — raising requirements on safety, misinformation and content accountability. Compliance shapes product features, moderation intensity and transparency reporting and can add hundreds of millions to billions in operating costs for large platforms. Shifts in rules can constrain engagement mechanics, while proactive policy engagement and sandboxing reduce risk of abrupt regulatory shocks.
Data localization
Several countries, notably China, Russia, Indonesia and Nigeria, mandate local storage or restrict cross-border transfers under frameworks like EU GDPR, fragmenting infrastructure and complicating global architecture choices. This raises latency and per-user cloud costs and hinders feature parity. With major clouds now spanning 60+ regions globally, strategic cloud-region planning is critical for scalable, compliant deployment.
Geopolitical tensions
Geopolitical tensions can curtail market access via cross-border frictions and app bans, as seen when India banned 59 Chinese apps in June 2020. Payment flows and ad demand face disruption—e.g., SWIFT exclusions of Russian banks in 2022 constrained transactions. Vendor and developer partnerships increasingly face regulatory scrutiny under measures like the EU Digital Markets Act. Diversifying revenue and markets reduces concentration risk.
Subsidies and incentives
Digital economy grants and tax incentives can materially offset R&D and hiring costs; EU Digital Europe allocates €7.5 billion for 2021–2027, illustrating scale. Eligibility typically hinges on local footprint and regulatory compliance, so onshore operations and documentation are essential. Leveraging incentives can improve unit economics for new features, but sunset clauses (many programmes end in 2027) require forward planning to avoid post-incentive cost cliffs.
- Program scale: EU Digital Europe €7.5B (2021–2027)
- Eligibility: local footprint + compliance
- Benefit: lowers R&D/hiring unit costs
- Risk: sunset clauses → plan for post-incentive costs
Trade and standards
Global standards for AI, encryption and telecoms (ETSI, 3GPP, ITU) directly shape Sound Group product design; the EU AI Act reached political agreement in 2023 and moved toward adoption in 2024, while US export controls on high-end GPUs and cloud AI tools tightened in 2023–24, limiting transfers to certain jurisdictions.
- Align with ETSI/3GPP/ITU
- Monitor EU AI Act timelines (2024)
- Assess US export controls (2023–24)
- Join standards bodies early
Global tech compliance costs surge: DSA fines, data localization, AI export limits
Regulatory tightening (EU DSA fines up to 6% global turnover; UK Online Safety Act 2023) raises moderation, reporting and compliance costs. Data localization rules (GDPR local restrictions; China/India/Indonesia) increase latency and cloud costs. Geopolitics (India 2020 app bans; SWIFT exclusions 2022) and AI/export controls (US 2023–24; EU AI Act 2024) constrain markets and tech transfers.
| Risk | Key number |
|---|---|
| DSA fines | Up to 6% turnover |
| EU Digital Europe | €7.5B (2021–27) |
| AI/Export rules | EU AI Act 2024; US controls 2023–24 |
What is included in the product
Detailed Word Document
Explores how external macro-environmental factors uniquely affect the Sound Group across six dimensions—Political, Economic, Social, Technological, Environmental, and Legal—using current data and trend analysis. Designed to help executives, consultants, and entrepreneurs identify actionable threats and opportunities for strategy and funding decisions.
Customizable Excel Spreadsheet
A concise, visually segmented PESTLE summary for Sound Group that’s editable and easily shareable, easing cross-team alignment and speeding strategic decision-making during planning sessions.
Economic factors
Ad cycle sensitivity
Advertising budgets typically contract 10–20% in downturns, pressuring CPMs and fill rates with CPMs often falling 15–30% in weak markets. Audio inventory has shown resilience—streaming and podcast hours grew materially through 2019–2024—but remains vulnerable to ad cycles. Diversifying into subscriptions and virtual goods smooths revenue while dynamic pricing and yield optimization help preserve ARPU.
Consumer spending
Discretionary spend cuts reduce subscriptions, tips and microtransactions; US inflation eased to about 3.4% in 2024, squeezing entertainment budgets. With Spotify at ~232 million paid subscribers (Q4 2024), bundles and regional pricing have proven to defend conversion. Flexible, lower‑tier plans and promotional trials materially lower churn during weak macro periods.
FX and cross-border
Multi-currency revenues expose Sound Group to translation volatility amid a global FX market trading about $7.5 trillion daily (BIS 2022). App store settlements from Apple and Google are processed monthly, and ad-network payment cycles create timing mismatches. Natural hedges from localizing costs reduce net exposure. Formal hedging policies further stabilize cash flows for planning.
Scale economies
Scale economies in audio delivery arise from shared CDN and cloud infrastructure—AWS S3 standard storage in 2024 was about $0.023/GB‑month and spot instances can cut compute costs up to 90%—so fixed R&D and moderation spend amortize as users grow, while network effects historically reduce CAC. Peak concurrency, however, can spike variable CDN/compute costs if not managed.
- Cloud price: S3 ~$0.023/GB‑mo (2024)
- Spot savings: up to 90%
- Fixed costs amortize with scale
- Peak concurrency raises variable costs
Creator economy dynamics
Creator supply and monetization options shape platform take rates, which typically range from 5 to 30% across major platforms; competing platforms’ incentive programs have pushed creator acquisition costs higher, with industry reports indicating mid-double-digit YoY increases in CAC during 2023–24. Tools that boost creator earnings—subscriptions, tipping, commerce—improved retention; major platforms paid creators over 15 billion USD in 2023, while transparent, timely payouts correlate with higher lifetime creator loyalty.
- take-rates: 5–30%
- creator-payouts: >15B USD (2023)
- CAC: mid-double-digit YoY rise (2023–24)
- retention: higher with earnings-tools + transparent payouts
Global tech compliance costs surge: DSA fines, data localization, AI export limits
Ad spend drops 10–20% in downturns, CPMs fall 15–30%; audio hours grew 2019–24 but remain ad-cycle sensitive. US inflation ~3.4% (2024); Spotify ~232M paid (Q4 2024). FX trades ~$7.5T/day; S3 ~$0.023/GB‑mo (2024). Creator payouts >15B USD (2023); take‑rates 5–30%; CAC rose mid‑double digits (2023–24).
| Metric | Value |
|---|---|
| Ad cut | 10–20% |
| CPM fall | 15–30% |
| Inflation (US) | ~3.4% (2024) |
| Spotify paid | ~232M (Q4 2024) |
| FX volume | $7.5T/day |
| S3 price | $0.023/GB‑mo (2024) |
| Creator payouts | >$15B (2023) |
| Take‑rates | 5–30% |
| CAC change | mid‑double digits (2023–24) |
Preview the Actual Deliverable
Sound Group PESTLE Analysis
The preview shown here is the exact Sound Group PESTLE Analysis document you’ll receive after purchase—fully formatted, professionally structured, and ready to use. No placeholders or teasers; the layout, content, and structure are identical to the downloadable file.











