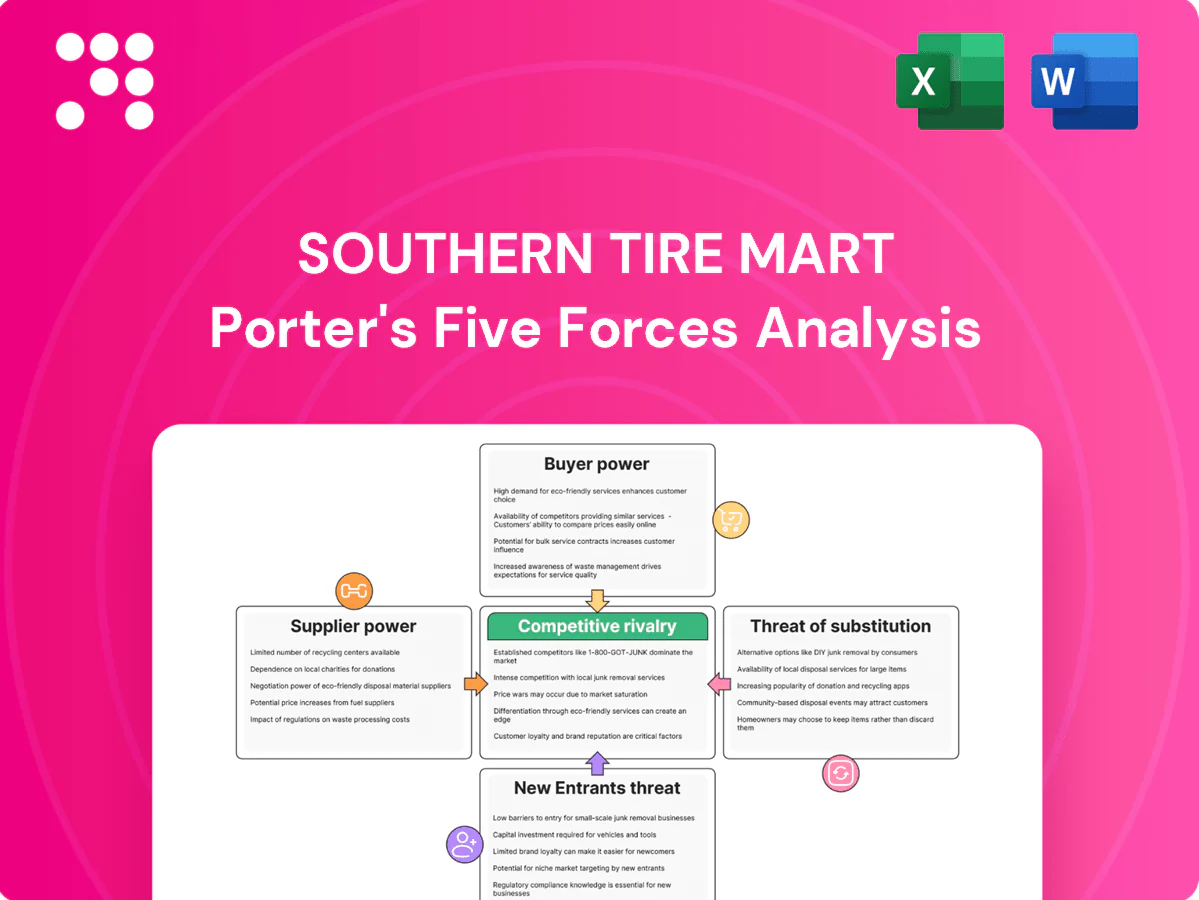
Southern Tire Mart Porter's Five Forces Analysis

Elevate Your Analysis with the Complete Porter's Five Forces Analysis
Southern Tire Mart faces moderate buyer power, concentrated supplier channels for commercial tires, and intense rivalry among national and regional players, while barriers to entry are elevated by distribution scale and service networks. This snapshot only scratches the surface. Unlock the full Porter's Five Forces Analysis to explore Southern Tire Mart’s competitive dynamics, market pressures, and strategic advantages in detail.
Suppliers Bargaining Power

Concentrated tire manufacturers
Major tire supply remains concentrated: the top five global manufacturers accounted for roughly 60% of OEM and replacement capacity in 2024, giving suppliers leverage on pricing and allocation. Southern Tire Mart’s multi-brand assortment reduces single-vendor risk but cannot fully eliminate exposure to allocation or price pressure. During demand spikes or supply disruptions, manufacturers have imposed price uplifts of 10–20%, forcing acceptance of higher costs. Long-term volume commitments and contractual rebates are used to secure allocation priority and mitigate cost volatility.
Specialized inputs and retread materials
Retread rubber, casing stocks and TPMS modules come from specialized vendors with few close substitutes, giving suppliers notable leverage over Southern Tire Mart; TPMS has seen >90% penetration in new passenger vehicles, raising OEM dependency. Quality variability directly affects warranty costs and service reputation, increasing supplier influence. Consistent-grade supply requires deep relationships and volume commitments, while dual-sourcing and in-house retread lines mitigate that power.

Brand pull-through and co-op funds
Premium brands drive customer preference, letting suppliers enforce MAP policies and steer SKU mix; co-op funds commonly cover up to 50% of approved marketing spend, aligning dealer promotions with supplier goals.
Tiered incentives and performance rebates link dealer payouts to sales targets, while reliance on brand equity can compress dealer margins by an estimated 2–5 percentage points in exchange for higher traffic.
Negotiating exclusive territories or performance tiers can rebalance economics, shifting marketing support and margin back toward dealers when tied to verifiable sales metrics.

Logistics and lead-time constraints
Logistics and lead-time constraints—freight volatility, import timelines, and regional warehousing—drive fill rates and carrying costs; disruptions or antidumping measures on imported tires in 2024 can quickly shift bargaining power to domestic suppliers with capacity, while Southern Tire Mart’s dense distribution footprint reduces last-mile risk but not upstream volatility.
Forward buys and safety stock are used to buffer shocks, shortening effective lead-time exposure.
- Freight volatility raises carrying costs
- Antidumping shifts power to domestic producers
- Distribution footprint limits last-mile but not supplier risk
Technology and data lock-in
Connected tire solutions, telematics, and proprietary diagnostics create vendor lock-in for Southern Tire Mart by embedding software into fleet workflows; 2024 studies show telematics can cut downtime ~20% and fuel use ~10%, raising perceived switching costs and enabling suppliers to upsell performance services.
- Lock-in: integration into fleet platforms increases switching costs
- Data power: performance access boosts upsell and pricing leverage
- Mitigation: open-API partners and standards reduce lock-in risk
Supplier power: top-5 hold ~60%, enabling 10–20% spikes; dealers hedge with multi-brand buys
Supplier power is high: top 5 tire makers hold ~60% capacity (2024), enabling 10–20% price uplifts during shocks. Specialized inputs (retread casings, TPMS >90% penetration) and brand MAPs lift switching costs; co-op funds can cover up to 50% of marketing, compressing dealer margins ~2–5pp. Southern Tire Mart uses multi-brand sourcing, forward buys and safety stock to mitigate allocation risk.
| Metric | 2024 Value |
|---|---|
| Top-5 market share | ~60% |
| Price uplifts (spikes) | 10–20% |
| TPMS penetration | >90% |
| Co-op funding | Up to 50% |
| Dealer margin impact | 2–5 pp |
What is included in the product
 Detailed Word Document
Tailored Porter's Five Forces overview for Southern Tire Mart highlighting competitive rivalry, supplier and buyer bargaining power, threats from substitutes and new entrants, and strategic levers to sustain margins and defend market share.

 Customizable Excel Spreadsheet
A clear, one-sheet summary of Southern Tire Mart's Five Forces—ideal for quick decisions and board decks; customize pressure levels, swap in your own data, and integrate into reports without macros or complex code to reflect evolving market dynamics.
Customers Bargaining Power

Large fleets with volume leverage
Large trucking and construction fleets negotiate national or regional contracts with tiered pricing, leveraging scale to drive competitive bids across dealers and brands. Fleets commonly secure rebates in the mid-single to low-double digit range (around 5–12% in 2024) and demand SLAs with uptime guarantees near 99%, squeezing dealer margins. Bundling tires, maintenance and asset tracking raises switching costs and can boost retention by roughly 15–25%.
Price transparency and online comparison
Retail consumers and small fleets increasingly use online marketplaces to compare tires; U.S. tire e-commerce was estimated at about $6–8 billion in 2024, intensifying price transparency. Clear online pricing compresses gross margins on common sizes, often by low single-digit percentage points. Value-added services and fast installation become key differentiators, while financing and extended warranties shift buying decisions away from headline price.

Switching costs are moderate
Alternative dealers operate in most service areas, so switching costs remain moderate for many buyers; national coverage often means multiple options within 50–100 miles. Bespoke service histories, roadside coverage and fleet telematics integrations increase inertia and extend practical switching timelines. Contractual rebates (commonly 2–4% in fleet programs) and performance metrics create economic lock-in, while proactive account management cuts churn risk.

Service quality sensitivity
Buyers weight uptime, roadside response times, and casing management heavily; industry estimates place commercial truck downtime costs at roughly $200–300 per hour, making service lapses immediately material to operating margins in 2024.
Poor service drives contract scrutiny and switching; strong KPIs (uptime > 98%, average roadside response < 60 minutes) justify premium pricing and lock in customers.
Consistent execution across Southern Tire Mart locations is essential to retain bargaining power and prevent buyer consolidation.
- Uptime focus: uptime > 98%
- Response: target < 60 minutes
- Casing management reduces capex and resale loss
Mix shift to lower-cost imports
- Cost-per-mile focus: many buyers shift to value imports
- Premium pressure: premium mix and margins down ~150 bps (2024)
- Countermeasures: lifecycle education and retread programs reposition value vs imports
Fleets secure 5-12% rebates, demand uptime over 98% and sub-60m response
Buyers—especially large fleets—wield strong price and service leverage, securing rebates of 5–12% and demanding uptime >98% and response <60 min. Tire e-commerce (~$6–8B in 2024) raises price transparency; import share ~20% cut premium mix, compressing margins ~150 bps. Downtime cost ~$200–300/hr makes service KPIs critical to retain contracts.
| Metric | 2024 Value |
|---|---|
| Fleet rebates | 5–12% |
| E‑commerce | $6–8B |
| Import share | ~20% |
| Margin compression | ~150 bps |
| Downtime cost | $200–300/hr |
Full Version Awaits
Southern Tire Mart Porter's Five Forces Analysis
This preview shows the exact Southern Tire Mart Porter's Five Forces analysis you'll receive—no surprises or placeholders. The document displayed is fully formatted and ready for download the moment you buy. You're viewing the actual deliverable, ready for immediate use.

Elevate Your Analysis with the Complete Porter's Five Forces Analysis
Southern Tire Mart faces moderate buyer power, concentrated supplier channels for commercial tires, and intense rivalry among national and regional players, while barriers to entry are elevated by distribution scale and service networks. This snapshot only scratches the surface. Unlock the full Porter's Five Forces Analysis to explore Southern Tire Mart’s competitive dynamics, market pressures, and strategic advantages in detail.
Suppliers Bargaining Power
Concentrated tire manufacturers
Major tire supply remains concentrated: the top five global manufacturers accounted for roughly 60% of OEM and replacement capacity in 2024, giving suppliers leverage on pricing and allocation. Southern Tire Mart’s multi-brand assortment reduces single-vendor risk but cannot fully eliminate exposure to allocation or price pressure. During demand spikes or supply disruptions, manufacturers have imposed price uplifts of 10–20%, forcing acceptance of higher costs. Long-term volume commitments and contractual rebates are used to secure allocation priority and mitigate cost volatility.
Specialized inputs and retread materials
Retread rubber, casing stocks and TPMS modules come from specialized vendors with few close substitutes, giving suppliers notable leverage over Southern Tire Mart; TPMS has seen >90% penetration in new passenger vehicles, raising OEM dependency. Quality variability directly affects warranty costs and service reputation, increasing supplier influence. Consistent-grade supply requires deep relationships and volume commitments, while dual-sourcing and in-house retread lines mitigate that power.
Brand pull-through and co-op funds
Premium brands drive customer preference, letting suppliers enforce MAP policies and steer SKU mix; co-op funds commonly cover up to 50% of approved marketing spend, aligning dealer promotions with supplier goals.
Tiered incentives and performance rebates link dealer payouts to sales targets, while reliance on brand equity can compress dealer margins by an estimated 2–5 percentage points in exchange for higher traffic.
Negotiating exclusive territories or performance tiers can rebalance economics, shifting marketing support and margin back toward dealers when tied to verifiable sales metrics.
Logistics and lead-time constraints
Logistics and lead-time constraints—freight volatility, import timelines, and regional warehousing—drive fill rates and carrying costs; disruptions or antidumping measures on imported tires in 2024 can quickly shift bargaining power to domestic suppliers with capacity, while Southern Tire Mart’s dense distribution footprint reduces last-mile risk but not upstream volatility.
Forward buys and safety stock are used to buffer shocks, shortening effective lead-time exposure.
- Freight volatility raises carrying costs
- Antidumping shifts power to domestic producers
- Distribution footprint limits last-mile but not supplier risk
Technology and data lock-in
Connected tire solutions, telematics, and proprietary diagnostics create vendor lock-in for Southern Tire Mart by embedding software into fleet workflows; 2024 studies show telematics can cut downtime ~20% and fuel use ~10%, raising perceived switching costs and enabling suppliers to upsell performance services.
- Lock-in: integration into fleet platforms increases switching costs
- Data power: performance access boosts upsell and pricing leverage
- Mitigation: open-API partners and standards reduce lock-in risk
Supplier power: top-5 hold ~60%, enabling 10–20% spikes; dealers hedge with multi-brand buys
Supplier power is high: top 5 tire makers hold ~60% capacity (2024), enabling 10–20% price uplifts during shocks. Specialized inputs (retread casings, TPMS >90% penetration) and brand MAPs lift switching costs; co-op funds can cover up to 50% of marketing, compressing dealer margins ~2–5pp. Southern Tire Mart uses multi-brand sourcing, forward buys and safety stock to mitigate allocation risk.
| Metric | 2024 Value |
|---|---|
| Top-5 market share | ~60% |
| Price uplifts (spikes) | 10–20% |
| TPMS penetration | >90% |
| Co-op funding | Up to 50% |
| Dealer margin impact | 2–5 pp |
What is included in the product
Detailed Word Document
Tailored Porter's Five Forces overview for Southern Tire Mart highlighting competitive rivalry, supplier and buyer bargaining power, threats from substitutes and new entrants, and strategic levers to sustain margins and defend market share.
Customizable Excel Spreadsheet
A clear, one-sheet summary of Southern Tire Mart's Five Forces—ideal for quick decisions and board decks; customize pressure levels, swap in your own data, and integrate into reports without macros or complex code to reflect evolving market dynamics.
Customers Bargaining Power
Large fleets with volume leverage
Large trucking and construction fleets negotiate national or regional contracts with tiered pricing, leveraging scale to drive competitive bids across dealers and brands. Fleets commonly secure rebates in the mid-single to low-double digit range (around 5–12% in 2024) and demand SLAs with uptime guarantees near 99%, squeezing dealer margins. Bundling tires, maintenance and asset tracking raises switching costs and can boost retention by roughly 15–25%.
Price transparency and online comparison
Retail consumers and small fleets increasingly use online marketplaces to compare tires; U.S. tire e-commerce was estimated at about $6–8 billion in 2024, intensifying price transparency. Clear online pricing compresses gross margins on common sizes, often by low single-digit percentage points. Value-added services and fast installation become key differentiators, while financing and extended warranties shift buying decisions away from headline price.
Switching costs are moderate
Alternative dealers operate in most service areas, so switching costs remain moderate for many buyers; national coverage often means multiple options within 50–100 miles. Bespoke service histories, roadside coverage and fleet telematics integrations increase inertia and extend practical switching timelines. Contractual rebates (commonly 2–4% in fleet programs) and performance metrics create economic lock-in, while proactive account management cuts churn risk.
Service quality sensitivity
Buyers weight uptime, roadside response times, and casing management heavily; industry estimates place commercial truck downtime costs at roughly $200–300 per hour, making service lapses immediately material to operating margins in 2024.
Poor service drives contract scrutiny and switching; strong KPIs (uptime > 98%, average roadside response < 60 minutes) justify premium pricing and lock in customers.
Consistent execution across Southern Tire Mart locations is essential to retain bargaining power and prevent buyer consolidation.
- Uptime focus: uptime > 98%
- Response: target < 60 minutes
- Casing management reduces capex and resale loss
Mix shift to lower-cost imports
- Cost-per-mile focus: many buyers shift to value imports
- Premium pressure: premium mix and margins down ~150 bps (2024)
- Countermeasures: lifecycle education and retread programs reposition value vs imports
Fleets secure 5-12% rebates, demand uptime over 98% and sub-60m response
Buyers—especially large fleets—wield strong price and service leverage, securing rebates of 5–12% and demanding uptime >98% and response <60 min. Tire e-commerce (~$6–8B in 2024) raises price transparency; import share ~20% cut premium mix, compressing margins ~150 bps. Downtime cost ~$200–300/hr makes service KPIs critical to retain contracts.
| Metric | 2024 Value |
|---|---|
| Fleet rebates | 5–12% |
| E‑commerce | $6–8B |
| Import share | ~20% |
| Margin compression | ~150 bps |
| Downtime cost | $200–300/hr |
Full Version Awaits
Southern Tire Mart Porter's Five Forces Analysis
This preview shows the exact Southern Tire Mart Porter's Five Forces analysis you'll receive—no surprises or placeholders. The document displayed is fully formatted and ready for download the moment you buy. You're viewing the actual deliverable, ready for immediate use.
Original: $10.00
-65%$10.00
$3.50Description
Elevate Your Analysis with the Complete Porter's Five Forces Analysis
Southern Tire Mart faces moderate buyer power, concentrated supplier channels for commercial tires, and intense rivalry among national and regional players, while barriers to entry are elevated by distribution scale and service networks. This snapshot only scratches the surface. Unlock the full Porter's Five Forces Analysis to explore Southern Tire Mart’s competitive dynamics, market pressures, and strategic advantages in detail.
Suppliers Bargaining Power
Concentrated tire manufacturers
Major tire supply remains concentrated: the top five global manufacturers accounted for roughly 60% of OEM and replacement capacity in 2024, giving suppliers leverage on pricing and allocation. Southern Tire Mart’s multi-brand assortment reduces single-vendor risk but cannot fully eliminate exposure to allocation or price pressure. During demand spikes or supply disruptions, manufacturers have imposed price uplifts of 10–20%, forcing acceptance of higher costs. Long-term volume commitments and contractual rebates are used to secure allocation priority and mitigate cost volatility.
Specialized inputs and retread materials
Retread rubber, casing stocks and TPMS modules come from specialized vendors with few close substitutes, giving suppliers notable leverage over Southern Tire Mart; TPMS has seen >90% penetration in new passenger vehicles, raising OEM dependency. Quality variability directly affects warranty costs and service reputation, increasing supplier influence. Consistent-grade supply requires deep relationships and volume commitments, while dual-sourcing and in-house retread lines mitigate that power.
Brand pull-through and co-op funds
Premium brands drive customer preference, letting suppliers enforce MAP policies and steer SKU mix; co-op funds commonly cover up to 50% of approved marketing spend, aligning dealer promotions with supplier goals.
Tiered incentives and performance rebates link dealer payouts to sales targets, while reliance on brand equity can compress dealer margins by an estimated 2–5 percentage points in exchange for higher traffic.
Negotiating exclusive territories or performance tiers can rebalance economics, shifting marketing support and margin back toward dealers when tied to verifiable sales metrics.
Logistics and lead-time constraints
Logistics and lead-time constraints—freight volatility, import timelines, and regional warehousing—drive fill rates and carrying costs; disruptions or antidumping measures on imported tires in 2024 can quickly shift bargaining power to domestic suppliers with capacity, while Southern Tire Mart’s dense distribution footprint reduces last-mile risk but not upstream volatility.
Forward buys and safety stock are used to buffer shocks, shortening effective lead-time exposure.
- Freight volatility raises carrying costs
- Antidumping shifts power to domestic producers
- Distribution footprint limits last-mile but not supplier risk
Technology and data lock-in
Connected tire solutions, telematics, and proprietary diagnostics create vendor lock-in for Southern Tire Mart by embedding software into fleet workflows; 2024 studies show telematics can cut downtime ~20% and fuel use ~10%, raising perceived switching costs and enabling suppliers to upsell performance services.
- Lock-in: integration into fleet platforms increases switching costs
- Data power: performance access boosts upsell and pricing leverage
- Mitigation: open-API partners and standards reduce lock-in risk
Supplier power: top-5 hold ~60%, enabling 10–20% spikes; dealers hedge with multi-brand buys
Supplier power is high: top 5 tire makers hold ~60% capacity (2024), enabling 10–20% price uplifts during shocks. Specialized inputs (retread casings, TPMS >90% penetration) and brand MAPs lift switching costs; co-op funds can cover up to 50% of marketing, compressing dealer margins ~2–5pp. Southern Tire Mart uses multi-brand sourcing, forward buys and safety stock to mitigate allocation risk.
| Metric | 2024 Value |
|---|---|
| Top-5 market share | ~60% |
| Price uplifts (spikes) | 10–20% |
| TPMS penetration | >90% |
| Co-op funding | Up to 50% |
| Dealer margin impact | 2–5 pp |
What is included in the product
Detailed Word Document
Tailored Porter's Five Forces overview for Southern Tire Mart highlighting competitive rivalry, supplier and buyer bargaining power, threats from substitutes and new entrants, and strategic levers to sustain margins and defend market share.
Customizable Excel Spreadsheet
A clear, one-sheet summary of Southern Tire Mart's Five Forces—ideal for quick decisions and board decks; customize pressure levels, swap in your own data, and integrate into reports without macros or complex code to reflect evolving market dynamics.
Customers Bargaining Power
Large fleets with volume leverage
Large trucking and construction fleets negotiate national or regional contracts with tiered pricing, leveraging scale to drive competitive bids across dealers and brands. Fleets commonly secure rebates in the mid-single to low-double digit range (around 5–12% in 2024) and demand SLAs with uptime guarantees near 99%, squeezing dealer margins. Bundling tires, maintenance and asset tracking raises switching costs and can boost retention by roughly 15–25%.
Price transparency and online comparison
Retail consumers and small fleets increasingly use online marketplaces to compare tires; U.S. tire e-commerce was estimated at about $6–8 billion in 2024, intensifying price transparency. Clear online pricing compresses gross margins on common sizes, often by low single-digit percentage points. Value-added services and fast installation become key differentiators, while financing and extended warranties shift buying decisions away from headline price.
Switching costs are moderate
Alternative dealers operate in most service areas, so switching costs remain moderate for many buyers; national coverage often means multiple options within 50–100 miles. Bespoke service histories, roadside coverage and fleet telematics integrations increase inertia and extend practical switching timelines. Contractual rebates (commonly 2–4% in fleet programs) and performance metrics create economic lock-in, while proactive account management cuts churn risk.
Service quality sensitivity
Buyers weight uptime, roadside response times, and casing management heavily; industry estimates place commercial truck downtime costs at roughly $200–300 per hour, making service lapses immediately material to operating margins in 2024.
Poor service drives contract scrutiny and switching; strong KPIs (uptime > 98%, average roadside response < 60 minutes) justify premium pricing and lock in customers.
Consistent execution across Southern Tire Mart locations is essential to retain bargaining power and prevent buyer consolidation.
- Uptime focus: uptime > 98%
- Response: target < 60 minutes
- Casing management reduces capex and resale loss
Mix shift to lower-cost imports
- Cost-per-mile focus: many buyers shift to value imports
- Premium pressure: premium mix and margins down ~150 bps (2024)
- Countermeasures: lifecycle education and retread programs reposition value vs imports
Fleets secure 5-12% rebates, demand uptime over 98% and sub-60m response
Buyers—especially large fleets—wield strong price and service leverage, securing rebates of 5–12% and demanding uptime >98% and response <60 min. Tire e-commerce (~$6–8B in 2024) raises price transparency; import share ~20% cut premium mix, compressing margins ~150 bps. Downtime cost ~$200–300/hr makes service KPIs critical to retain contracts.
| Metric | 2024 Value |
|---|---|
| Fleet rebates | 5–12% |
| E‑commerce | $6–8B |
| Import share | ~20% |
| Margin compression | ~150 bps |
| Downtime cost | $200–300/hr |
Full Version Awaits
Southern Tire Mart Porter's Five Forces Analysis
This preview shows the exact Southern Tire Mart Porter's Five Forces analysis you'll receive—no surprises or placeholders. The document displayed is fully formatted and ready for download the moment you buy. You're viewing the actual deliverable, ready for immediate use.











