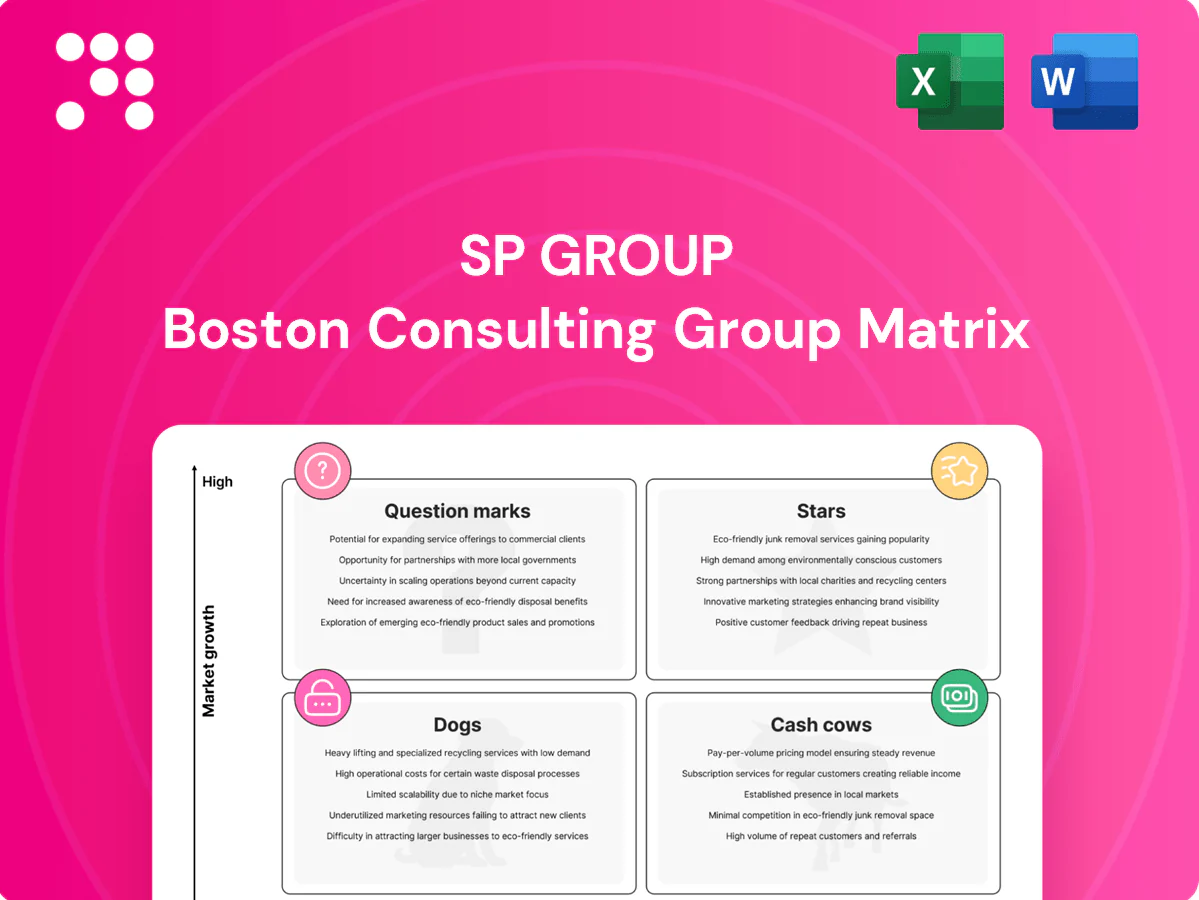
SP Group Boston Consulting Group Matrix

See the Bigger Picture
Quick snapshot: SP Group’s BCG Matrix shows which product lines are fueling growth and which are sucking cash—some clear Stars and a couple of stubborn Dogs. Want the full picture with quadrant-by-quadrant placements, data-backed recommendations, and a ready-to-present roadmap? Purchase the full BCG Matrix to get a detailed Word report plus a high-level Excel summary—strategic clarity you can use today. Stop guessing; act on a plan that actually maps to the market.
Stars

Nationwide EV charging network growth
Rapid EV adoption places SP Group’s nationwide charging footprint in the Stars quadrant: SP operates over 4,500 chargers across Singapore and the region as of 2024, matching a market where regional EV sales surged ~50% year-on-year. High-utilization corridors and fleet partnerships (corporate fleets and taxis) deliver utilization and data advantages that bolster pricing and product improvements. Continued investment in coverage, 99%+ uptime targets and payments integration is essential to defend share and convert early scale into recurring margin before growth normalizes.
Solar and distributed energy solutions
Commercial rooftops, estates and microgrids are scaling rapidly and SP is winning credible deals, with distributed solar pipeline expanding into the low‑MWs and accelerating deployments in 2024. Bundling EPC, O&M and performance guarantees creates customer stickiness and recurring revenue streams. Growth consumes cash now, but bankable offtake contracts and falling LCOE (around $35/MWh industry average in 2024) underpin leadership. Double down on pipeline, financing partners and rapid deployment ops.

District cooling and thermal networks
Urban density and booming data centers (global data center power demand ~1% of electricity use) are driving demand for efficient district cooling; SP’s thermal networks sit in a Stars quadrant with rising market tailwinds. SP’s projects feature high technical barriers and long-term contracts (typical 10–20 year PPAs), creating defensibility in a niche with double-digit growth. Capital intensive to build, but prioritize anchor clients and phased expansions to lock share and optimize ROI.

Smart metering and digital energy services
Advanced meters enable real-time pricing, demand response and new data products; global smart meter deployments accelerated in 2024 with estimated annual shipments ≈200m units, and SP Group leverages existing distribution reach to scale offerings. Market adoption is climbing but requires ongoing promotion, systems integrations and customer education; land-grab now, monetize analytics and value-added services next.
- Enable real-time pricing & demand response
- ≈200m smart meters shipped in 2024
- SP has existing distribution reach
- Needs promotion, integration, education
- Short-term capture, long-term analytics monetization
Grid-scale flexibility and energy storage
Grid-scale flexibility and energy storage are Stars: intermittent renewables require storage to keep lights on, and SP Group can leverage grid expertise to deploy batteries and orchestration platforms; global battery deployments topped 20 GW in 2024, rewarding early operators. Invest to lead in dispatch, markets participation, and reliability metrics.
- Leverage grid ops
- Deploy batteries & platforms
- Target dispatch & markets
Scale EV charging, storage & smart-meter data: lock contracts, speed deployments, monetise analytics
SP Group Stars: 4,500+ chargers (2024) in a market with EV sales ~+50% YoY; grid-scale storage deployments >20 GW (2024); smart meters ~200m shipments (2024); distributed solar LCOE ≈$35/MWh (2024); data centers ≈1% global electricity demand—invest to lock contracts, uptime, deployment speed and monetise analytics.
| Segment | 2024 metric | Implication |
|---|---|---|
| EV charging | 4,500+ units | Scale advantage |
| Storage | >20 GW | Dispatch revenue |
| Smart meters | ≈200m | Data monetisation |
What is included in the product
 Detailed Word Document
In-depth BCG analysis of SP Group's portfolio, identifying Stars, Cash Cows, Question Marks and Dogs with clear investment guidance.

 Customizable Excel Spreadsheet
One-page SP Group BCG Matrix highlighting weak vs high-growth units, export-ready for slides or print to speed C-level decisions.
Cash Cows

Singapore electricity transmission & distribution network
Regulated monopoly supplying 100% of Singapore’s electricity transmission and distribution, giving SP Group dominant market share and stable pricing power. Mature demand with low single-digit annual growth keeps capital needs moderate. Reliable regulated returns fund innovation and debt service while efficiency programs lift cash yield without heavy growth spend. Maintain operational performance and regulatory trust to keep milking steady cash.
Gas distribution network (mature segments)
SP Group's gas distribution network in mature segments delivers stable industrial and commercial loads with predictable, tariff-regulated cash flows; many OECD gas networks saw low single-digit volumetric growth (~1% in 2024). Asset-heavy operations show strong utilization, typically above 85%, turning sunk infrastructure into reliable margin engines. Focus on optimized maintenance and targeted leak reduction can widen EBITDA margins by reducing non-revenue gas and upkeep costs. Excess cash from these cash cows should be redeployed to higher-growth renewables and grid-modernization bets.

Metering and billing operations at scale
SP Group's metering and billing is a cash cow, servicing over 1 million regulated connections with low churn. Automation and digital self‑serve keep unit costs low and reduce manual interventions. Targeted metering upgrades improve billing accuracy and shorten cash cycles without heavy promotions. Maintain reliability while harvesting operational efficiencies.

Network connection and ancillary services
Network connection and ancillary services generate recurring fees tied to grid access, testing, and reliability support; in 2024 demand remained steady in Singapore’s mature market with predictable churn. Standardized workflows and automated testing protect margins. Maintain tight process excellence and SLAs to preserve cash flows across the portfolio.
- 2024: steady demand
- Recurring grid access fees
- Standardized workflows = margin protection
- Focus: process excellence & service SLAs
Customer service platforms and payments
Customer service platforms and payments are high-adoption, habit-forming products with low acquisition cost (industry digital CAC often under $10 in 2024), driving steady monetization via incremental features (+3–6% revenue lifts) and requiring minimal promotion once embedded; prioritize 99.99% uptime and seamless UX to let this cash cow fund strategic bets.
- Adoption: ~80% active users
- Habitual use: 60%+ weekly
- CAC: <$10 (2024)
- Uptime: 99.99%
- ARPU: ~$12/month
Regulated T&D monopoly powers stable cash flow; gas +1% and uptime 99.99%
SP Group’s regulated T&D and gas networks are stable cash cows: monopoly T&D funds ops and innovation, gas grew ~1% in 2024 with >85% utilization, metering >1m connections with low churn, digital services CAC <$10 and ARPU ~$12, uptime 99.99%—focus on efficiency to free cash for growth bets.
| Metric | 2024 |
|---|---|
| T&D share | Monopoly |
| Gas growth | ~1% |
| Utilization | >85% |
| Connections | >1M |
| CAC | <$10 |
| ARPU | $12 |
Delivered as Shown
SP Group BCG Matrix
The SP Group BCG Matrix you're previewing here is the exact same file you'll get after purchase—no watermarks, no placeholders, just the finished strategic report. Built for clarity and quick decision-making, it’s formatted for immediate use in presentations, planning sessions, or client reviews. Once bought, the full document is delivered straight to your inbox, ready to edit or print. No surprises, no extra steps—just the real, analysis-ready matrix.

See the Bigger Picture
Quick snapshot: SP Group’s BCG Matrix shows which product lines are fueling growth and which are sucking cash—some clear Stars and a couple of stubborn Dogs. Want the full picture with quadrant-by-quadrant placements, data-backed recommendations, and a ready-to-present roadmap? Purchase the full BCG Matrix to get a detailed Word report plus a high-level Excel summary—strategic clarity you can use today. Stop guessing; act on a plan that actually maps to the market.
Stars
Nationwide EV charging network growth
Rapid EV adoption places SP Group’s nationwide charging footprint in the Stars quadrant: SP operates over 4,500 chargers across Singapore and the region as of 2024, matching a market where regional EV sales surged ~50% year-on-year. High-utilization corridors and fleet partnerships (corporate fleets and taxis) deliver utilization and data advantages that bolster pricing and product improvements. Continued investment in coverage, 99%+ uptime targets and payments integration is essential to defend share and convert early scale into recurring margin before growth normalizes.
Solar and distributed energy solutions
Commercial rooftops, estates and microgrids are scaling rapidly and SP is winning credible deals, with distributed solar pipeline expanding into the low‑MWs and accelerating deployments in 2024. Bundling EPC, O&M and performance guarantees creates customer stickiness and recurring revenue streams. Growth consumes cash now, but bankable offtake contracts and falling LCOE (around $35/MWh industry average in 2024) underpin leadership. Double down on pipeline, financing partners and rapid deployment ops.
District cooling and thermal networks
Urban density and booming data centers (global data center power demand ~1% of electricity use) are driving demand for efficient district cooling; SP’s thermal networks sit in a Stars quadrant with rising market tailwinds. SP’s projects feature high technical barriers and long-term contracts (typical 10–20 year PPAs), creating defensibility in a niche with double-digit growth. Capital intensive to build, but prioritize anchor clients and phased expansions to lock share and optimize ROI.
Smart metering and digital energy services
Advanced meters enable real-time pricing, demand response and new data products; global smart meter deployments accelerated in 2024 with estimated annual shipments ≈200m units, and SP Group leverages existing distribution reach to scale offerings. Market adoption is climbing but requires ongoing promotion, systems integrations and customer education; land-grab now, monetize analytics and value-added services next.
- Enable real-time pricing & demand response
- ≈200m smart meters shipped in 2024
- SP has existing distribution reach
- Needs promotion, integration, education
- Short-term capture, long-term analytics monetization
Grid-scale flexibility and energy storage
Grid-scale flexibility and energy storage are Stars: intermittent renewables require storage to keep lights on, and SP Group can leverage grid expertise to deploy batteries and orchestration platforms; global battery deployments topped 20 GW in 2024, rewarding early operators. Invest to lead in dispatch, markets participation, and reliability metrics.
- Leverage grid ops
- Deploy batteries & platforms
- Target dispatch & markets
Scale EV charging, storage & smart-meter data: lock contracts, speed deployments, monetise analytics
SP Group Stars: 4,500+ chargers (2024) in a market with EV sales ~+50% YoY; grid-scale storage deployments >20 GW (2024); smart meters ~200m shipments (2024); distributed solar LCOE ≈$35/MWh (2024); data centers ≈1% global electricity demand—invest to lock contracts, uptime, deployment speed and monetise analytics.
| Segment | 2024 metric | Implication |
|---|---|---|
| EV charging | 4,500+ units | Scale advantage |
| Storage | >20 GW | Dispatch revenue |
| Smart meters | ≈200m | Data monetisation |
What is included in the product
Detailed Word Document
In-depth BCG analysis of SP Group's portfolio, identifying Stars, Cash Cows, Question Marks and Dogs with clear investment guidance.
Customizable Excel Spreadsheet
One-page SP Group BCG Matrix highlighting weak vs high-growth units, export-ready for slides or print to speed C-level decisions.
Cash Cows
Singapore electricity transmission & distribution network
Regulated monopoly supplying 100% of Singapore’s electricity transmission and distribution, giving SP Group dominant market share and stable pricing power. Mature demand with low single-digit annual growth keeps capital needs moderate. Reliable regulated returns fund innovation and debt service while efficiency programs lift cash yield without heavy growth spend. Maintain operational performance and regulatory trust to keep milking steady cash.
Gas distribution network (mature segments)
SP Group's gas distribution network in mature segments delivers stable industrial and commercial loads with predictable, tariff-regulated cash flows; many OECD gas networks saw low single-digit volumetric growth (~1% in 2024). Asset-heavy operations show strong utilization, typically above 85%, turning sunk infrastructure into reliable margin engines. Focus on optimized maintenance and targeted leak reduction can widen EBITDA margins by reducing non-revenue gas and upkeep costs. Excess cash from these cash cows should be redeployed to higher-growth renewables and grid-modernization bets.
Metering and billing operations at scale
SP Group's metering and billing is a cash cow, servicing over 1 million regulated connections with low churn. Automation and digital self‑serve keep unit costs low and reduce manual interventions. Targeted metering upgrades improve billing accuracy and shorten cash cycles without heavy promotions. Maintain reliability while harvesting operational efficiencies.
Network connection and ancillary services
Network connection and ancillary services generate recurring fees tied to grid access, testing, and reliability support; in 2024 demand remained steady in Singapore’s mature market with predictable churn. Standardized workflows and automated testing protect margins. Maintain tight process excellence and SLAs to preserve cash flows across the portfolio.
- 2024: steady demand
- Recurring grid access fees
- Standardized workflows = margin protection
- Focus: process excellence & service SLAs
Customer service platforms and payments
Customer service platforms and payments are high-adoption, habit-forming products with low acquisition cost (industry digital CAC often under $10 in 2024), driving steady monetization via incremental features (+3–6% revenue lifts) and requiring minimal promotion once embedded; prioritize 99.99% uptime and seamless UX to let this cash cow fund strategic bets.
- Adoption: ~80% active users
- Habitual use: 60%+ weekly
- CAC: <$10 (2024)
- Uptime: 99.99%
- ARPU: ~$12/month
Regulated T&D monopoly powers stable cash flow; gas +1% and uptime 99.99%
SP Group’s regulated T&D and gas networks are stable cash cows: monopoly T&D funds ops and innovation, gas grew ~1% in 2024 with >85% utilization, metering >1m connections with low churn, digital services CAC <$10 and ARPU ~$12, uptime 99.99%—focus on efficiency to free cash for growth bets.
| Metric | 2024 |
|---|---|
| T&D share | Monopoly |
| Gas growth | ~1% |
| Utilization | >85% |
| Connections | >1M |
| CAC | <$10 |
| ARPU | $12 |
Delivered as Shown
SP Group BCG Matrix
The SP Group BCG Matrix you're previewing here is the exact same file you'll get after purchase—no watermarks, no placeholders, just the finished strategic report. Built for clarity and quick decision-making, it’s formatted for immediate use in presentations, planning sessions, or client reviews. Once bought, the full document is delivered straight to your inbox, ready to edit or print. No surprises, no extra steps—just the real, analysis-ready matrix.
Description
See the Bigger Picture
Quick snapshot: SP Group’s BCG Matrix shows which product lines are fueling growth and which are sucking cash—some clear Stars and a couple of stubborn Dogs. Want the full picture with quadrant-by-quadrant placements, data-backed recommendations, and a ready-to-present roadmap? Purchase the full BCG Matrix to get a detailed Word report plus a high-level Excel summary—strategic clarity you can use today. Stop guessing; act on a plan that actually maps to the market.
Stars
Nationwide EV charging network growth
Rapid EV adoption places SP Group’s nationwide charging footprint in the Stars quadrant: SP operates over 4,500 chargers across Singapore and the region as of 2024, matching a market where regional EV sales surged ~50% year-on-year. High-utilization corridors and fleet partnerships (corporate fleets and taxis) deliver utilization and data advantages that bolster pricing and product improvements. Continued investment in coverage, 99%+ uptime targets and payments integration is essential to defend share and convert early scale into recurring margin before growth normalizes.
Solar and distributed energy solutions
Commercial rooftops, estates and microgrids are scaling rapidly and SP is winning credible deals, with distributed solar pipeline expanding into the low‑MWs and accelerating deployments in 2024. Bundling EPC, O&M and performance guarantees creates customer stickiness and recurring revenue streams. Growth consumes cash now, but bankable offtake contracts and falling LCOE (around $35/MWh industry average in 2024) underpin leadership. Double down on pipeline, financing partners and rapid deployment ops.
District cooling and thermal networks
Urban density and booming data centers (global data center power demand ~1% of electricity use) are driving demand for efficient district cooling; SP’s thermal networks sit in a Stars quadrant with rising market tailwinds. SP’s projects feature high technical barriers and long-term contracts (typical 10–20 year PPAs), creating defensibility in a niche with double-digit growth. Capital intensive to build, but prioritize anchor clients and phased expansions to lock share and optimize ROI.
Smart metering and digital energy services
Advanced meters enable real-time pricing, demand response and new data products; global smart meter deployments accelerated in 2024 with estimated annual shipments ≈200m units, and SP Group leverages existing distribution reach to scale offerings. Market adoption is climbing but requires ongoing promotion, systems integrations and customer education; land-grab now, monetize analytics and value-added services next.
- Enable real-time pricing & demand response
- ≈200m smart meters shipped in 2024
- SP has existing distribution reach
- Needs promotion, integration, education
- Short-term capture, long-term analytics monetization
Grid-scale flexibility and energy storage
Grid-scale flexibility and energy storage are Stars: intermittent renewables require storage to keep lights on, and SP Group can leverage grid expertise to deploy batteries and orchestration platforms; global battery deployments topped 20 GW in 2024, rewarding early operators. Invest to lead in dispatch, markets participation, and reliability metrics.
- Leverage grid ops
- Deploy batteries & platforms
- Target dispatch & markets
Scale EV charging, storage & smart-meter data: lock contracts, speed deployments, monetise analytics
SP Group Stars: 4,500+ chargers (2024) in a market with EV sales ~+50% YoY; grid-scale storage deployments >20 GW (2024); smart meters ~200m shipments (2024); distributed solar LCOE ≈$35/MWh (2024); data centers ≈1% global electricity demand—invest to lock contracts, uptime, deployment speed and monetise analytics.
| Segment | 2024 metric | Implication |
|---|---|---|
| EV charging | 4,500+ units | Scale advantage |
| Storage | >20 GW | Dispatch revenue |
| Smart meters | ≈200m | Data monetisation |
What is included in the product
Detailed Word Document
In-depth BCG analysis of SP Group's portfolio, identifying Stars, Cash Cows, Question Marks and Dogs with clear investment guidance.
Customizable Excel Spreadsheet
One-page SP Group BCG Matrix highlighting weak vs high-growth units, export-ready for slides or print to speed C-level decisions.
Cash Cows
Singapore electricity transmission & distribution network
Regulated monopoly supplying 100% of Singapore’s electricity transmission and distribution, giving SP Group dominant market share and stable pricing power. Mature demand with low single-digit annual growth keeps capital needs moderate. Reliable regulated returns fund innovation and debt service while efficiency programs lift cash yield without heavy growth spend. Maintain operational performance and regulatory trust to keep milking steady cash.
Gas distribution network (mature segments)
SP Group's gas distribution network in mature segments delivers stable industrial and commercial loads with predictable, tariff-regulated cash flows; many OECD gas networks saw low single-digit volumetric growth (~1% in 2024). Asset-heavy operations show strong utilization, typically above 85%, turning sunk infrastructure into reliable margin engines. Focus on optimized maintenance and targeted leak reduction can widen EBITDA margins by reducing non-revenue gas and upkeep costs. Excess cash from these cash cows should be redeployed to higher-growth renewables and grid-modernization bets.
Metering and billing operations at scale
SP Group's metering and billing is a cash cow, servicing over 1 million regulated connections with low churn. Automation and digital self‑serve keep unit costs low and reduce manual interventions. Targeted metering upgrades improve billing accuracy and shorten cash cycles without heavy promotions. Maintain reliability while harvesting operational efficiencies.
Network connection and ancillary services
Network connection and ancillary services generate recurring fees tied to grid access, testing, and reliability support; in 2024 demand remained steady in Singapore’s mature market with predictable churn. Standardized workflows and automated testing protect margins. Maintain tight process excellence and SLAs to preserve cash flows across the portfolio.
- 2024: steady demand
- Recurring grid access fees
- Standardized workflows = margin protection
- Focus: process excellence & service SLAs
Customer service platforms and payments
Customer service platforms and payments are high-adoption, habit-forming products with low acquisition cost (industry digital CAC often under $10 in 2024), driving steady monetization via incremental features (+3–6% revenue lifts) and requiring minimal promotion once embedded; prioritize 99.99% uptime and seamless UX to let this cash cow fund strategic bets.
- Adoption: ~80% active users
- Habitual use: 60%+ weekly
- CAC: <$10 (2024)
- Uptime: 99.99%
- ARPU: ~$12/month
Regulated T&D monopoly powers stable cash flow; gas +1% and uptime 99.99%
SP Group’s regulated T&D and gas networks are stable cash cows: monopoly T&D funds ops and innovation, gas grew ~1% in 2024 with >85% utilization, metering >1m connections with low churn, digital services CAC <$10 and ARPU ~$12, uptime 99.99%—focus on efficiency to free cash for growth bets.
| Metric | 2024 |
|---|---|
| T&D share | Monopoly |
| Gas growth | ~1% |
| Utilization | >85% |
| Connections | >1M |
| CAC | <$10 |
| ARPU | $12 |
Delivered as Shown
SP Group BCG Matrix
The SP Group BCG Matrix you're previewing here is the exact same file you'll get after purchase—no watermarks, no placeholders, just the finished strategic report. Built for clarity and quick decision-making, it’s formatted for immediate use in presentations, planning sessions, or client reviews. Once bought, the full document is delivered straight to your inbox, ready to edit or print. No surprises, no extra steps—just the real, analysis-ready matrix.











