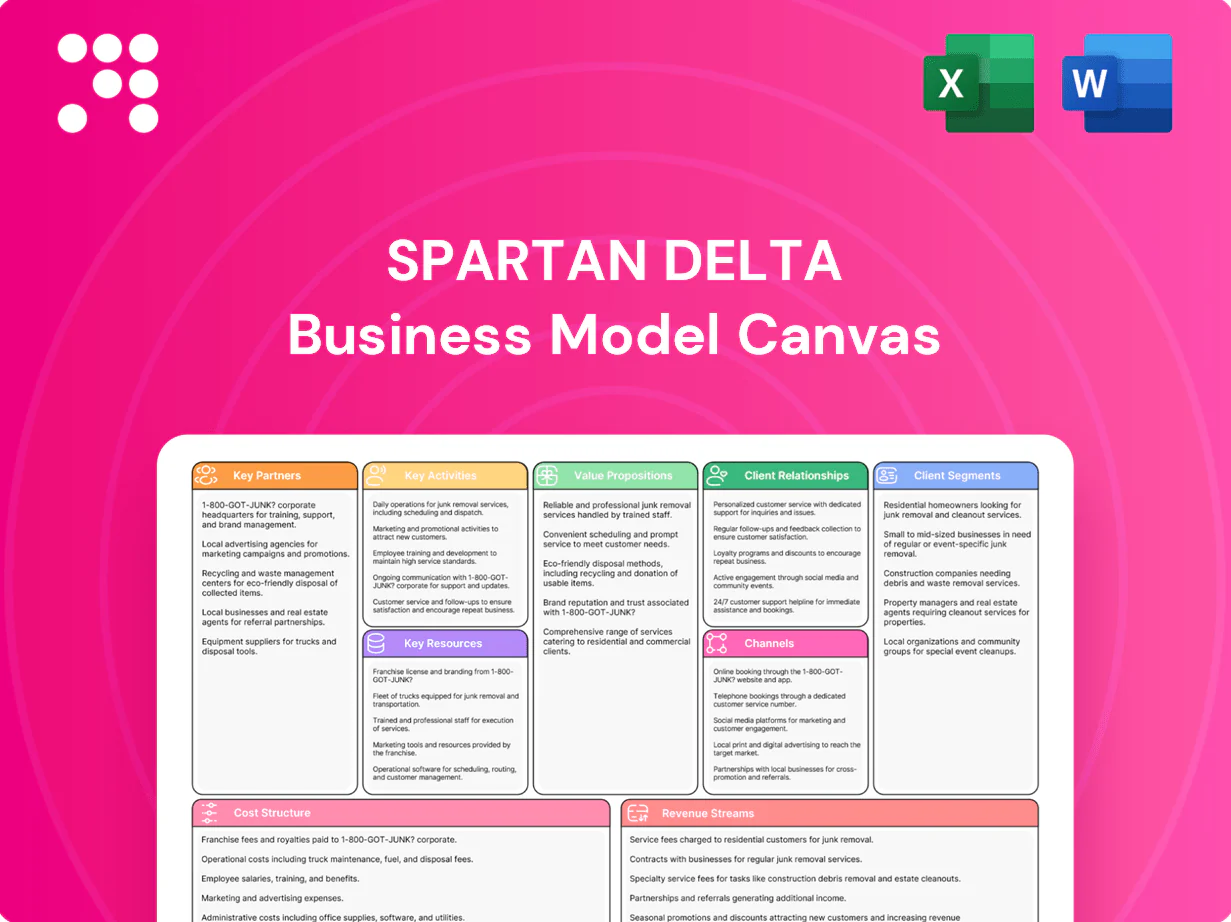
Spartan Delta Business Model Canvas

Unlock strategic DNA: concise Business Model Canvas for investors and founders
Unlock Spartan Delta’s strategic DNA with our concise Business Model Canvas summary that maps value creation, customer segments, and revenue levers. This three-part snapshot highlights competitive advantages and growth pathways for investors and founders. Purchase the full, editable Canvas to access all nine building blocks, financial implications, and practical playbooks for execution.
Partnerships

Midstream pipeline and processing operators
Access to gas plants, pipelines and fractionation is essential to move and monetize Spartan Delta production; in 2024 securing contracted capacity and firm processing agreements ensured takeaway and market access. Spartan negotiated firm service and processing contracts to reduce bottlenecks and shrink basis differentials, which tightened in 2024. Higher third‑party facility reliability—industry uptime >95% in 2024—directly boosts realized pricing and free funds flow.
Drilling, completions, and field service providers
Aligned drilling, completions, and field service partners across rigs, pressure‑pumping, sand, and water logistics create scale and repeatability for Spartan Delta, enabling multi‑well pad programs and schedule certainty that secure improved commercial rates. Consistent vendor performance lowers cost per BOE and de‑risks execution across campaigns. Vendor safety and ESG metrics reinforce Spartan’s stewardship commitments in operations.

Landowners, Indigenous nations, and community stakeholders
Surface access, rights-of-way, and social license hinge on trust-based relationships with landowners, Indigenous nations, and stakeholders; industry studies show early consultations can cut permitting delays by up to 60%. Benefit agreements—often exceeding CAD 1m annually for regional partners—reduce litigation risk and schedule slippage. Transparent engagement aligns expectations on environmental impacts and reclamation costs. Strong community ties underpin long-term asset value and project continuity.

Financial institutions and capital markets
Technology and ESG solution partners
Firm midstream, 95%+ uptime and ESG-backed capital drive better pricing and lower cost/BOE
Firm midstream contracts and 95%+ industry uptime in 2024 secured takeaway and improved realized pricing.
Aligned drilling, completions and logistics partners enabled multi‑well pads, lowering cost/BOE and improving schedule certainty.
Community agreements (often >CAD1m/yr), hedges and ESG tech (methane detection, water recycling) supported capital access as green bonds topped $600B in 2024.
| Metric | 2024 |
|---|---|
| Midstream uptime | >95% |
| Green bond market | $600B |
| Community payments | >CAD1m/yr |
What is included in the product
 Detailed Word Document
A comprehensive, pre-written Spartan Delta Business Model Canvas tailored to the company’s strategy, organized into the nine classic BMC blocks with full narratives, insights and linked SWOT analysis. Ideal for investor presentations, funding discussions and validation of business ideas with clear competitive advantages and polished design.

 Customizable Excel Spreadsheet
Spartan Delta Business Model Canvas relieves strategic planning pain by condensing your company’s model into a clean, editable one-page snapshot for fast alignment, collaboration, and decision-making.
Activities

Resource delineation and appraisal
Geoscience mapping, petrophysics and 12 pilot wells defined inventory quality; type-curve validation guided capital allocation by confirming IP30 ~1,200 boe/d and EUR ~600 mboe. Continuous data gathering refined landing zones and completion designs, cutting cycle time ~20%. That underpinned repeatable, low-cost development with well costs near $4.5M (2024).
Horizontal drilling and multi‑stage completions
Factory-style pad development cut drilling-to-frac cycle times by about 25% and lowered per-well unit costs roughly 20%, enabling higher throughput per rig. Optimization of lateral length (commonly 8,000–10,000 ft), proppant loading and cluster spacing drove EUR gains in the mid-teens percentage range. Streamlined water and sand logistics raised operational reliability toward 95% uptime while disciplined execution preserved sub-$10,000 per flowing boe-day capital intensity.

Production operations and optimization
Production operations and optimization in 2024 leveraged artificial lift, compression, and facility tuning to sustain rates and lower lease operating expenses through targeted uptime strategies. Real-time monitoring minimized downtime and emissions by enabling immediate intervention and predictive maintenance. Integrated water handling and gas gathering reduced flaring and venting, capturing more sales gas. Continuous improvement efforts focused on margin expansion via cost per BOE and uptime KPIs.

Acquisitions, divestitures, and portfolio management
Strategic M&A added inventory depth and captured infrastructure synergies across midstream and processing, while non-core divestments recycled capital into higher-return projects and improved working capital in 2024. Hedging and marketing were synchronized with development cadence to stabilize cash flow and support disciplined reinvestment. The 2024 spin-outs optimized asset focus and enhanced stakeholder outcomes through clearer capital allocation and governance.
- Inventory depth via M&A
- Capital recycling from divestments
- Hedging aligned to development
- 2024 spin-outs sharpened focus
ESG compliance and asset retirement
Regulatory reporting and continuous environmental monitoring ensured compliance with evolving 2024 standards while feeding transparent KPIs to stakeholders. Methane mitigation programs and targeted electrification projects materially reduced emissions intensity and operational CH4 leaks. Systematic abandonment and reclamation protocols addressed long-term liabilities and costed asset retirement obligations. Transparent disclosure bolstered investor trust through verified third-party audits.
- Regulatory reporting: 2024-aligned disclosures
- Methane & electrification: reduced emissions intensity
- Abandonment & reclamation: managed long-term liabilities
- Transparent disclosure: third-party verification for investors
IP30 ~1,200 boe/d, EUR ~600 mboe; sub-$4.5M wells, 25% faster pads
Geoscience, pilots and type-curves validated IP30 ~1,200 boe/d and EUR ~600 mboe, guiding sub-$4.5M well costs (2024).
Factory-style pads cut cycle time ~25% and per-well cost ~20%, supporting ~95% operational uptime.
Ops optimization, artificial lift and integrated water/gas capture lowered LOE and preserved sub-$10,000/flowing BOE-day capital intensity.
M&A, divestments and hedging stabilized cash flow and recycled capital into higher-return inventory (2024).
| Metric | 2024 |
|---|---|
| IP30 | ~1,200 boe/d |
| EUR | ~600 mboe |
| Well cost | $4.5M |
| Cycle time ↓ | ~25% |
| Per-well cost ↓ | ~20% |
| Uptime | ~95% |
| Cap intensity | <$10,000/flowing BOE-day |
Delivered as Displayed
Business Model Canvas
The document you're previewing is the exact Spartan Delta Business Model Canvas you'll receive after purchase. It's not a mockup—this live preview shows the final, fully editable file formatted for immediate use. After payment you'll get the same complete document in Word and Excel.

Unlock strategic DNA: concise Business Model Canvas for investors and founders
Unlock Spartan Delta’s strategic DNA with our concise Business Model Canvas summary that maps value creation, customer segments, and revenue levers. This three-part snapshot highlights competitive advantages and growth pathways for investors and founders. Purchase the full, editable Canvas to access all nine building blocks, financial implications, and practical playbooks for execution.
Partnerships
Midstream pipeline and processing operators
Access to gas plants, pipelines and fractionation is essential to move and monetize Spartan Delta production; in 2024 securing contracted capacity and firm processing agreements ensured takeaway and market access. Spartan negotiated firm service and processing contracts to reduce bottlenecks and shrink basis differentials, which tightened in 2024. Higher third‑party facility reliability—industry uptime >95% in 2024—directly boosts realized pricing and free funds flow.
Drilling, completions, and field service providers
Aligned drilling, completions, and field service partners across rigs, pressure‑pumping, sand, and water logistics create scale and repeatability for Spartan Delta, enabling multi‑well pad programs and schedule certainty that secure improved commercial rates. Consistent vendor performance lowers cost per BOE and de‑risks execution across campaigns. Vendor safety and ESG metrics reinforce Spartan’s stewardship commitments in operations.
Landowners, Indigenous nations, and community stakeholders
Surface access, rights-of-way, and social license hinge on trust-based relationships with landowners, Indigenous nations, and stakeholders; industry studies show early consultations can cut permitting delays by up to 60%. Benefit agreements—often exceeding CAD 1m annually for regional partners—reduce litigation risk and schedule slippage. Transparent engagement aligns expectations on environmental impacts and reclamation costs. Strong community ties underpin long-term asset value and project continuity.
Financial institutions and capital markets
Technology and ESG solution partners
Firm midstream, 95%+ uptime and ESG-backed capital drive better pricing and lower cost/BOE
Firm midstream contracts and 95%+ industry uptime in 2024 secured takeaway and improved realized pricing.
Aligned drilling, completions and logistics partners enabled multi‑well pads, lowering cost/BOE and improving schedule certainty.
Community agreements (often >CAD1m/yr), hedges and ESG tech (methane detection, water recycling) supported capital access as green bonds topped $600B in 2024.
| Metric | 2024 |
|---|---|
| Midstream uptime | >95% |
| Green bond market | $600B |
| Community payments | >CAD1m/yr |
What is included in the product
Detailed Word Document
A comprehensive, pre-written Spartan Delta Business Model Canvas tailored to the company’s strategy, organized into the nine classic BMC blocks with full narratives, insights and linked SWOT analysis. Ideal for investor presentations, funding discussions and validation of business ideas with clear competitive advantages and polished design.
Customizable Excel Spreadsheet
Spartan Delta Business Model Canvas relieves strategic planning pain by condensing your company’s model into a clean, editable one-page snapshot for fast alignment, collaboration, and decision-making.
Activities
Resource delineation and appraisal
Geoscience mapping, petrophysics and 12 pilot wells defined inventory quality; type-curve validation guided capital allocation by confirming IP30 ~1,200 boe/d and EUR ~600 mboe. Continuous data gathering refined landing zones and completion designs, cutting cycle time ~20%. That underpinned repeatable, low-cost development with well costs near $4.5M (2024).
Horizontal drilling and multi‑stage completions
Factory-style pad development cut drilling-to-frac cycle times by about 25% and lowered per-well unit costs roughly 20%, enabling higher throughput per rig. Optimization of lateral length (commonly 8,000–10,000 ft), proppant loading and cluster spacing drove EUR gains in the mid-teens percentage range. Streamlined water and sand logistics raised operational reliability toward 95% uptime while disciplined execution preserved sub-$10,000 per flowing boe-day capital intensity.
Production operations and optimization
Production operations and optimization in 2024 leveraged artificial lift, compression, and facility tuning to sustain rates and lower lease operating expenses through targeted uptime strategies. Real-time monitoring minimized downtime and emissions by enabling immediate intervention and predictive maintenance. Integrated water handling and gas gathering reduced flaring and venting, capturing more sales gas. Continuous improvement efforts focused on margin expansion via cost per BOE and uptime KPIs.
Acquisitions, divestitures, and portfolio management
Strategic M&A added inventory depth and captured infrastructure synergies across midstream and processing, while non-core divestments recycled capital into higher-return projects and improved working capital in 2024. Hedging and marketing were synchronized with development cadence to stabilize cash flow and support disciplined reinvestment. The 2024 spin-outs optimized asset focus and enhanced stakeholder outcomes through clearer capital allocation and governance.
- Inventory depth via M&A
- Capital recycling from divestments
- Hedging aligned to development
- 2024 spin-outs sharpened focus
ESG compliance and asset retirement
Regulatory reporting and continuous environmental monitoring ensured compliance with evolving 2024 standards while feeding transparent KPIs to stakeholders. Methane mitigation programs and targeted electrification projects materially reduced emissions intensity and operational CH4 leaks. Systematic abandonment and reclamation protocols addressed long-term liabilities and costed asset retirement obligations. Transparent disclosure bolstered investor trust through verified third-party audits.
- Regulatory reporting: 2024-aligned disclosures
- Methane & electrification: reduced emissions intensity
- Abandonment & reclamation: managed long-term liabilities
- Transparent disclosure: third-party verification for investors
IP30 ~1,200 boe/d, EUR ~600 mboe; sub-$4.5M wells, 25% faster pads
Geoscience, pilots and type-curves validated IP30 ~1,200 boe/d and EUR ~600 mboe, guiding sub-$4.5M well costs (2024).
Factory-style pads cut cycle time ~25% and per-well cost ~20%, supporting ~95% operational uptime.
Ops optimization, artificial lift and integrated water/gas capture lowered LOE and preserved sub-$10,000/flowing BOE-day capital intensity.
M&A, divestments and hedging stabilized cash flow and recycled capital into higher-return inventory (2024).
| Metric | 2024 |
|---|---|
| IP30 | ~1,200 boe/d |
| EUR | ~600 mboe |
| Well cost | $4.5M |
| Cycle time ↓ | ~25% |
| Per-well cost ↓ | ~20% |
| Uptime | ~95% |
| Cap intensity | <$10,000/flowing BOE-day |
Delivered as Displayed
Business Model Canvas
The document you're previewing is the exact Spartan Delta Business Model Canvas you'll receive after purchase. It's not a mockup—this live preview shows the final, fully editable file formatted for immediate use. After payment you'll get the same complete document in Word and Excel.
Description
Unlock strategic DNA: concise Business Model Canvas for investors and founders
Unlock Spartan Delta’s strategic DNA with our concise Business Model Canvas summary that maps value creation, customer segments, and revenue levers. This three-part snapshot highlights competitive advantages and growth pathways for investors and founders. Purchase the full, editable Canvas to access all nine building blocks, financial implications, and practical playbooks for execution.
Partnerships
Midstream pipeline and processing operators
Access to gas plants, pipelines and fractionation is essential to move and monetize Spartan Delta production; in 2024 securing contracted capacity and firm processing agreements ensured takeaway and market access. Spartan negotiated firm service and processing contracts to reduce bottlenecks and shrink basis differentials, which tightened in 2024. Higher third‑party facility reliability—industry uptime >95% in 2024—directly boosts realized pricing and free funds flow.
Drilling, completions, and field service providers
Aligned drilling, completions, and field service partners across rigs, pressure‑pumping, sand, and water logistics create scale and repeatability for Spartan Delta, enabling multi‑well pad programs and schedule certainty that secure improved commercial rates. Consistent vendor performance lowers cost per BOE and de‑risks execution across campaigns. Vendor safety and ESG metrics reinforce Spartan’s stewardship commitments in operations.
Landowners, Indigenous nations, and community stakeholders
Surface access, rights-of-way, and social license hinge on trust-based relationships with landowners, Indigenous nations, and stakeholders; industry studies show early consultations can cut permitting delays by up to 60%. Benefit agreements—often exceeding CAD 1m annually for regional partners—reduce litigation risk and schedule slippage. Transparent engagement aligns expectations on environmental impacts and reclamation costs. Strong community ties underpin long-term asset value and project continuity.
Financial institutions and capital markets
Technology and ESG solution partners
Firm midstream, 95%+ uptime and ESG-backed capital drive better pricing and lower cost/BOE
Firm midstream contracts and 95%+ industry uptime in 2024 secured takeaway and improved realized pricing.
Aligned drilling, completions and logistics partners enabled multi‑well pads, lowering cost/BOE and improving schedule certainty.
Community agreements (often >CAD1m/yr), hedges and ESG tech (methane detection, water recycling) supported capital access as green bonds topped $600B in 2024.
| Metric | 2024 |
|---|---|
| Midstream uptime | >95% |
| Green bond market | $600B |
| Community payments | >CAD1m/yr |
What is included in the product
Detailed Word Document
A comprehensive, pre-written Spartan Delta Business Model Canvas tailored to the company’s strategy, organized into the nine classic BMC blocks with full narratives, insights and linked SWOT analysis. Ideal for investor presentations, funding discussions and validation of business ideas with clear competitive advantages and polished design.
Customizable Excel Spreadsheet
Spartan Delta Business Model Canvas relieves strategic planning pain by condensing your company’s model into a clean, editable one-page snapshot for fast alignment, collaboration, and decision-making.
Activities
Resource delineation and appraisal
Geoscience mapping, petrophysics and 12 pilot wells defined inventory quality; type-curve validation guided capital allocation by confirming IP30 ~1,200 boe/d and EUR ~600 mboe. Continuous data gathering refined landing zones and completion designs, cutting cycle time ~20%. That underpinned repeatable, low-cost development with well costs near $4.5M (2024).
Horizontal drilling and multi‑stage completions
Factory-style pad development cut drilling-to-frac cycle times by about 25% and lowered per-well unit costs roughly 20%, enabling higher throughput per rig. Optimization of lateral length (commonly 8,000–10,000 ft), proppant loading and cluster spacing drove EUR gains in the mid-teens percentage range. Streamlined water and sand logistics raised operational reliability toward 95% uptime while disciplined execution preserved sub-$10,000 per flowing boe-day capital intensity.
Production operations and optimization
Production operations and optimization in 2024 leveraged artificial lift, compression, and facility tuning to sustain rates and lower lease operating expenses through targeted uptime strategies. Real-time monitoring minimized downtime and emissions by enabling immediate intervention and predictive maintenance. Integrated water handling and gas gathering reduced flaring and venting, capturing more sales gas. Continuous improvement efforts focused on margin expansion via cost per BOE and uptime KPIs.
Acquisitions, divestitures, and portfolio management
Strategic M&A added inventory depth and captured infrastructure synergies across midstream and processing, while non-core divestments recycled capital into higher-return projects and improved working capital in 2024. Hedging and marketing were synchronized with development cadence to stabilize cash flow and support disciplined reinvestment. The 2024 spin-outs optimized asset focus and enhanced stakeholder outcomes through clearer capital allocation and governance.
- Inventory depth via M&A
- Capital recycling from divestments
- Hedging aligned to development
- 2024 spin-outs sharpened focus
ESG compliance and asset retirement
Regulatory reporting and continuous environmental monitoring ensured compliance with evolving 2024 standards while feeding transparent KPIs to stakeholders. Methane mitigation programs and targeted electrification projects materially reduced emissions intensity and operational CH4 leaks. Systematic abandonment and reclamation protocols addressed long-term liabilities and costed asset retirement obligations. Transparent disclosure bolstered investor trust through verified third-party audits.
- Regulatory reporting: 2024-aligned disclosures
- Methane & electrification: reduced emissions intensity
- Abandonment & reclamation: managed long-term liabilities
- Transparent disclosure: third-party verification for investors
IP30 ~1,200 boe/d, EUR ~600 mboe; sub-$4.5M wells, 25% faster pads
Geoscience, pilots and type-curves validated IP30 ~1,200 boe/d and EUR ~600 mboe, guiding sub-$4.5M well costs (2024).
Factory-style pads cut cycle time ~25% and per-well cost ~20%, supporting ~95% operational uptime.
Ops optimization, artificial lift and integrated water/gas capture lowered LOE and preserved sub-$10,000/flowing BOE-day capital intensity.
M&A, divestments and hedging stabilized cash flow and recycled capital into higher-return inventory (2024).
| Metric | 2024 |
|---|---|
| IP30 | ~1,200 boe/d |
| EUR | ~600 mboe |
| Well cost | $4.5M |
| Cycle time ↓ | ~25% |
| Per-well cost ↓ | ~20% |
| Uptime | ~95% |
| Cap intensity | <$10,000/flowing BOE-day |
Delivered as Displayed
Business Model Canvas
The document you're previewing is the exact Spartan Delta Business Model Canvas you'll receive after purchase. It's not a mockup—this live preview shows the final, fully editable file formatted for immediate use. After payment you'll get the same complete document in Word and Excel.











