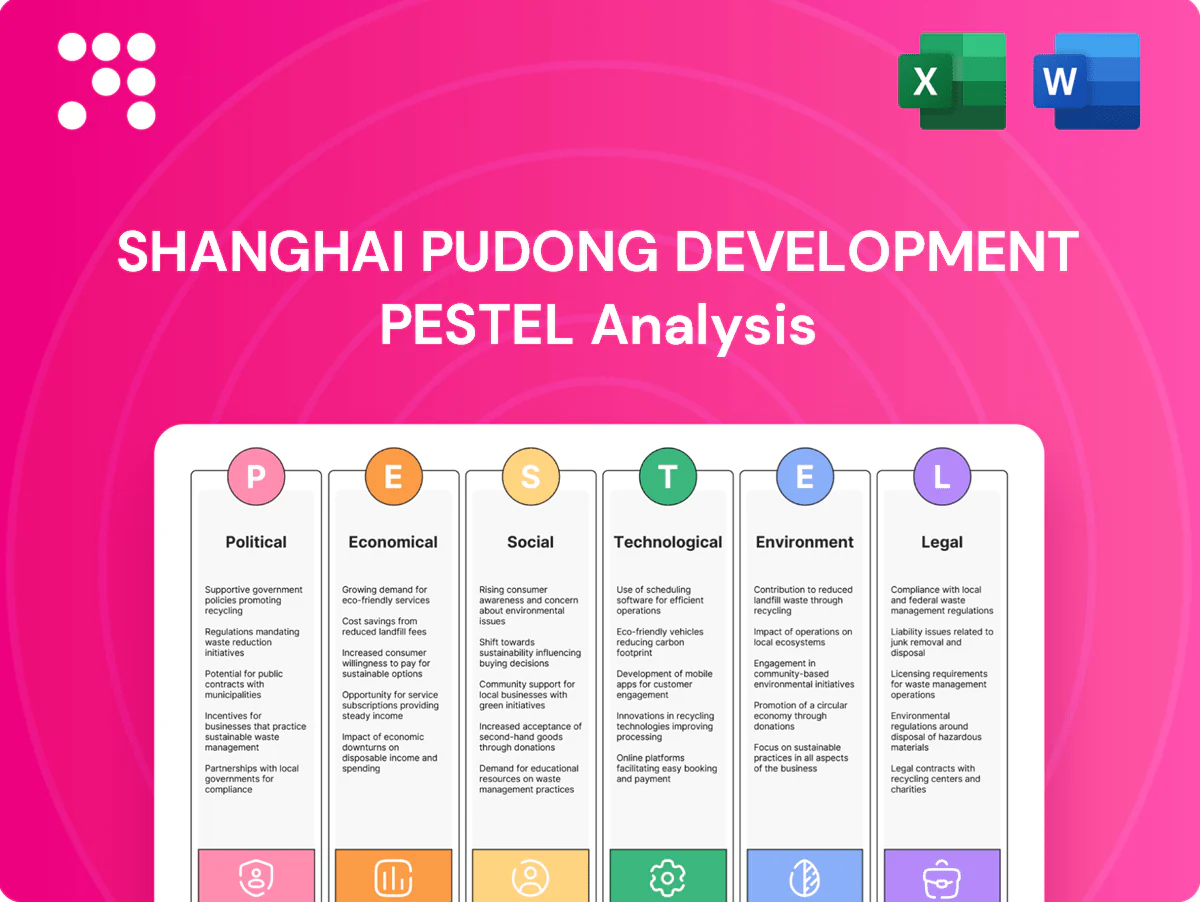
Shanghai Pudong Development PESTLE Analysis

Skip the Research. Get the Strategy.
Explore how regulatory shifts, urban policy, economic cycles and ESG trends are shaping Shanghai Pudong Development’s growth and risk profile in our concise PESTLE snapshot. This expert analysis highlights key external forces affecting strategy and investor returns. Purchase the full PESTLE to get actionable, ready-to-use insights and forecasts.
Political factors

State oversight
China’s centralized financial governance—with state-owned banks holding roughly 60% of sector assets—directly shapes SPD Bank’s strategy and risk appetite; State Council and PBOC directives cascade rapidly into lending and capital rules. Alignment with national priorities, including the 5% GDP growth target and tech self-reliance, steers capital toward real-economy lending and strategic sectors. Political stability aids multi-year planning but abrupt policy shifts can force quick portfolio repricing.
Regulatory direction
The National Financial Regulatory Administration, established in 2023, now drives prudential supervision and conduct controls. Campaigns on de-risking and curbing shadow finance tighten off-balance-sheet activities. Window guidance steers credit toward SMEs and manufacturing; SMEs account for roughly 60% of GDP and about 80% of urban employment. Compliance agility is critical to avoid fines and reputational harm.

Geo-economic tensions
Export controls since 2022 have elevated counterparty and sanctions risks for Shanghai Pudong Development, while US‑China frictions complicate access to advanced tech and markets. Cross‑border and trade finance now face heavier screening and delays, pressuring liquidity for developers. With China holding about $3.2 trillion in FX reserves (end‑2024) and US‑China goods trade roughly $690 billion in 2023, diversifying currency and market exposure helps mitigate spillovers.

Public sector linkages
Support for state-led projects gives Shanghai Pudong Development stable volumes but thin margins, with government procurement and housing-for-policy projects often yielding single-digit operating margins; local government financing vehicles (LGFVs) remain a monitored exposure after China’s LGFV outstanding debt was widely estimated near RMB 40 trillion by end-2023. Political expectations for fee reductions and rate concessions during 2023–24 compressed profitability, so balanced portfolio governance is used to protect capital and liquidity.
- LGFV exposure: monitored (RMB ~40 trillion, end-2023)
- State-led volumes: stable, lower margins
- Policy pressures: fee cuts/rate concessions reduced profits in 2023–24
- Mitigation: diversified portfolio governance to protect capital
Financial reforms
Ongoing interest‑rate marketization and greater exchange‑rate flexibility—1‑yr LPR at 3.45% and USD/CNY ~7.20 mid‑2025—are changing pricing dynamics and margin management for SPD Bank. Expansion of multi‑layer capital markets (STAR/ChiNext) redirects investment‑banking flows while opening measures invite foreign competition and collaboration. SPD Bank must track reform pacing and join pilot programs to preserve fee income and market share.
- 1‑yr LPR 3.45%
- USD/CNY ~7.20 (mid‑2025)
- STAR/ChiNext deepen equity-linked flows
- Opening attracts foreign banks and partners
- SPD must adapt pricing, join pilots
NFRA/PBOC push banks to lend to real economy; LGFV exposure compresses margins, raises risk
Centralized financial control (state banks ~60% assets) and NFRA/PBOC directives push SPD Bank toward real‑economy lending and de‑risking; LGFV exposure (RMB ~40tn end‑2023) compresses margins. US‑China frictions raise sanctions/counterparty risk; 1‑yr LPR 3.45%, USD/CNY ~7.20 (mid‑2025).
| Metric | Value |
|---|---|
| State bank share | ~60% |
| LGFV debt | RMB ~40tn |
| 1‑yr LPR | 3.45% |
| USD/CNY | ~7.20 |
What is included in the product
 Detailed Word Document
Explores how macro-environmental factors uniquely affect Shanghai Pudong Development across Political, Economic, Social, Technological, Environmental and Legal dimensions, with data-backed trends and region-specific examples. Designed for executives and investors, it highlights risks, opportunities and forward-looking insights to inform strategy and funding decisions.

 Customizable Excel Spreadsheet
A concise, visually segmented PESTLE summary of Shanghai Pudong Development that’s editable for presentations and notes, enabling quick interpretation, team alignment, and focused discussions on external risks and market positioning.
Economic factors

GDP and credit cycle
China's moderate GDP rebound (IMF 2024 growth ~5.2%) and targeted policy are directing credit toward priority sectors while broad credit growth moderated to around 8% in 2024; weak property activity has pressured collateral values and lifted NPL formation risks for banks. Counter‑cyclical measures—RRR cuts and targeted relending—have supported loan demand and eased pricing, but tight risk controls remain essential across the cycle.
Interest rate trends
LPR adjustments (1-year LPR 3.65%, 5-year 4.30% as of mid-2025) and recent RRR cuts have lowered banks’ funding costs, but guided rate cuts and fierce competition compress SPD Bank’s net interest margin; reliance on wholesale funding versus demand deposits increases sensitivity to market moves, while active asset-liability management—duration matching, selective re-pricing and higher-quality loan mix—helps protect NIM.

RMB and liquidity
RMB exchange dynamics—RMB accounted for about 3.9% of global payments in 2024 (SWIFT)—shape demand for SPD Bank’s trade finance and FX services and price hedging. Ample system liquidity (China M2 growth ~5.1% in 2024) can compress yields, while tighter funding (7-day repo ~1.8% in mid-2025) lifts costs. Rising cross-border RMB use creates fee revenue opportunities; diversified liquidity buffers reduce stress risk.

Sectoral mix
Sectoral mix shifts—manufacturing upgrades, green infrastructure and the digital economy—are expanding SPDBs lending pipelines while raising capital needs; property and local government exposures still demand cautious borrower selection, and SME financing offers growth with higher credit risk, affecting ROA/ROE and capital consumption.
- Manufacturing upgrade: growth lending
- Green infrastructure: higher capital intensity
- Digital economy: fee and credit upside
- Property/LG: selective risk control
- SMEs: growth vs higher NPL risk
Household finances
Household finances in Pudong reflect national trends: China household gross saving rate was about 28% in 2023 (OECD), shifting deposit mixes toward more liquid accounts as consumption slowly recovers.
Mortgage demand remains softer amid property-market adjustments, while wealth-management flows show high sensitivity to equity and bond volatility.
Tailored retail products and targeted yields can help stabilize retail balances and deposit stickiness.
- Deposit mix: more liquid demand balances
- Saving rate: ~28% (2023)
- Mortgage: subdued demand
- Wealth flows: volatility-sensitive
- Strategy: tailored retail products
NFRA/PBOC push banks to lend to real economy; LGFV exposure compresses margins, raises risk
China GDP rebound ~5.2% (IMF 2024) and targeted easing support loan demand while property weakness raises NPL risk; broad credit growth ~8% (2024). LPR 1y 3.65% / 5y 4.30% (mid‑2025) compresses NIM; RRR cuts and liquidity (M2 ~5.1% 2024) ease funding but wholesale reliance raises sensitivity. RMB cross‑border use ~3.9% of payments (2024) boosts trade/FX fees; SME and green lending expand capital needs.
| Indicator | Value |
|---|---|
| GDP growth (2024) | ~5.2% |
| Credit growth (2024) | ~8% |
| 1y / 5y LPR (mid‑2025) | 3.65% / 4.30% |
| M2 growth (2024) | ~5.1% |
| RMB global payments (2024) | ~3.9% |
What You See Is What You Get
Shanghai Pudong Development PESTLE Analysis
The preview shown here is the exact Shanghai Pudong Development PESTLE Analysis document you’ll receive after purchase—fully formatted and ready to use. It contains the complete political, economic, social, technological, legal, and environmental evaluation as displayed, with no placeholders or edits. Download the final file immediately after checkout and begin applying the insights to your analysis.

Skip the Research. Get the Strategy.
Explore how regulatory shifts, urban policy, economic cycles and ESG trends are shaping Shanghai Pudong Development’s growth and risk profile in our concise PESTLE snapshot. This expert analysis highlights key external forces affecting strategy and investor returns. Purchase the full PESTLE to get actionable, ready-to-use insights and forecasts.
Political factors
State oversight
China’s centralized financial governance—with state-owned banks holding roughly 60% of sector assets—directly shapes SPD Bank’s strategy and risk appetite; State Council and PBOC directives cascade rapidly into lending and capital rules. Alignment with national priorities, including the 5% GDP growth target and tech self-reliance, steers capital toward real-economy lending and strategic sectors. Political stability aids multi-year planning but abrupt policy shifts can force quick portfolio repricing.
Regulatory direction
The National Financial Regulatory Administration, established in 2023, now drives prudential supervision and conduct controls. Campaigns on de-risking and curbing shadow finance tighten off-balance-sheet activities. Window guidance steers credit toward SMEs and manufacturing; SMEs account for roughly 60% of GDP and about 80% of urban employment. Compliance agility is critical to avoid fines and reputational harm.
Geo-economic tensions
Export controls since 2022 have elevated counterparty and sanctions risks for Shanghai Pudong Development, while US‑China frictions complicate access to advanced tech and markets. Cross‑border and trade finance now face heavier screening and delays, pressuring liquidity for developers. With China holding about $3.2 trillion in FX reserves (end‑2024) and US‑China goods trade roughly $690 billion in 2023, diversifying currency and market exposure helps mitigate spillovers.
Public sector linkages
Support for state-led projects gives Shanghai Pudong Development stable volumes but thin margins, with government procurement and housing-for-policy projects often yielding single-digit operating margins; local government financing vehicles (LGFVs) remain a monitored exposure after China’s LGFV outstanding debt was widely estimated near RMB 40 trillion by end-2023. Political expectations for fee reductions and rate concessions during 2023–24 compressed profitability, so balanced portfolio governance is used to protect capital and liquidity.
- LGFV exposure: monitored (RMB ~40 trillion, end-2023)
- State-led volumes: stable, lower margins
- Policy pressures: fee cuts/rate concessions reduced profits in 2023–24
- Mitigation: diversified portfolio governance to protect capital
Financial reforms
Ongoing interest‑rate marketization and greater exchange‑rate flexibility—1‑yr LPR at 3.45% and USD/CNY ~7.20 mid‑2025—are changing pricing dynamics and margin management for SPD Bank. Expansion of multi‑layer capital markets (STAR/ChiNext) redirects investment‑banking flows while opening measures invite foreign competition and collaboration. SPD Bank must track reform pacing and join pilot programs to preserve fee income and market share.
- 1‑yr LPR 3.45%
- USD/CNY ~7.20 (mid‑2025)
- STAR/ChiNext deepen equity-linked flows
- Opening attracts foreign banks and partners
- SPD must adapt pricing, join pilots
NFRA/PBOC push banks to lend to real economy; LGFV exposure compresses margins, raises risk
Centralized financial control (state banks ~60% assets) and NFRA/PBOC directives push SPD Bank toward real‑economy lending and de‑risking; LGFV exposure (RMB ~40tn end‑2023) compresses margins. US‑China frictions raise sanctions/counterparty risk; 1‑yr LPR 3.45%, USD/CNY ~7.20 (mid‑2025).
| Metric | Value |
|---|---|
| State bank share | ~60% |
| LGFV debt | RMB ~40tn |
| 1‑yr LPR | 3.45% |
| USD/CNY | ~7.20 |
What is included in the product
Detailed Word Document
Explores how macro-environmental factors uniquely affect Shanghai Pudong Development across Political, Economic, Social, Technological, Environmental and Legal dimensions, with data-backed trends and region-specific examples. Designed for executives and investors, it highlights risks, opportunities and forward-looking insights to inform strategy and funding decisions.
Customizable Excel Spreadsheet
A concise, visually segmented PESTLE summary of Shanghai Pudong Development that’s editable for presentations and notes, enabling quick interpretation, team alignment, and focused discussions on external risks and market positioning.
Economic factors
GDP and credit cycle
China's moderate GDP rebound (IMF 2024 growth ~5.2%) and targeted policy are directing credit toward priority sectors while broad credit growth moderated to around 8% in 2024; weak property activity has pressured collateral values and lifted NPL formation risks for banks. Counter‑cyclical measures—RRR cuts and targeted relending—have supported loan demand and eased pricing, but tight risk controls remain essential across the cycle.
Interest rate trends
LPR adjustments (1-year LPR 3.65%, 5-year 4.30% as of mid-2025) and recent RRR cuts have lowered banks’ funding costs, but guided rate cuts and fierce competition compress SPD Bank’s net interest margin; reliance on wholesale funding versus demand deposits increases sensitivity to market moves, while active asset-liability management—duration matching, selective re-pricing and higher-quality loan mix—helps protect NIM.
RMB and liquidity
RMB exchange dynamics—RMB accounted for about 3.9% of global payments in 2024 (SWIFT)—shape demand for SPD Bank’s trade finance and FX services and price hedging. Ample system liquidity (China M2 growth ~5.1% in 2024) can compress yields, while tighter funding (7-day repo ~1.8% in mid-2025) lifts costs. Rising cross-border RMB use creates fee revenue opportunities; diversified liquidity buffers reduce stress risk.
Sectoral mix
Sectoral mix shifts—manufacturing upgrades, green infrastructure and the digital economy—are expanding SPDBs lending pipelines while raising capital needs; property and local government exposures still demand cautious borrower selection, and SME financing offers growth with higher credit risk, affecting ROA/ROE and capital consumption.
- Manufacturing upgrade: growth lending
- Green infrastructure: higher capital intensity
- Digital economy: fee and credit upside
- Property/LG: selective risk control
- SMEs: growth vs higher NPL risk
Household finances
Household finances in Pudong reflect national trends: China household gross saving rate was about 28% in 2023 (OECD), shifting deposit mixes toward more liquid accounts as consumption slowly recovers.
Mortgage demand remains softer amid property-market adjustments, while wealth-management flows show high sensitivity to equity and bond volatility.
Tailored retail products and targeted yields can help stabilize retail balances and deposit stickiness.
- Deposit mix: more liquid demand balances
- Saving rate: ~28% (2023)
- Mortgage: subdued demand
- Wealth flows: volatility-sensitive
- Strategy: tailored retail products
NFRA/PBOC push banks to lend to real economy; LGFV exposure compresses margins, raises risk
China GDP rebound ~5.2% (IMF 2024) and targeted easing support loan demand while property weakness raises NPL risk; broad credit growth ~8% (2024). LPR 1y 3.65% / 5y 4.30% (mid‑2025) compresses NIM; RRR cuts and liquidity (M2 ~5.1% 2024) ease funding but wholesale reliance raises sensitivity. RMB cross‑border use ~3.9% of payments (2024) boosts trade/FX fees; SME and green lending expand capital needs.
| Indicator | Value |
|---|---|
| GDP growth (2024) | ~5.2% |
| Credit growth (2024) | ~8% |
| 1y / 5y LPR (mid‑2025) | 3.65% / 4.30% |
| M2 growth (2024) | ~5.1% |
| RMB global payments (2024) | ~3.9% |
What You See Is What You Get
Shanghai Pudong Development PESTLE Analysis
The preview shown here is the exact Shanghai Pudong Development PESTLE Analysis document you’ll receive after purchase—fully formatted and ready to use. It contains the complete political, economic, social, technological, legal, and environmental evaluation as displayed, with no placeholders or edits. Download the final file immediately after checkout and begin applying the insights to your analysis.
Original: $10.00
-65%$10.00
$3.50Description
Skip the Research. Get the Strategy.
Explore how regulatory shifts, urban policy, economic cycles and ESG trends are shaping Shanghai Pudong Development’s growth and risk profile in our concise PESTLE snapshot. This expert analysis highlights key external forces affecting strategy and investor returns. Purchase the full PESTLE to get actionable, ready-to-use insights and forecasts.
Political factors
State oversight
China’s centralized financial governance—with state-owned banks holding roughly 60% of sector assets—directly shapes SPD Bank’s strategy and risk appetite; State Council and PBOC directives cascade rapidly into lending and capital rules. Alignment with national priorities, including the 5% GDP growth target and tech self-reliance, steers capital toward real-economy lending and strategic sectors. Political stability aids multi-year planning but abrupt policy shifts can force quick portfolio repricing.
Regulatory direction
The National Financial Regulatory Administration, established in 2023, now drives prudential supervision and conduct controls. Campaigns on de-risking and curbing shadow finance tighten off-balance-sheet activities. Window guidance steers credit toward SMEs and manufacturing; SMEs account for roughly 60% of GDP and about 80% of urban employment. Compliance agility is critical to avoid fines and reputational harm.
Geo-economic tensions
Export controls since 2022 have elevated counterparty and sanctions risks for Shanghai Pudong Development, while US‑China frictions complicate access to advanced tech and markets. Cross‑border and trade finance now face heavier screening and delays, pressuring liquidity for developers. With China holding about $3.2 trillion in FX reserves (end‑2024) and US‑China goods trade roughly $690 billion in 2023, diversifying currency and market exposure helps mitigate spillovers.
Public sector linkages
Support for state-led projects gives Shanghai Pudong Development stable volumes but thin margins, with government procurement and housing-for-policy projects often yielding single-digit operating margins; local government financing vehicles (LGFVs) remain a monitored exposure after China’s LGFV outstanding debt was widely estimated near RMB 40 trillion by end-2023. Political expectations for fee reductions and rate concessions during 2023–24 compressed profitability, so balanced portfolio governance is used to protect capital and liquidity.
- LGFV exposure: monitored (RMB ~40 trillion, end-2023)
- State-led volumes: stable, lower margins
- Policy pressures: fee cuts/rate concessions reduced profits in 2023–24
- Mitigation: diversified portfolio governance to protect capital
Financial reforms
Ongoing interest‑rate marketization and greater exchange‑rate flexibility—1‑yr LPR at 3.45% and USD/CNY ~7.20 mid‑2025—are changing pricing dynamics and margin management for SPD Bank. Expansion of multi‑layer capital markets (STAR/ChiNext) redirects investment‑banking flows while opening measures invite foreign competition and collaboration. SPD Bank must track reform pacing and join pilot programs to preserve fee income and market share.
- 1‑yr LPR 3.45%
- USD/CNY ~7.20 (mid‑2025)
- STAR/ChiNext deepen equity-linked flows
- Opening attracts foreign banks and partners
- SPD must adapt pricing, join pilots
NFRA/PBOC push banks to lend to real economy; LGFV exposure compresses margins, raises risk
Centralized financial control (state banks ~60% assets) and NFRA/PBOC directives push SPD Bank toward real‑economy lending and de‑risking; LGFV exposure (RMB ~40tn end‑2023) compresses margins. US‑China frictions raise sanctions/counterparty risk; 1‑yr LPR 3.45%, USD/CNY ~7.20 (mid‑2025).
| Metric | Value |
|---|---|
| State bank share | ~60% |
| LGFV debt | RMB ~40tn |
| 1‑yr LPR | 3.45% |
| USD/CNY | ~7.20 |
What is included in the product
Detailed Word Document
Explores how macro-environmental factors uniquely affect Shanghai Pudong Development across Political, Economic, Social, Technological, Environmental and Legal dimensions, with data-backed trends and region-specific examples. Designed for executives and investors, it highlights risks, opportunities and forward-looking insights to inform strategy and funding decisions.
Customizable Excel Spreadsheet
A concise, visually segmented PESTLE summary of Shanghai Pudong Development that’s editable for presentations and notes, enabling quick interpretation, team alignment, and focused discussions on external risks and market positioning.
Economic factors
GDP and credit cycle
China's moderate GDP rebound (IMF 2024 growth ~5.2%) and targeted policy are directing credit toward priority sectors while broad credit growth moderated to around 8% in 2024; weak property activity has pressured collateral values and lifted NPL formation risks for banks. Counter‑cyclical measures—RRR cuts and targeted relending—have supported loan demand and eased pricing, but tight risk controls remain essential across the cycle.
Interest rate trends
LPR adjustments (1-year LPR 3.65%, 5-year 4.30% as of mid-2025) and recent RRR cuts have lowered banks’ funding costs, but guided rate cuts and fierce competition compress SPD Bank’s net interest margin; reliance on wholesale funding versus demand deposits increases sensitivity to market moves, while active asset-liability management—duration matching, selective re-pricing and higher-quality loan mix—helps protect NIM.
RMB and liquidity
RMB exchange dynamics—RMB accounted for about 3.9% of global payments in 2024 (SWIFT)—shape demand for SPD Bank’s trade finance and FX services and price hedging. Ample system liquidity (China M2 growth ~5.1% in 2024) can compress yields, while tighter funding (7-day repo ~1.8% in mid-2025) lifts costs. Rising cross-border RMB use creates fee revenue opportunities; diversified liquidity buffers reduce stress risk.
Sectoral mix
Sectoral mix shifts—manufacturing upgrades, green infrastructure and the digital economy—are expanding SPDBs lending pipelines while raising capital needs; property and local government exposures still demand cautious borrower selection, and SME financing offers growth with higher credit risk, affecting ROA/ROE and capital consumption.
- Manufacturing upgrade: growth lending
- Green infrastructure: higher capital intensity
- Digital economy: fee and credit upside
- Property/LG: selective risk control
- SMEs: growth vs higher NPL risk
Household finances
Household finances in Pudong reflect national trends: China household gross saving rate was about 28% in 2023 (OECD), shifting deposit mixes toward more liquid accounts as consumption slowly recovers.
Mortgage demand remains softer amid property-market adjustments, while wealth-management flows show high sensitivity to equity and bond volatility.
Tailored retail products and targeted yields can help stabilize retail balances and deposit stickiness.
- Deposit mix: more liquid demand balances
- Saving rate: ~28% (2023)
- Mortgage: subdued demand
- Wealth flows: volatility-sensitive
- Strategy: tailored retail products
NFRA/PBOC push banks to lend to real economy; LGFV exposure compresses margins, raises risk
China GDP rebound ~5.2% (IMF 2024) and targeted easing support loan demand while property weakness raises NPL risk; broad credit growth ~8% (2024). LPR 1y 3.65% / 5y 4.30% (mid‑2025) compresses NIM; RRR cuts and liquidity (M2 ~5.1% 2024) ease funding but wholesale reliance raises sensitivity. RMB cross‑border use ~3.9% of payments (2024) boosts trade/FX fees; SME and green lending expand capital needs.
| Indicator | Value |
|---|---|
| GDP growth (2024) | ~5.2% |
| Credit growth (2024) | ~8% |
| 1y / 5y LPR (mid‑2025) | 3.65% / 4.30% |
| M2 growth (2024) | ~5.1% |
| RMB global payments (2024) | ~3.9% |
What You See Is What You Get
Shanghai Pudong Development PESTLE Analysis
The preview shown here is the exact Shanghai Pudong Development PESTLE Analysis document you’ll receive after purchase—fully formatted and ready to use. It contains the complete political, economic, social, technological, legal, and environmental evaluation as displayed, with no placeholders or edits. Download the final file immediately after checkout and begin applying the insights to your analysis.











