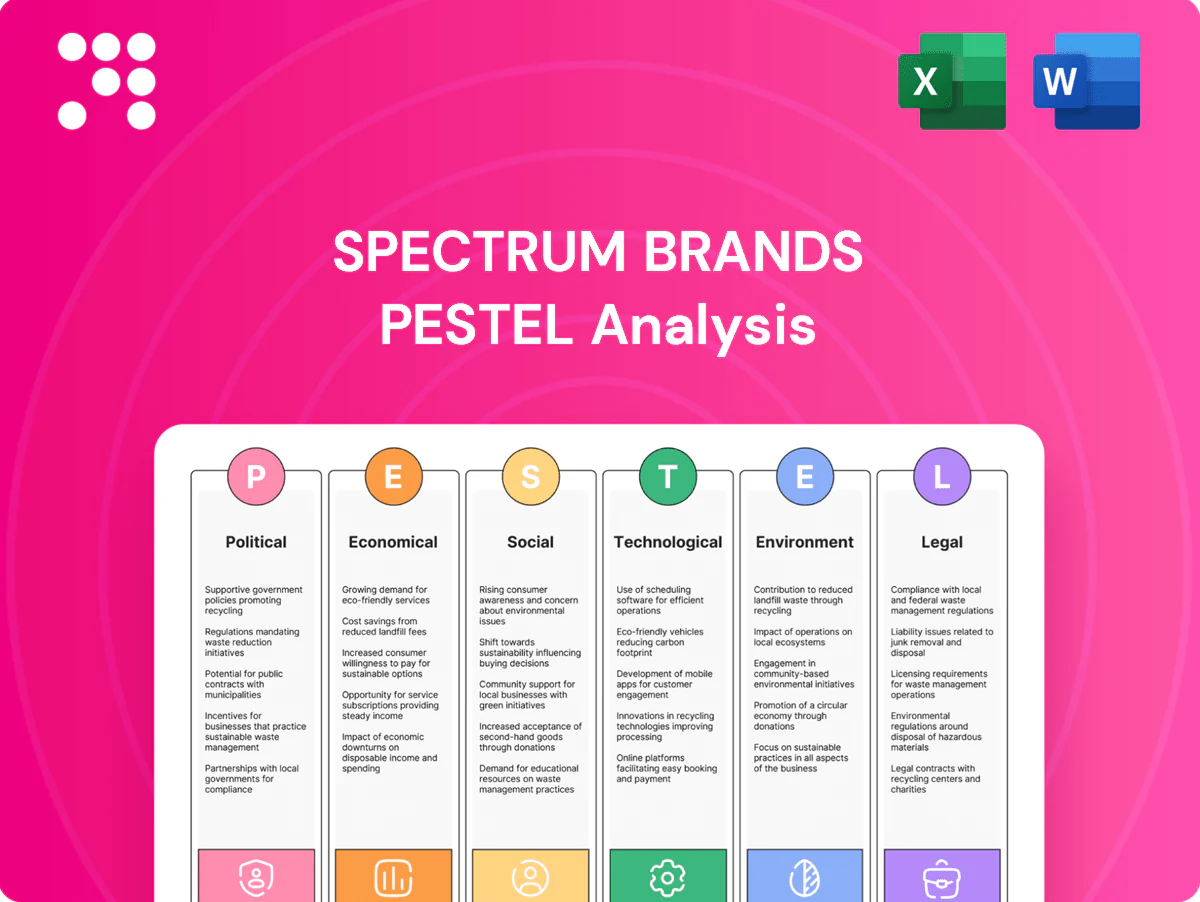
Spectrum Brands PESTLE Analysis

Make Smarter Strategic Decisions with a Complete PESTEL View
Discover how political shifts, economic cycles, social trends, technological advances, legal changes, and environmental pressures are shaping Spectrum Brands' strategic outlook in our concise PESTLE snapshot. Ideal for investors and strategists, it highlights key risks and opportunities. Buy the full analysis to access the complete, actionable report now.
Political factors

Trade policy & tariffs
Spectrum Brands global footprint faces shifting tariffs—notably US Section 301 duties on Chinese goods of up to 25% (2024)—raising landed costs for chemicals, metals and finished goods and forcing sourcing shifts; preferential agreements such as USMCA can improve margins and speed to market; active monitoring and financial/operational hedges are essential to mitigate tariff-driven margin volatility.
Regulatory stability
Policy volatility across the US, EU and emerging markets shortens planning cycles for Spectrum Brands, whose products reach 160+ countries, forcing faster SKU and supply decisions. Sudden changes to consumer goods or agrochemical rules can require costly product reformulations and relabeling within months. Stable regulatory regimes enable multi-year investments in plants and distribution, while political instability risks sales disruptions and supply-chain rerouting.

Agrochemical oversight
Government agencies including the US EPA and EU regulators control lawn and garden pesticide approvals, directly shaping Spectrum Brands' portfolio, labeling and marketing claims; the global agrochemical market was about $86 billion in 2024, so regulatory shifts have material revenue impact. Tightening rules can phase out active ingredients and push compliance costs materially higher, increasing product reformulation spend. Fragmented harmonization across 50+ jurisdictions adds complexity and administrative cost.

Public health & safety agendas
Political emphasis on consumer health raises stricter standards for appliances and grooming devices; mandated testing and certifications commonly add 3–9 months to time-to-market and cost roughly $5,000–$50,000 per SKU. Policy campaigns shift demand toward safer or natural alternatives (surveys show ~62% of consumers rank safety as top purchase driver), and advocacy outcomes increasingly dictate retailer listing requirements.
- Standards: stricter safety regs
- Time/cost: +3–9 months, $5k–$50k/SKU
- Demand: ~62% favor safety
- Retail: advocacy shapes listing rules
Government incentives & localization
Tariffs, regulation and testing delays shorten planning — Section 301 25%
Spectrum Brands faces tariff risk (US Section 301 up to 25% in 2024) and policy volatility across 160+ markets, shortening planning cycles. Regulatory control of pesticides (global agrochemical market $86B in 2024) and stricter appliance safety (testing +3–9 months, $5k–$50k/SKU) raise compliance costs. Incentives like the US IRA ($369B) shift manufacturing toward regionalized, energy‑efficient production.
| Factor | 2024/25 Data |
|---|---|
| Tariffs | Section 301 up to 25% |
| Markets | 160+ countries |
| Agrochem | $86B (2024) |
| IRA | $369B |
| Testing | +3–9 months, $5k–$50k/SKU |
What is included in the product
 Detailed Word Document
Provides a compact PESTLE evaluation of Spectrum Brands across Political, Economic, Social, Technological, Environmental and Legal dimensions, combining data-driven trends and region-specific regulatory insights to identify risks and opportunities for executives, investors and strategists; formatted for direct use in reports and scenario planning.

 Customizable Excel Spreadsheet
A concise, PESTLE-organized summary of Spectrum Brands' external risks and opportunities that can be dropped into presentations or planning sessions to align teams quickly and support strategic decision-making.
Economic factors

Consumer spending cycles
Spectrum Brands’ grooming, home and pet-care categories are highly sensitive to disposable income and consumer confidence; U.S. private-label penetration rose to about 20% in 2024, intensifying trade-down pressure during downturns. Recessions drive deferred non-essential purchases while recoveries lift premium grooming and pet-care upgrades—global pet-care market was roughly $275 billion in 2024, supporting upgrade demand. Pricing power hinges on perceived brand value and innovation.
Input & logistics inflation
Input and logistics inflation—resins, metals, packaging and freight—compressed Spectrum Brands gross margins in FY2024, prompting targeted pricing actions across retail partners. Elevated fuel surcharges and ocean capacity constraints intermittently disrupted service levels and fulfillment. Cost pass-through required agile, collaborative pricing with retailers while supply-chain diversification reduced single-source risk.

Foreign exchange exposure
Spectrum Brands faces translation and transaction risk from multi-currency revenues and costs; roughly 30–40% of sales are generated outside the US, amplifying FX sensitivity.
The US dollar strengthened in 2024 (DXY up about 8%), compressing reported overseas earnings and shifting sourcing economics toward non‑U.S. suppliers.
Company hedging—primarily forwards and collars—reduced volatility in 2024 but increased treasury complexity and hedging costs, while pricing localization has been used to protect market share.

Retailer consolidation
Large mass merchandisers like Walmart (FY2024 revenue $611.3B) and Home Depot ($157.4B in 2024) wield strong bargaining power, driving slotting fees and vendor terms that compress margins for Spectrum Brands.
U.S. e-commerce reached about 18% of retail sales in 2024, shifting promotional cadence and inventory risk toward faster markdowns; diversifying channels (direct-to-consumer, specialty, online marketplaces) reduces dependency on a few large buyers.
- Consolidation pressure from top retailers
- Slotting/vendor terms affect margins
- 18% e-commerce share (2024) raises inventory/promotional risk
- Channel diversification lowers buyer concentration
M&A and portfolio rotation
Spectrum Brands relies on acquiring and scaling brands while pruning non-core assets to lift margins and revenue diversification.
Valuation cycles constrain deal flow and synergy capture; global M&A activity fell about 20% in 2024 to roughly $2.5 trillion, slowing opportunistic buys.
Integration discipline drives margin expansion (post-acquisition EBITDA uplift often targeted near 200 bps) and capital costs (10-year UST ~4.3% mid-2025) tilt decisions between buybacks and M&A.
- Model: acquisition-led growth with asset pruning
- Market: 2024 M&A ~ $2.5T, down ~20%
- Margins: integration targets ~200 bps uplift
- Capital cost: 10y UST ~4.3% influences buyback vs M&A
Tariffs, regulation and testing delays shorten planning — Section 301 25%
Spectrum Brands’ consumer-facing categories track disposable income and private‑label pressure (U.S. private‑label ~20% in 2024); global pet‑care ~$275B (2024) supports premium upgrades. Input/logistics inflation and freight squeezed FY2024 margins; pricing power depends on brand and innovation. FX risk is notable—30–40% sales ex‑US and DXY ~+8% (2024). Major retailers (Walmart $611.3B, Home Depot $157.4B in 2024) and 18% e‑commerce share (2024) drive channel dynamics.
| Metric | Value |
|---|---|
| Private‑label (US) | ~20% (2024) |
| Global pet‑care | ~$275B (2024) |
| Sales ex‑US | 30–40% |
| DXY change | +8% (2024) |
| U.S. e‑commerce | 18% (2024) |
| Walmart / Home Depot | $611.3B / $157.4B (2024) |
| M&A volume | $2.5T (-20% 2024) |
| 10y UST | ~4.3% (mid‑2025) |
Preview Before You Purchase
Spectrum Brands PESTLE Analysis
The preview shown here is the exact Spectrum Brands PESTLE Analysis you’ll receive after purchase—fully formatted and ready to use. The content, layout, and insights visible in this sample are the final deliverable with no placeholders or surprises. After checkout you’ll instantly download this same professionally structured file.

Make Smarter Strategic Decisions with a Complete PESTEL View
Discover how political shifts, economic cycles, social trends, technological advances, legal changes, and environmental pressures are shaping Spectrum Brands' strategic outlook in our concise PESTLE snapshot. Ideal for investors and strategists, it highlights key risks and opportunities. Buy the full analysis to access the complete, actionable report now.
Political factors
Trade policy & tariffs
Spectrum Brands global footprint faces shifting tariffs—notably US Section 301 duties on Chinese goods of up to 25% (2024)—raising landed costs for chemicals, metals and finished goods and forcing sourcing shifts; preferential agreements such as USMCA can improve margins and speed to market; active monitoring and financial/operational hedges are essential to mitigate tariff-driven margin volatility.
Regulatory stability
Policy volatility across the US, EU and emerging markets shortens planning cycles for Spectrum Brands, whose products reach 160+ countries, forcing faster SKU and supply decisions. Sudden changes to consumer goods or agrochemical rules can require costly product reformulations and relabeling within months. Stable regulatory regimes enable multi-year investments in plants and distribution, while political instability risks sales disruptions and supply-chain rerouting.
Agrochemical oversight
Government agencies including the US EPA and EU regulators control lawn and garden pesticide approvals, directly shaping Spectrum Brands' portfolio, labeling and marketing claims; the global agrochemical market was about $86 billion in 2024, so regulatory shifts have material revenue impact. Tightening rules can phase out active ingredients and push compliance costs materially higher, increasing product reformulation spend. Fragmented harmonization across 50+ jurisdictions adds complexity and administrative cost.
Public health & safety agendas
Political emphasis on consumer health raises stricter standards for appliances and grooming devices; mandated testing and certifications commonly add 3–9 months to time-to-market and cost roughly $5,000–$50,000 per SKU. Policy campaigns shift demand toward safer or natural alternatives (surveys show ~62% of consumers rank safety as top purchase driver), and advocacy outcomes increasingly dictate retailer listing requirements.
- Standards: stricter safety regs
- Time/cost: +3–9 months, $5k–$50k/SKU
- Demand: ~62% favor safety
- Retail: advocacy shapes listing rules
Government incentives & localization
Tariffs, regulation and testing delays shorten planning — Section 301 25%
Spectrum Brands faces tariff risk (US Section 301 up to 25% in 2024) and policy volatility across 160+ markets, shortening planning cycles. Regulatory control of pesticides (global agrochemical market $86B in 2024) and stricter appliance safety (testing +3–9 months, $5k–$50k/SKU) raise compliance costs. Incentives like the US IRA ($369B) shift manufacturing toward regionalized, energy‑efficient production.
| Factor | 2024/25 Data |
|---|---|
| Tariffs | Section 301 up to 25% |
| Markets | 160+ countries |
| Agrochem | $86B (2024) |
| IRA | $369B |
| Testing | +3–9 months, $5k–$50k/SKU |
What is included in the product
Detailed Word Document
Provides a compact PESTLE evaluation of Spectrum Brands across Political, Economic, Social, Technological, Environmental and Legal dimensions, combining data-driven trends and region-specific regulatory insights to identify risks and opportunities for executives, investors and strategists; formatted for direct use in reports and scenario planning.
Customizable Excel Spreadsheet
A concise, PESTLE-organized summary of Spectrum Brands' external risks and opportunities that can be dropped into presentations or planning sessions to align teams quickly and support strategic decision-making.
Economic factors
Consumer spending cycles
Spectrum Brands’ grooming, home and pet-care categories are highly sensitive to disposable income and consumer confidence; U.S. private-label penetration rose to about 20% in 2024, intensifying trade-down pressure during downturns. Recessions drive deferred non-essential purchases while recoveries lift premium grooming and pet-care upgrades—global pet-care market was roughly $275 billion in 2024, supporting upgrade demand. Pricing power hinges on perceived brand value and innovation.
Input & logistics inflation
Input and logistics inflation—resins, metals, packaging and freight—compressed Spectrum Brands gross margins in FY2024, prompting targeted pricing actions across retail partners. Elevated fuel surcharges and ocean capacity constraints intermittently disrupted service levels and fulfillment. Cost pass-through required agile, collaborative pricing with retailers while supply-chain diversification reduced single-source risk.
Foreign exchange exposure
Spectrum Brands faces translation and transaction risk from multi-currency revenues and costs; roughly 30–40% of sales are generated outside the US, amplifying FX sensitivity.
The US dollar strengthened in 2024 (DXY up about 8%), compressing reported overseas earnings and shifting sourcing economics toward non‑U.S. suppliers.
Company hedging—primarily forwards and collars—reduced volatility in 2024 but increased treasury complexity and hedging costs, while pricing localization has been used to protect market share.
Retailer consolidation
Large mass merchandisers like Walmart (FY2024 revenue $611.3B) and Home Depot ($157.4B in 2024) wield strong bargaining power, driving slotting fees and vendor terms that compress margins for Spectrum Brands.
U.S. e-commerce reached about 18% of retail sales in 2024, shifting promotional cadence and inventory risk toward faster markdowns; diversifying channels (direct-to-consumer, specialty, online marketplaces) reduces dependency on a few large buyers.
- Consolidation pressure from top retailers
- Slotting/vendor terms affect margins
- 18% e-commerce share (2024) raises inventory/promotional risk
- Channel diversification lowers buyer concentration
M&A and portfolio rotation
Spectrum Brands relies on acquiring and scaling brands while pruning non-core assets to lift margins and revenue diversification.
Valuation cycles constrain deal flow and synergy capture; global M&A activity fell about 20% in 2024 to roughly $2.5 trillion, slowing opportunistic buys.
Integration discipline drives margin expansion (post-acquisition EBITDA uplift often targeted near 200 bps) and capital costs (10-year UST ~4.3% mid-2025) tilt decisions between buybacks and M&A.
- Model: acquisition-led growth with asset pruning
- Market: 2024 M&A ~ $2.5T, down ~20%
- Margins: integration targets ~200 bps uplift
- Capital cost: 10y UST ~4.3% influences buyback vs M&A
Tariffs, regulation and testing delays shorten planning — Section 301 25%
Spectrum Brands’ consumer-facing categories track disposable income and private‑label pressure (U.S. private‑label ~20% in 2024); global pet‑care ~$275B (2024) supports premium upgrades. Input/logistics inflation and freight squeezed FY2024 margins; pricing power depends on brand and innovation. FX risk is notable—30–40% sales ex‑US and DXY ~+8% (2024). Major retailers (Walmart $611.3B, Home Depot $157.4B in 2024) and 18% e‑commerce share (2024) drive channel dynamics.
| Metric | Value |
|---|---|
| Private‑label (US) | ~20% (2024) |
| Global pet‑care | ~$275B (2024) |
| Sales ex‑US | 30–40% |
| DXY change | +8% (2024) |
| U.S. e‑commerce | 18% (2024) |
| Walmart / Home Depot | $611.3B / $157.4B (2024) |
| M&A volume | $2.5T (-20% 2024) |
| 10y UST | ~4.3% (mid‑2025) |
Preview Before You Purchase
Spectrum Brands PESTLE Analysis
The preview shown here is the exact Spectrum Brands PESTLE Analysis you’ll receive after purchase—fully formatted and ready to use. The content, layout, and insights visible in this sample are the final deliverable with no placeholders or surprises. After checkout you’ll instantly download this same professionally structured file.
Description
Make Smarter Strategic Decisions with a Complete PESTEL View
Discover how political shifts, economic cycles, social trends, technological advances, legal changes, and environmental pressures are shaping Spectrum Brands' strategic outlook in our concise PESTLE snapshot. Ideal for investors and strategists, it highlights key risks and opportunities. Buy the full analysis to access the complete, actionable report now.
Political factors
Trade policy & tariffs
Spectrum Brands global footprint faces shifting tariffs—notably US Section 301 duties on Chinese goods of up to 25% (2024)—raising landed costs for chemicals, metals and finished goods and forcing sourcing shifts; preferential agreements such as USMCA can improve margins and speed to market; active monitoring and financial/operational hedges are essential to mitigate tariff-driven margin volatility.
Regulatory stability
Policy volatility across the US, EU and emerging markets shortens planning cycles for Spectrum Brands, whose products reach 160+ countries, forcing faster SKU and supply decisions. Sudden changes to consumer goods or agrochemical rules can require costly product reformulations and relabeling within months. Stable regulatory regimes enable multi-year investments in plants and distribution, while political instability risks sales disruptions and supply-chain rerouting.
Agrochemical oversight
Government agencies including the US EPA and EU regulators control lawn and garden pesticide approvals, directly shaping Spectrum Brands' portfolio, labeling and marketing claims; the global agrochemical market was about $86 billion in 2024, so regulatory shifts have material revenue impact. Tightening rules can phase out active ingredients and push compliance costs materially higher, increasing product reformulation spend. Fragmented harmonization across 50+ jurisdictions adds complexity and administrative cost.
Public health & safety agendas
Political emphasis on consumer health raises stricter standards for appliances and grooming devices; mandated testing and certifications commonly add 3–9 months to time-to-market and cost roughly $5,000–$50,000 per SKU. Policy campaigns shift demand toward safer or natural alternatives (surveys show ~62% of consumers rank safety as top purchase driver), and advocacy outcomes increasingly dictate retailer listing requirements.
- Standards: stricter safety regs
- Time/cost: +3–9 months, $5k–$50k/SKU
- Demand: ~62% favor safety
- Retail: advocacy shapes listing rules
Government incentives & localization
Tariffs, regulation and testing delays shorten planning — Section 301 25%
Spectrum Brands faces tariff risk (US Section 301 up to 25% in 2024) and policy volatility across 160+ markets, shortening planning cycles. Regulatory control of pesticides (global agrochemical market $86B in 2024) and stricter appliance safety (testing +3–9 months, $5k–$50k/SKU) raise compliance costs. Incentives like the US IRA ($369B) shift manufacturing toward regionalized, energy‑efficient production.
| Factor | 2024/25 Data |
|---|---|
| Tariffs | Section 301 up to 25% |
| Markets | 160+ countries |
| Agrochem | $86B (2024) |
| IRA | $369B |
| Testing | +3–9 months, $5k–$50k/SKU |
What is included in the product
Detailed Word Document
Provides a compact PESTLE evaluation of Spectrum Brands across Political, Economic, Social, Technological, Environmental and Legal dimensions, combining data-driven trends and region-specific regulatory insights to identify risks and opportunities for executives, investors and strategists; formatted for direct use in reports and scenario planning.
Customizable Excel Spreadsheet
A concise, PESTLE-organized summary of Spectrum Brands' external risks and opportunities that can be dropped into presentations or planning sessions to align teams quickly and support strategic decision-making.
Economic factors
Consumer spending cycles
Spectrum Brands’ grooming, home and pet-care categories are highly sensitive to disposable income and consumer confidence; U.S. private-label penetration rose to about 20% in 2024, intensifying trade-down pressure during downturns. Recessions drive deferred non-essential purchases while recoveries lift premium grooming and pet-care upgrades—global pet-care market was roughly $275 billion in 2024, supporting upgrade demand. Pricing power hinges on perceived brand value and innovation.
Input & logistics inflation
Input and logistics inflation—resins, metals, packaging and freight—compressed Spectrum Brands gross margins in FY2024, prompting targeted pricing actions across retail partners. Elevated fuel surcharges and ocean capacity constraints intermittently disrupted service levels and fulfillment. Cost pass-through required agile, collaborative pricing with retailers while supply-chain diversification reduced single-source risk.
Foreign exchange exposure
Spectrum Brands faces translation and transaction risk from multi-currency revenues and costs; roughly 30–40% of sales are generated outside the US, amplifying FX sensitivity.
The US dollar strengthened in 2024 (DXY up about 8%), compressing reported overseas earnings and shifting sourcing economics toward non‑U.S. suppliers.
Company hedging—primarily forwards and collars—reduced volatility in 2024 but increased treasury complexity and hedging costs, while pricing localization has been used to protect market share.
Retailer consolidation
Large mass merchandisers like Walmart (FY2024 revenue $611.3B) and Home Depot ($157.4B in 2024) wield strong bargaining power, driving slotting fees and vendor terms that compress margins for Spectrum Brands.
U.S. e-commerce reached about 18% of retail sales in 2024, shifting promotional cadence and inventory risk toward faster markdowns; diversifying channels (direct-to-consumer, specialty, online marketplaces) reduces dependency on a few large buyers.
- Consolidation pressure from top retailers
- Slotting/vendor terms affect margins
- 18% e-commerce share (2024) raises inventory/promotional risk
- Channel diversification lowers buyer concentration
M&A and portfolio rotation
Spectrum Brands relies on acquiring and scaling brands while pruning non-core assets to lift margins and revenue diversification.
Valuation cycles constrain deal flow and synergy capture; global M&A activity fell about 20% in 2024 to roughly $2.5 trillion, slowing opportunistic buys.
Integration discipline drives margin expansion (post-acquisition EBITDA uplift often targeted near 200 bps) and capital costs (10-year UST ~4.3% mid-2025) tilt decisions between buybacks and M&A.
- Model: acquisition-led growth with asset pruning
- Market: 2024 M&A ~ $2.5T, down ~20%
- Margins: integration targets ~200 bps uplift
- Capital cost: 10y UST ~4.3% influences buyback vs M&A
Tariffs, regulation and testing delays shorten planning — Section 301 25%
Spectrum Brands’ consumer-facing categories track disposable income and private‑label pressure (U.S. private‑label ~20% in 2024); global pet‑care ~$275B (2024) supports premium upgrades. Input/logistics inflation and freight squeezed FY2024 margins; pricing power depends on brand and innovation. FX risk is notable—30–40% sales ex‑US and DXY ~+8% (2024). Major retailers (Walmart $611.3B, Home Depot $157.4B in 2024) and 18% e‑commerce share (2024) drive channel dynamics.
| Metric | Value |
|---|---|
| Private‑label (US) | ~20% (2024) |
| Global pet‑care | ~$275B (2024) |
| Sales ex‑US | 30–40% |
| DXY change | +8% (2024) |
| U.S. e‑commerce | 18% (2024) |
| Walmart / Home Depot | $611.3B / $157.4B (2024) |
| M&A volume | $2.5T (-20% 2024) |
| 10y UST | ~4.3% (mid‑2025) |
Preview Before You Purchase
Spectrum Brands PESTLE Analysis
The preview shown here is the exact Spectrum Brands PESTLE Analysis you’ll receive after purchase—fully formatted and ready to use. The content, layout, and insights visible in this sample are the final deliverable with no placeholders or surprises. After checkout you’ll instantly download this same professionally structured file.











