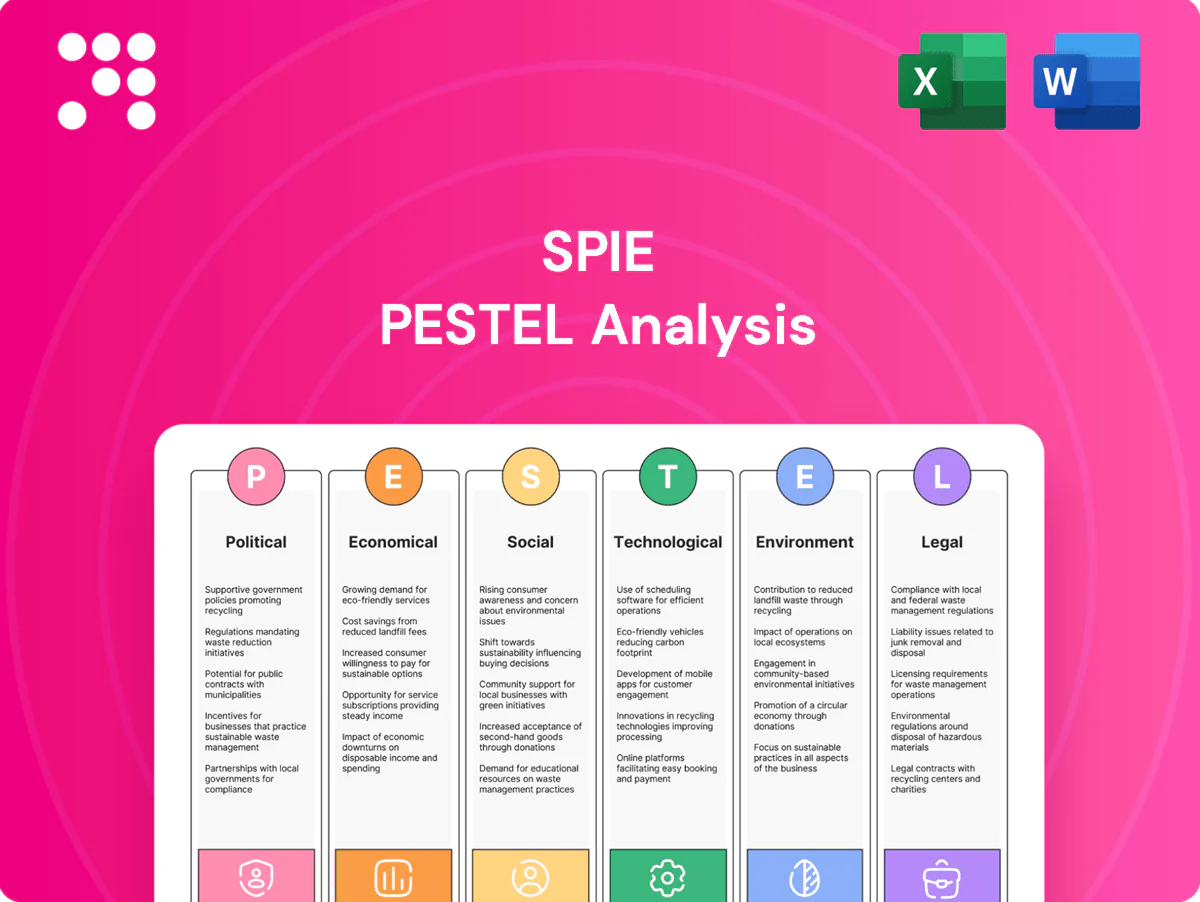
SPIE PESTLE Analysis

Your Competitive Advantage Starts with This Report
Discover how political shifts, economic cycles, social trends, and emerging technologies are shaping SPIE’s strategic outlook with our concise PESTLE Analysis. This expertly researched snapshot highlights regulatory risks, environmental pressures, and competitive opportunities to inform investment and planning decisions. Buy the full version for the complete, editable deep-dive and actionable recommendations you can use immediately.
Political factors

EU energy and climate policy alignment
The EU Green Deal (climate neutrality by 2050) and Fit for 55 (55% GHG cut by 2030) plus national transition plans are driving demand for efficiency, retrofit and electrification services across sectors where buildings account for about 40% of EU energy use. SPIE can access tenders and subsidies from the MFF (€1.074tn 2021–27) and NextGenerationEU (€806.9bn) linked to decarbonization targets. Policy shifts or elections can delay funding cycles, so close engagement with public stakeholders is essential for pipeline visibility.
Public procurement and infrastructure spending
Large portions of SPIE projects are awarded via public procurement at municipal, regional and national levels, with infrastructure modernization, hospital upgrades and rail/e-grid investments supported by EU stimulus such as NextGenerationEU (€806.9bn) bolstering backlog growth. Budget constraints or austerity can slow awards and extend payment terms, while transparent tendering and strong local presence improve win rates.

Energy security and grid resilience agendas
Geopolitical tensions keep energy security high on political agendas, boosting investment in grid reinforcement, district heating and CHP; EU REPowerEU and the 90% gas storage rule are driving multi-billion-euro programs. Governments increasingly incentivize demand-side management and flexibility services, opening markets for long-term service contracts. These multi-year programs fit SPIE’s multi-technical model, though shifts toward nuclear or LNG can reallocate budgets across segments.

Regional regulatory fragmentation
Regional regulatory fragmentation across the EU 27 member states creates divergent licensing, standards and certification regimes for HVAC, electrical and ICT works, raising compliance costs and slowing cross-border deployment of technicians and equipment.
- Compliance: divergent rules across 27 states
- Impact: slower cross-border resource deployment
- Mitigation: local partnerships, decentralized units
- Outlook: EU harmonization initiatives aim to lower barriers
Industrial policy and digital sovereignty
European industrial policy and digital sovereignty measures favor trusted regional providers, boosting demand for SPIE’s ICT services. The EU Digital Europe Programme allocates €7.5bn (2021–2027) and NextGenerationEU/RRF mobilised €723.8bn for digital transformation, supporting data centers, 5G and FTTx rollouts. NIS2 and emerging sovereign cloud rules tighten vendor qualification, so early compliance can be a clear differentiator for SPIE.
- Policy: favors regional trusted providers
- Funding: €7.5bn Digital Europe, €723.8bn RRF/NextGenerationEU
- Targets: gigabit and 5G for all by 2025
- Risk: NIS2 raises vendor compliance bar
- Opportunity: sovereign cloud alignment = competitive edge
EU Green Deal 55% target spurs retrofit; fragmented rules raise costs
Political drivers: EU Green Deal and Fit for 55 (55% GHG cut by 2030) plus NextGenerationEU (€806.9bn) and REPowerEU boost retrofit, electrification and grid work; public procurement dominates SPIE’s pipeline. Regulatory fragmentation across 27 states raises compliance costs and slows cross-border deployment. Digital sovereignty funds (€7.5bn Digital Europe; RRF/NextGenerationEU €723.8bn) favour regional ICT providers.
| Policy | Funding | Impact | Mitigation |
|---|---|---|---|
| Green Deal/Fit55 | €806.9bn NextGen; €7.5bn Digital | Higher demand; compliance costs | Local partners; NIS2 compliance |
What is included in the product
 Detailed Word Document
Explores how macro-environmental factors uniquely affect SPIE across Political, Economic, Social, Technological, Environmental and Legal dimensions, with data-backed trends and region-specific regulatory context; designed for executives and investors with forward-looking insights and ready-to-use formatting for reports and decks.

 Customizable Excel Spreadsheet
Concise, visually segmented SPIE PESTLE summary that’s editable for region- or business-specific notes, easily dropped into presentations or shared across teams to streamline risk discussions and strategic alignment.
Economic factors

Interest rates and capex cycles
Rising policy rates (ECB ~4% and US Fed funds ~5.25% mid-2025) compress client capex and real estate development, often delaying building upgrades; projects with sub-3-year paybacks, notably energy-efficiency retrofits, remain resilient. Rate normalization is unlocking deferred projects as financing eases, while SPIE’s maintenance-heavy, recurring-services mix stabilizes revenues through capex cycles.
Energy prices and efficiency ROI
Volatile energy prices sharpen the economics of retrofits, advanced controls and electrification as customers push for projects with measurable savings and payback typically targeted under 5 years. Customers increasingly prioritize contracts with performance guarantees and third-party measurement and verification; many EPCs guarantee 80–100% of projected savings. SPIE can structure energy performance contracts to de-risk outcomes and capture sustained demand as price volatility persists.

Labor costs and skilled workforce scarcity
Tight European labor markets (Eurostat: EU unemployment ~6.5% in 2024) are driving wage inflation for technicians and engineers—sector wage growth ran around mid-single digits in 2023–24—elongating project timelines and compressing SPIE margins. Apprenticeships, training academies and targeted M&A have been used to secure capabilities while pricing discipline and contract indexation (linked to CPI/Wage indices) remain critical to protect margins.

Public–private investment flows
EU NextGenerationEU mobilises €723.8bn and the 2021–27 multiannual financial framework totals €1.074tn, channeling capital into energy, transport and digital infrastructure; Recovery and Resilience Facility projects drive multi-year contracts. Co-financing models create steady frameworks, but administrative and audit delays have shifted many disbursements into 2024–25, causing back-end loaded revenue recognition; SPIE can offset this by combining public contracts with private industrial maintenance to stabilise mix.
- NextGenerationEU €723.8bn
- MFF 2021–27 €1.074tn
- Disbursement shifts into 2024–25 risk back-loaded revenue
- SPIE strategy: public frameworks + private maintenance for stability
Client sector mix and resilience
Diversification across buildings, industry, utilities and ICT cushions sector-specific downturns; SPIE operates in around 30 countries and employed roughly 46,000 people in 2023, supporting scale and cross-sector deployment. Industrial maintenance revenues are typically recurring and less cyclical, while real estate softness can be offset by strong demand in data centers, healthcare and grid projects. Portfolio steering toward high-margin, low-volatility segments supports margin resilience.
EU Green Deal 55% target spurs retrofit; fragmented rules raise costs
Higher policy rates (ECB ~4%, US Fed ~5.25% mid-2025) slow capex but support maintenance-heavy recurring revenue; energy-price volatility increases demand for quick-payback retrofits and EPCs with performance guarantees. Tight EU labor markets (unemployment ~6.5% 2024) push technician wages and favor training/M&A; NextGenerationEU (€723.8bn) and MFF (€1.074tn) sustain multi-year public projects.
| Metric | Value |
|---|---|
| ECB rate | ~4% |
| US Fed funds | ~5.25% |
| EU unemployment (2024) | ~6.5% |
| NextGenerationEU | €723.8bn |
| MFF 2021–27 | €1.074tn |
| SPIE employees (2023) | ~46,000 |
Same Document Delivered
SPIE PESTLE Analysis
The preview shown here is the exact SPIE PESTLE Analysis document you’ll receive after purchase—fully formatted and ready to use. It contains comprehensive Political, Economic, Social, Technological, Legal and Environmental assessments tailored to SPIE, with clear structure and professional layout. No placeholders or surprises.

Your Competitive Advantage Starts with This Report
Discover how political shifts, economic cycles, social trends, and emerging technologies are shaping SPIE’s strategic outlook with our concise PESTLE Analysis. This expertly researched snapshot highlights regulatory risks, environmental pressures, and competitive opportunities to inform investment and planning decisions. Buy the full version for the complete, editable deep-dive and actionable recommendations you can use immediately.
Political factors
EU energy and climate policy alignment
The EU Green Deal (climate neutrality by 2050) and Fit for 55 (55% GHG cut by 2030) plus national transition plans are driving demand for efficiency, retrofit and electrification services across sectors where buildings account for about 40% of EU energy use. SPIE can access tenders and subsidies from the MFF (€1.074tn 2021–27) and NextGenerationEU (€806.9bn) linked to decarbonization targets. Policy shifts or elections can delay funding cycles, so close engagement with public stakeholders is essential for pipeline visibility.
Public procurement and infrastructure spending
Large portions of SPIE projects are awarded via public procurement at municipal, regional and national levels, with infrastructure modernization, hospital upgrades and rail/e-grid investments supported by EU stimulus such as NextGenerationEU (€806.9bn) bolstering backlog growth. Budget constraints or austerity can slow awards and extend payment terms, while transparent tendering and strong local presence improve win rates.
Energy security and grid resilience agendas
Geopolitical tensions keep energy security high on political agendas, boosting investment in grid reinforcement, district heating and CHP; EU REPowerEU and the 90% gas storage rule are driving multi-billion-euro programs. Governments increasingly incentivize demand-side management and flexibility services, opening markets for long-term service contracts. These multi-year programs fit SPIE’s multi-technical model, though shifts toward nuclear or LNG can reallocate budgets across segments.
Regional regulatory fragmentation
Regional regulatory fragmentation across the EU 27 member states creates divergent licensing, standards and certification regimes for HVAC, electrical and ICT works, raising compliance costs and slowing cross-border deployment of technicians and equipment.
- Compliance: divergent rules across 27 states
- Impact: slower cross-border resource deployment
- Mitigation: local partnerships, decentralized units
- Outlook: EU harmonization initiatives aim to lower barriers
Industrial policy and digital sovereignty
European industrial policy and digital sovereignty measures favor trusted regional providers, boosting demand for SPIE’s ICT services. The EU Digital Europe Programme allocates €7.5bn (2021–2027) and NextGenerationEU/RRF mobilised €723.8bn for digital transformation, supporting data centers, 5G and FTTx rollouts. NIS2 and emerging sovereign cloud rules tighten vendor qualification, so early compliance can be a clear differentiator for SPIE.
- Policy: favors regional trusted providers
- Funding: €7.5bn Digital Europe, €723.8bn RRF/NextGenerationEU
- Targets: gigabit and 5G for all by 2025
- Risk: NIS2 raises vendor compliance bar
- Opportunity: sovereign cloud alignment = competitive edge
EU Green Deal 55% target spurs retrofit; fragmented rules raise costs
Political drivers: EU Green Deal and Fit for 55 (55% GHG cut by 2030) plus NextGenerationEU (€806.9bn) and REPowerEU boost retrofit, electrification and grid work; public procurement dominates SPIE’s pipeline. Regulatory fragmentation across 27 states raises compliance costs and slows cross-border deployment. Digital sovereignty funds (€7.5bn Digital Europe; RRF/NextGenerationEU €723.8bn) favour regional ICT providers.
| Policy | Funding | Impact | Mitigation |
|---|---|---|---|
| Green Deal/Fit55 | €806.9bn NextGen; €7.5bn Digital | Higher demand; compliance costs | Local partners; NIS2 compliance |
What is included in the product
Detailed Word Document
Explores how macro-environmental factors uniquely affect SPIE across Political, Economic, Social, Technological, Environmental and Legal dimensions, with data-backed trends and region-specific regulatory context; designed for executives and investors with forward-looking insights and ready-to-use formatting for reports and decks.
Customizable Excel Spreadsheet
Concise, visually segmented SPIE PESTLE summary that’s editable for region- or business-specific notes, easily dropped into presentations or shared across teams to streamline risk discussions and strategic alignment.
Economic factors
Interest rates and capex cycles
Rising policy rates (ECB ~4% and US Fed funds ~5.25% mid-2025) compress client capex and real estate development, often delaying building upgrades; projects with sub-3-year paybacks, notably energy-efficiency retrofits, remain resilient. Rate normalization is unlocking deferred projects as financing eases, while SPIE’s maintenance-heavy, recurring-services mix stabilizes revenues through capex cycles.
Energy prices and efficiency ROI
Volatile energy prices sharpen the economics of retrofits, advanced controls and electrification as customers push for projects with measurable savings and payback typically targeted under 5 years. Customers increasingly prioritize contracts with performance guarantees and third-party measurement and verification; many EPCs guarantee 80–100% of projected savings. SPIE can structure energy performance contracts to de-risk outcomes and capture sustained demand as price volatility persists.
Labor costs and skilled workforce scarcity
Tight European labor markets (Eurostat: EU unemployment ~6.5% in 2024) are driving wage inflation for technicians and engineers—sector wage growth ran around mid-single digits in 2023–24—elongating project timelines and compressing SPIE margins. Apprenticeships, training academies and targeted M&A have been used to secure capabilities while pricing discipline and contract indexation (linked to CPI/Wage indices) remain critical to protect margins.
Public–private investment flows
EU NextGenerationEU mobilises €723.8bn and the 2021–27 multiannual financial framework totals €1.074tn, channeling capital into energy, transport and digital infrastructure; Recovery and Resilience Facility projects drive multi-year contracts. Co-financing models create steady frameworks, but administrative and audit delays have shifted many disbursements into 2024–25, causing back-end loaded revenue recognition; SPIE can offset this by combining public contracts with private industrial maintenance to stabilise mix.
- NextGenerationEU €723.8bn
- MFF 2021–27 €1.074tn
- Disbursement shifts into 2024–25 risk back-loaded revenue
- SPIE strategy: public frameworks + private maintenance for stability
Client sector mix and resilience
Diversification across buildings, industry, utilities and ICT cushions sector-specific downturns; SPIE operates in around 30 countries and employed roughly 46,000 people in 2023, supporting scale and cross-sector deployment. Industrial maintenance revenues are typically recurring and less cyclical, while real estate softness can be offset by strong demand in data centers, healthcare and grid projects. Portfolio steering toward high-margin, low-volatility segments supports margin resilience.
EU Green Deal 55% target spurs retrofit; fragmented rules raise costs
Higher policy rates (ECB ~4%, US Fed ~5.25% mid-2025) slow capex but support maintenance-heavy recurring revenue; energy-price volatility increases demand for quick-payback retrofits and EPCs with performance guarantees. Tight EU labor markets (unemployment ~6.5% 2024) push technician wages and favor training/M&A; NextGenerationEU (€723.8bn) and MFF (€1.074tn) sustain multi-year public projects.
| Metric | Value |
|---|---|
| ECB rate | ~4% |
| US Fed funds | ~5.25% |
| EU unemployment (2024) | ~6.5% |
| NextGenerationEU | €723.8bn |
| MFF 2021–27 | €1.074tn |
| SPIE employees (2023) | ~46,000 |
Same Document Delivered
SPIE PESTLE Analysis
The preview shown here is the exact SPIE PESTLE Analysis document you’ll receive after purchase—fully formatted and ready to use. It contains comprehensive Political, Economic, Social, Technological, Legal and Environmental assessments tailored to SPIE, with clear structure and professional layout. No placeholders or surprises.
Original: $10.00
-65%$10.00
$3.50Description
Your Competitive Advantage Starts with This Report
Discover how political shifts, economic cycles, social trends, and emerging technologies are shaping SPIE’s strategic outlook with our concise PESTLE Analysis. This expertly researched snapshot highlights regulatory risks, environmental pressures, and competitive opportunities to inform investment and planning decisions. Buy the full version for the complete, editable deep-dive and actionable recommendations you can use immediately.
Political factors
EU energy and climate policy alignment
The EU Green Deal (climate neutrality by 2050) and Fit for 55 (55% GHG cut by 2030) plus national transition plans are driving demand for efficiency, retrofit and electrification services across sectors where buildings account for about 40% of EU energy use. SPIE can access tenders and subsidies from the MFF (€1.074tn 2021–27) and NextGenerationEU (€806.9bn) linked to decarbonization targets. Policy shifts or elections can delay funding cycles, so close engagement with public stakeholders is essential for pipeline visibility.
Public procurement and infrastructure spending
Large portions of SPIE projects are awarded via public procurement at municipal, regional and national levels, with infrastructure modernization, hospital upgrades and rail/e-grid investments supported by EU stimulus such as NextGenerationEU (€806.9bn) bolstering backlog growth. Budget constraints or austerity can slow awards and extend payment terms, while transparent tendering and strong local presence improve win rates.
Energy security and grid resilience agendas
Geopolitical tensions keep energy security high on political agendas, boosting investment in grid reinforcement, district heating and CHP; EU REPowerEU and the 90% gas storage rule are driving multi-billion-euro programs. Governments increasingly incentivize demand-side management and flexibility services, opening markets for long-term service contracts. These multi-year programs fit SPIE’s multi-technical model, though shifts toward nuclear or LNG can reallocate budgets across segments.
Regional regulatory fragmentation
Regional regulatory fragmentation across the EU 27 member states creates divergent licensing, standards and certification regimes for HVAC, electrical and ICT works, raising compliance costs and slowing cross-border deployment of technicians and equipment.
- Compliance: divergent rules across 27 states
- Impact: slower cross-border resource deployment
- Mitigation: local partnerships, decentralized units
- Outlook: EU harmonization initiatives aim to lower barriers
Industrial policy and digital sovereignty
European industrial policy and digital sovereignty measures favor trusted regional providers, boosting demand for SPIE’s ICT services. The EU Digital Europe Programme allocates €7.5bn (2021–2027) and NextGenerationEU/RRF mobilised €723.8bn for digital transformation, supporting data centers, 5G and FTTx rollouts. NIS2 and emerging sovereign cloud rules tighten vendor qualification, so early compliance can be a clear differentiator for SPIE.
- Policy: favors regional trusted providers
- Funding: €7.5bn Digital Europe, €723.8bn RRF/NextGenerationEU
- Targets: gigabit and 5G for all by 2025
- Risk: NIS2 raises vendor compliance bar
- Opportunity: sovereign cloud alignment = competitive edge
EU Green Deal 55% target spurs retrofit; fragmented rules raise costs
Political drivers: EU Green Deal and Fit for 55 (55% GHG cut by 2030) plus NextGenerationEU (€806.9bn) and REPowerEU boost retrofit, electrification and grid work; public procurement dominates SPIE’s pipeline. Regulatory fragmentation across 27 states raises compliance costs and slows cross-border deployment. Digital sovereignty funds (€7.5bn Digital Europe; RRF/NextGenerationEU €723.8bn) favour regional ICT providers.
| Policy | Funding | Impact | Mitigation |
|---|---|---|---|
| Green Deal/Fit55 | €806.9bn NextGen; €7.5bn Digital | Higher demand; compliance costs | Local partners; NIS2 compliance |
What is included in the product
Detailed Word Document
Explores how macro-environmental factors uniquely affect SPIE across Political, Economic, Social, Technological, Environmental and Legal dimensions, with data-backed trends and region-specific regulatory context; designed for executives and investors with forward-looking insights and ready-to-use formatting for reports and decks.
Customizable Excel Spreadsheet
Concise, visually segmented SPIE PESTLE summary that’s editable for region- or business-specific notes, easily dropped into presentations or shared across teams to streamline risk discussions and strategic alignment.
Economic factors
Interest rates and capex cycles
Rising policy rates (ECB ~4% and US Fed funds ~5.25% mid-2025) compress client capex and real estate development, often delaying building upgrades; projects with sub-3-year paybacks, notably energy-efficiency retrofits, remain resilient. Rate normalization is unlocking deferred projects as financing eases, while SPIE’s maintenance-heavy, recurring-services mix stabilizes revenues through capex cycles.
Energy prices and efficiency ROI
Volatile energy prices sharpen the economics of retrofits, advanced controls and electrification as customers push for projects with measurable savings and payback typically targeted under 5 years. Customers increasingly prioritize contracts with performance guarantees and third-party measurement and verification; many EPCs guarantee 80–100% of projected savings. SPIE can structure energy performance contracts to de-risk outcomes and capture sustained demand as price volatility persists.
Labor costs and skilled workforce scarcity
Tight European labor markets (Eurostat: EU unemployment ~6.5% in 2024) are driving wage inflation for technicians and engineers—sector wage growth ran around mid-single digits in 2023–24—elongating project timelines and compressing SPIE margins. Apprenticeships, training academies and targeted M&A have been used to secure capabilities while pricing discipline and contract indexation (linked to CPI/Wage indices) remain critical to protect margins.
Public–private investment flows
EU NextGenerationEU mobilises €723.8bn and the 2021–27 multiannual financial framework totals €1.074tn, channeling capital into energy, transport and digital infrastructure; Recovery and Resilience Facility projects drive multi-year contracts. Co-financing models create steady frameworks, but administrative and audit delays have shifted many disbursements into 2024–25, causing back-end loaded revenue recognition; SPIE can offset this by combining public contracts with private industrial maintenance to stabilise mix.
- NextGenerationEU €723.8bn
- MFF 2021–27 €1.074tn
- Disbursement shifts into 2024–25 risk back-loaded revenue
- SPIE strategy: public frameworks + private maintenance for stability
Client sector mix and resilience
Diversification across buildings, industry, utilities and ICT cushions sector-specific downturns; SPIE operates in around 30 countries and employed roughly 46,000 people in 2023, supporting scale and cross-sector deployment. Industrial maintenance revenues are typically recurring and less cyclical, while real estate softness can be offset by strong demand in data centers, healthcare and grid projects. Portfolio steering toward high-margin, low-volatility segments supports margin resilience.
EU Green Deal 55% target spurs retrofit; fragmented rules raise costs
Higher policy rates (ECB ~4%, US Fed ~5.25% mid-2025) slow capex but support maintenance-heavy recurring revenue; energy-price volatility increases demand for quick-payback retrofits and EPCs with performance guarantees. Tight EU labor markets (unemployment ~6.5% 2024) push technician wages and favor training/M&A; NextGenerationEU (€723.8bn) and MFF (€1.074tn) sustain multi-year public projects.
| Metric | Value |
|---|---|
| ECB rate | ~4% |
| US Fed funds | ~5.25% |
| EU unemployment (2024) | ~6.5% |
| NextGenerationEU | €723.8bn |
| MFF 2021–27 | €1.074tn |
| SPIE employees (2023) | ~46,000 |
Same Document Delivered
SPIE PESTLE Analysis
The preview shown here is the exact SPIE PESTLE Analysis document you’ll receive after purchase—fully formatted and ready to use. It contains comprehensive Political, Economic, Social, Technological, Legal and Environmental assessments tailored to SPIE, with clear structure and professional layout. No placeholders or surprises.











