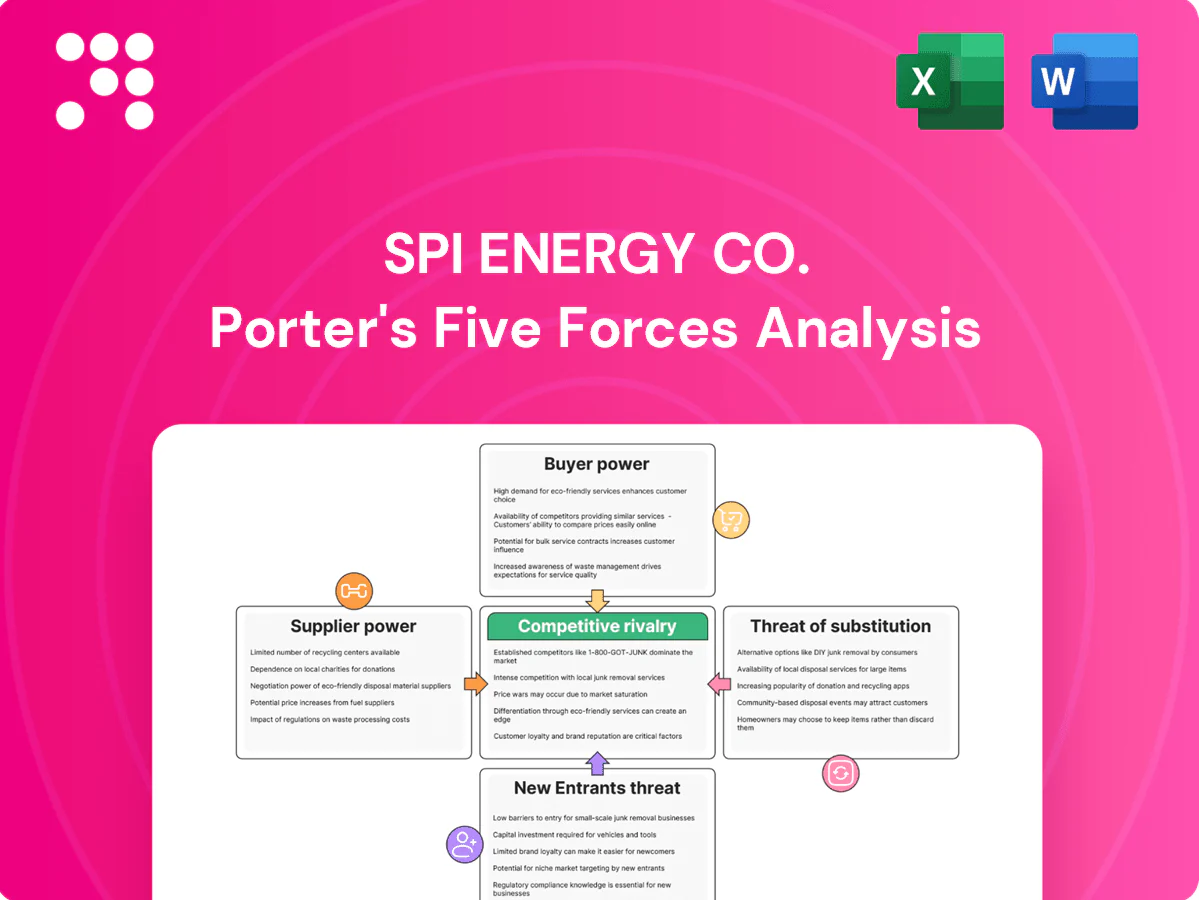
SPI Energy Co. Porter's Five Forces Analysis

Elevate Your Analysis with the Complete Porter's Five Forces Analysis
SPI Energy Co.'s Porter's Five Forces snapshot highlights moderate supplier power, intense rivalry among renewables players, and rising threats from low-cost substitutes and new entrants driven by tech innovation; buyer power varies by contract scale. This brief signals key strategic pressures but omits force-by-force scoring and visuals. Unlock the full Porter's Five Forces Analysis for a consultant-grade, data-rich breakdown to inform investment or strategic decisions.
Suppliers Bargaining Power

Concentrated PV component suppliers
PV modules, inverters and trackers are sourced from a concentrated global base—top five module suppliers accounted for roughly 70% of global shipments in 2023–24, top three inverter vendors ~50% share and NEXTracker held ~35% of tracker shipments in 2024—giving tier‑1 vendors pricing and allocation leverage. SPI Energy’s downstream project focus heightens dependence on timely delivery for construction schedules. Long‑term framework agreements and offtake bankability can mitigate allocation risk, but quality and bankability requirements limit viable substitution. Episodic supply tightness has historically trimmed project IRRs by roughly 100–300 basis points.
Polysilicon and cell price volatility
Polysilicon and cell volatility directly moves module costs—polysilicon averaged about 9 USD/kg in 2024 and global module prices hovered near 0.20 USD/W, so sudden upswings can erode margins on fixed-price EPC or PPA deals. Hedging and a diversified supplier roster mitigate exposure but timing mismatches persist. Index-linked supply contracts have begun shifting some pricing power back toward SPI by tying payments to market indices.

Logistics and BOS component constraints
Shipping, racking, cabling and transformers can become bottlenecks during global disruptions, allowing specialized BOS suppliers to command premiums and extended lead times; SPI Energy faces concentration risk where single-source transformers or racking lines tighten pricing power. Project staging, multisourcing and partial local procurement have reduced exposure and curtailed freight and tariff impacts for many developers.

EV charger OEM and firmware dependence
EV solutions leave SPI Energy exposed to charger hardware, firmware, and chipset vendors whose proprietary stacks create measurable switching costs; by 2024 OCPP adoption reached about 60% in Europe but interoperability gaps still force custom integration. Certification reduces lock-in yet integration hurdles and firmware-dependent features keep suppliers influential through software updates and warranty terms, while white-label strategies trade lower CAPEX for reduced control.
- Supplier influence: firmware, chipsets, warranties
- Switching cost: proprietary stacks, integration effort
- Mitigants: OCPP (~60% EU 2024), certifications
- Strategy: white-label balances cost vs control
Trade policy and tariff pass-through
Trade policy and tariff pass-through: 2024 AD/CVD and country-of-origin rules have narrowed supplier optionality for SPI Energy, raising module input costs and enabling vendors to pass duties through to buyers, eroding purchaser leverage; contract clauses and geographic diversification (APAC, MENA, NA) reduce but do not eliminate exposure as policy shifts can reprice pipelines overnight.
- Tariffs/AD-CVD: raise input costs
- Pass-through: weakens buyer leverage
- Mitigants: contract clauses, diversified sourcing
- Risk: abrupt repricing from policy shifts
Concentrated suppliers, cheap polysilicon ($9/kg) and modules ($0.20/W) squeeze margins
Concentrated suppliers (top5 modules ~70%, top3 inverters ~50%, NEXTracker trackers ~35% 2024) give vendors pricing/allocation leverage; polysilicon ~$9/kg and module ~$0.20/W in 2024 can compress fixed‑price margins. Tariffs/AD‑CVD enable pass‑through; long‑term contracts, multisourcing and index‑linked deals partially mitigate but substitution is limited.
| Supplier | 2024 metric | Price | Impact |
|---|---|---|---|
| Modules | Top5 ~70% | $0.20/W | High |
| Inverters | Top3 ~50% | — | Medium |
| Polysilicon | — | $9/kg | Margin risk |
What is included in the product
 Detailed Word Document
Uncovers key drivers of competition, customer influence, and market entry risks tailored to SPI Energy Co.'s solar and energy storage business. Evaluates supplier and buyer power, substitutes, and emerging disruptive threats with strategic commentary for investors and management.

 Customizable Excel Spreadsheet
A clear, one-sheet summary of SPI Energy’s five forces—ideal for quick strategic decisions, investor briefings, and spotting where competitive pressure or regulatory shifts most threaten growth.
Customers Bargaining Power

Price-sensitive utility and C&I buyers
Utilities and C&I clients run competitive tenders that prioritize LCOE and total lifecycle cost, with 2024 procurements commonly sized in the 100s MW to GW range and PPA tenors of 15–25 years, making small price differentials material. Their scale and abundant developer alternatives materially boost buyer bargaining power. SPI must compete on demonstrable reliability (targeting >99% uptime), proven O&M performance, and flexible financing to protect margins.
Project financing terms as leverage
Buyers often tie awards to bankable equipment and 5–10 year O&M guarantees, using financing covenants (commonly DSCR >1.2) from lenders to strengthen bargaining power. Financing partners thus indirectly enforce stricter specs and penalty clauses. Offering turnkey EPC plus finance neutralizes this edge by internalizing covenants and lender scrutiny. Performance guarantees and availability SLAs (typically >95%) become primary negotiating chips.

Standardized EV charging expectations
Site hosts and fleets compare charger speed, uptime and software fees when choosing providers, with industry uptime targets typically above 99% and software subscriptions often billed per site or connector. Interoperability via OCPP and roaming networks, adopted by a majority of public chargers by 2024, lowers switching costs and strengthens buyer leverage. Bundled services and revenue‑sharing deals can lock in customers, while advanced data analytics and energy management features help justify price premiums.

Information transparency in PV markets
Widespread pricing data and module benchmarks (module ASP ~0.18 USD/W in 2024 per PV InfoLink) enable buyers to negotiate aggressively; reverse auctions in 2024 compressed supplier margins by up to ~20% in major markets. SPI Energy offsets commoditization through differentiated module designs and superior BOS engineering, while a reported on-time delivery rate near 95% cushions price pressure.
- pricing transparency: PV InfoLink 2024 ASP ~0.18 USD/W
- auction impact: margins compressed ~20%
- differentiation: design + BOS engineering
- delivery: ~95% on-time rate
After-sales service dependence
Buyers of SPI Energy systems in 2024 demand robust O&M, warranty backing, and remediation within 48–72 hours; weak service increases churn and forces average contract discounts of 8–12%. Proactive maintenance and defined escalation paths have cut retention losses by up to 20% in comparable peers. Service-level credits align incentives and lower dispute costs.
- O&M response: 48–72h
- Contract discount pressure: 8–12%
- Retention improvement: ~20%
- Service credits: reduce disputes
Reverse auctions, PV ASP 0.18 USD/W cut margins ~20%; uptime >99%
Large utility and C&I buyers exert high bargaining power via reverse auctions, transparent pricing (PV InfoLink 2024 ASP ~0.18 USD/W) and lender covenants, compressing margins ~20%; uptime (>99%), 48–72h O&M response and 15–25y PPAs are primary negotiation levers. SPI offsets pressure with BOS engineering, differentiated modules and ~95% on‑time delivery to protect margins.
| Metric | 2024 Value |
|---|---|
| Module ASP | 0.18 USD/W |
| Margin compression | ~20% |
| Uptime | >99% |
| O&M response | 48–72h |
| On‑time delivery | ~95% |
Preview the Actual Deliverable
SPI Energy Co. Porter's Five Forces Analysis
SPI Energy Co. Porter's Five Forces Analysis assesses supplier power, buyer power, threat of new entrants, substitute products, and competitive rivalry to gauge industry profitability and strategic risks. The report notes moderate supplier leverage for specialized components, strong buyer bargaining from project developers, high rivalry among renewables and cleantech firms, and medium threats from substitutes and entrants. This preview shows the exact document you'll receive immediately after purchase—no surprises, no placeholders.

Elevate Your Analysis with the Complete Porter's Five Forces Analysis
SPI Energy Co.'s Porter's Five Forces snapshot highlights moderate supplier power, intense rivalry among renewables players, and rising threats from low-cost substitutes and new entrants driven by tech innovation; buyer power varies by contract scale. This brief signals key strategic pressures but omits force-by-force scoring and visuals. Unlock the full Porter's Five Forces Analysis for a consultant-grade, data-rich breakdown to inform investment or strategic decisions.
Suppliers Bargaining Power
Concentrated PV component suppliers
PV modules, inverters and trackers are sourced from a concentrated global base—top five module suppliers accounted for roughly 70% of global shipments in 2023–24, top three inverter vendors ~50% share and NEXTracker held ~35% of tracker shipments in 2024—giving tier‑1 vendors pricing and allocation leverage. SPI Energy’s downstream project focus heightens dependence on timely delivery for construction schedules. Long‑term framework agreements and offtake bankability can mitigate allocation risk, but quality and bankability requirements limit viable substitution. Episodic supply tightness has historically trimmed project IRRs by roughly 100–300 basis points.
Polysilicon and cell price volatility
Polysilicon and cell volatility directly moves module costs—polysilicon averaged about 9 USD/kg in 2024 and global module prices hovered near 0.20 USD/W, so sudden upswings can erode margins on fixed-price EPC or PPA deals. Hedging and a diversified supplier roster mitigate exposure but timing mismatches persist. Index-linked supply contracts have begun shifting some pricing power back toward SPI by tying payments to market indices.
Logistics and BOS component constraints
Shipping, racking, cabling and transformers can become bottlenecks during global disruptions, allowing specialized BOS suppliers to command premiums and extended lead times; SPI Energy faces concentration risk where single-source transformers or racking lines tighten pricing power. Project staging, multisourcing and partial local procurement have reduced exposure and curtailed freight and tariff impacts for many developers.
EV charger OEM and firmware dependence
EV solutions leave SPI Energy exposed to charger hardware, firmware, and chipset vendors whose proprietary stacks create measurable switching costs; by 2024 OCPP adoption reached about 60% in Europe but interoperability gaps still force custom integration. Certification reduces lock-in yet integration hurdles and firmware-dependent features keep suppliers influential through software updates and warranty terms, while white-label strategies trade lower CAPEX for reduced control.
- Supplier influence: firmware, chipsets, warranties
- Switching cost: proprietary stacks, integration effort
- Mitigants: OCPP (~60% EU 2024), certifications
- Strategy: white-label balances cost vs control
Trade policy and tariff pass-through
Trade policy and tariff pass-through: 2024 AD/CVD and country-of-origin rules have narrowed supplier optionality for SPI Energy, raising module input costs and enabling vendors to pass duties through to buyers, eroding purchaser leverage; contract clauses and geographic diversification (APAC, MENA, NA) reduce but do not eliminate exposure as policy shifts can reprice pipelines overnight.
- Tariffs/AD-CVD: raise input costs
- Pass-through: weakens buyer leverage
- Mitigants: contract clauses, diversified sourcing
- Risk: abrupt repricing from policy shifts
Concentrated suppliers, cheap polysilicon ($9/kg) and modules ($0.20/W) squeeze margins
Concentrated suppliers (top5 modules ~70%, top3 inverters ~50%, NEXTracker trackers ~35% 2024) give vendors pricing/allocation leverage; polysilicon ~$9/kg and module ~$0.20/W in 2024 can compress fixed‑price margins. Tariffs/AD‑CVD enable pass‑through; long‑term contracts, multisourcing and index‑linked deals partially mitigate but substitution is limited.
| Supplier | 2024 metric | Price | Impact |
|---|---|---|---|
| Modules | Top5 ~70% | $0.20/W | High |
| Inverters | Top3 ~50% | — | Medium |
| Polysilicon | — | $9/kg | Margin risk |
What is included in the product
Detailed Word Document
Uncovers key drivers of competition, customer influence, and market entry risks tailored to SPI Energy Co.'s solar and energy storage business. Evaluates supplier and buyer power, substitutes, and emerging disruptive threats with strategic commentary for investors and management.
Customizable Excel Spreadsheet
A clear, one-sheet summary of SPI Energy’s five forces—ideal for quick strategic decisions, investor briefings, and spotting where competitive pressure or regulatory shifts most threaten growth.
Customers Bargaining Power
Price-sensitive utility and C&I buyers
Utilities and C&I clients run competitive tenders that prioritize LCOE and total lifecycle cost, with 2024 procurements commonly sized in the 100s MW to GW range and PPA tenors of 15–25 years, making small price differentials material. Their scale and abundant developer alternatives materially boost buyer bargaining power. SPI must compete on demonstrable reliability (targeting >99% uptime), proven O&M performance, and flexible financing to protect margins.
Project financing terms as leverage
Buyers often tie awards to bankable equipment and 5–10 year O&M guarantees, using financing covenants (commonly DSCR >1.2) from lenders to strengthen bargaining power. Financing partners thus indirectly enforce stricter specs and penalty clauses. Offering turnkey EPC plus finance neutralizes this edge by internalizing covenants and lender scrutiny. Performance guarantees and availability SLAs (typically >95%) become primary negotiating chips.
Standardized EV charging expectations
Site hosts and fleets compare charger speed, uptime and software fees when choosing providers, with industry uptime targets typically above 99% and software subscriptions often billed per site or connector. Interoperability via OCPP and roaming networks, adopted by a majority of public chargers by 2024, lowers switching costs and strengthens buyer leverage. Bundled services and revenue‑sharing deals can lock in customers, while advanced data analytics and energy management features help justify price premiums.
Information transparency in PV markets
Widespread pricing data and module benchmarks (module ASP ~0.18 USD/W in 2024 per PV InfoLink) enable buyers to negotiate aggressively; reverse auctions in 2024 compressed supplier margins by up to ~20% in major markets. SPI Energy offsets commoditization through differentiated module designs and superior BOS engineering, while a reported on-time delivery rate near 95% cushions price pressure.
- pricing transparency: PV InfoLink 2024 ASP ~0.18 USD/W
- auction impact: margins compressed ~20%
- differentiation: design + BOS engineering
- delivery: ~95% on-time rate
After-sales service dependence
Buyers of SPI Energy systems in 2024 demand robust O&M, warranty backing, and remediation within 48–72 hours; weak service increases churn and forces average contract discounts of 8–12%. Proactive maintenance and defined escalation paths have cut retention losses by up to 20% in comparable peers. Service-level credits align incentives and lower dispute costs.
- O&M response: 48–72h
- Contract discount pressure: 8–12%
- Retention improvement: ~20%
- Service credits: reduce disputes
Reverse auctions, PV ASP 0.18 USD/W cut margins ~20%; uptime >99%
Large utility and C&I buyers exert high bargaining power via reverse auctions, transparent pricing (PV InfoLink 2024 ASP ~0.18 USD/W) and lender covenants, compressing margins ~20%; uptime (>99%), 48–72h O&M response and 15–25y PPAs are primary negotiation levers. SPI offsets pressure with BOS engineering, differentiated modules and ~95% on‑time delivery to protect margins.
| Metric | 2024 Value |
|---|---|
| Module ASP | 0.18 USD/W |
| Margin compression | ~20% |
| Uptime | >99% |
| O&M response | 48–72h |
| On‑time delivery | ~95% |
Preview the Actual Deliverable
SPI Energy Co. Porter's Five Forces Analysis
SPI Energy Co. Porter's Five Forces Analysis assesses supplier power, buyer power, threat of new entrants, substitute products, and competitive rivalry to gauge industry profitability and strategic risks. The report notes moderate supplier leverage for specialized components, strong buyer bargaining from project developers, high rivalry among renewables and cleantech firms, and medium threats from substitutes and entrants. This preview shows the exact document you'll receive immediately after purchase—no surprises, no placeholders.
Original: $10.00
-65%$10.00
$3.50Description
Elevate Your Analysis with the Complete Porter's Five Forces Analysis
SPI Energy Co.'s Porter's Five Forces snapshot highlights moderate supplier power, intense rivalry among renewables players, and rising threats from low-cost substitutes and new entrants driven by tech innovation; buyer power varies by contract scale. This brief signals key strategic pressures but omits force-by-force scoring and visuals. Unlock the full Porter's Five Forces Analysis for a consultant-grade, data-rich breakdown to inform investment or strategic decisions.
Suppliers Bargaining Power
Concentrated PV component suppliers
PV modules, inverters and trackers are sourced from a concentrated global base—top five module suppliers accounted for roughly 70% of global shipments in 2023–24, top three inverter vendors ~50% share and NEXTracker held ~35% of tracker shipments in 2024—giving tier‑1 vendors pricing and allocation leverage. SPI Energy’s downstream project focus heightens dependence on timely delivery for construction schedules. Long‑term framework agreements and offtake bankability can mitigate allocation risk, but quality and bankability requirements limit viable substitution. Episodic supply tightness has historically trimmed project IRRs by roughly 100–300 basis points.
Polysilicon and cell price volatility
Polysilicon and cell volatility directly moves module costs—polysilicon averaged about 9 USD/kg in 2024 and global module prices hovered near 0.20 USD/W, so sudden upswings can erode margins on fixed-price EPC or PPA deals. Hedging and a diversified supplier roster mitigate exposure but timing mismatches persist. Index-linked supply contracts have begun shifting some pricing power back toward SPI by tying payments to market indices.
Logistics and BOS component constraints
Shipping, racking, cabling and transformers can become bottlenecks during global disruptions, allowing specialized BOS suppliers to command premiums and extended lead times; SPI Energy faces concentration risk where single-source transformers or racking lines tighten pricing power. Project staging, multisourcing and partial local procurement have reduced exposure and curtailed freight and tariff impacts for many developers.
EV charger OEM and firmware dependence
EV solutions leave SPI Energy exposed to charger hardware, firmware, and chipset vendors whose proprietary stacks create measurable switching costs; by 2024 OCPP adoption reached about 60% in Europe but interoperability gaps still force custom integration. Certification reduces lock-in yet integration hurdles and firmware-dependent features keep suppliers influential through software updates and warranty terms, while white-label strategies trade lower CAPEX for reduced control.
- Supplier influence: firmware, chipsets, warranties
- Switching cost: proprietary stacks, integration effort
- Mitigants: OCPP (~60% EU 2024), certifications
- Strategy: white-label balances cost vs control
Trade policy and tariff pass-through
Trade policy and tariff pass-through: 2024 AD/CVD and country-of-origin rules have narrowed supplier optionality for SPI Energy, raising module input costs and enabling vendors to pass duties through to buyers, eroding purchaser leverage; contract clauses and geographic diversification (APAC, MENA, NA) reduce but do not eliminate exposure as policy shifts can reprice pipelines overnight.
- Tariffs/AD-CVD: raise input costs
- Pass-through: weakens buyer leverage
- Mitigants: contract clauses, diversified sourcing
- Risk: abrupt repricing from policy shifts
Concentrated suppliers, cheap polysilicon ($9/kg) and modules ($0.20/W) squeeze margins
Concentrated suppliers (top5 modules ~70%, top3 inverters ~50%, NEXTracker trackers ~35% 2024) give vendors pricing/allocation leverage; polysilicon ~$9/kg and module ~$0.20/W in 2024 can compress fixed‑price margins. Tariffs/AD‑CVD enable pass‑through; long‑term contracts, multisourcing and index‑linked deals partially mitigate but substitution is limited.
| Supplier | 2024 metric | Price | Impact |
|---|---|---|---|
| Modules | Top5 ~70% | $0.20/W | High |
| Inverters | Top3 ~50% | — | Medium |
| Polysilicon | — | $9/kg | Margin risk |
What is included in the product
Detailed Word Document
Uncovers key drivers of competition, customer influence, and market entry risks tailored to SPI Energy Co.'s solar and energy storage business. Evaluates supplier and buyer power, substitutes, and emerging disruptive threats with strategic commentary for investors and management.
Customizable Excel Spreadsheet
A clear, one-sheet summary of SPI Energy’s five forces—ideal for quick strategic decisions, investor briefings, and spotting where competitive pressure or regulatory shifts most threaten growth.
Customers Bargaining Power
Price-sensitive utility and C&I buyers
Utilities and C&I clients run competitive tenders that prioritize LCOE and total lifecycle cost, with 2024 procurements commonly sized in the 100s MW to GW range and PPA tenors of 15–25 years, making small price differentials material. Their scale and abundant developer alternatives materially boost buyer bargaining power. SPI must compete on demonstrable reliability (targeting >99% uptime), proven O&M performance, and flexible financing to protect margins.
Project financing terms as leverage
Buyers often tie awards to bankable equipment and 5–10 year O&M guarantees, using financing covenants (commonly DSCR >1.2) from lenders to strengthen bargaining power. Financing partners thus indirectly enforce stricter specs and penalty clauses. Offering turnkey EPC plus finance neutralizes this edge by internalizing covenants and lender scrutiny. Performance guarantees and availability SLAs (typically >95%) become primary negotiating chips.
Standardized EV charging expectations
Site hosts and fleets compare charger speed, uptime and software fees when choosing providers, with industry uptime targets typically above 99% and software subscriptions often billed per site or connector. Interoperability via OCPP and roaming networks, adopted by a majority of public chargers by 2024, lowers switching costs and strengthens buyer leverage. Bundled services and revenue‑sharing deals can lock in customers, while advanced data analytics and energy management features help justify price premiums.
Information transparency in PV markets
Widespread pricing data and module benchmarks (module ASP ~0.18 USD/W in 2024 per PV InfoLink) enable buyers to negotiate aggressively; reverse auctions in 2024 compressed supplier margins by up to ~20% in major markets. SPI Energy offsets commoditization through differentiated module designs and superior BOS engineering, while a reported on-time delivery rate near 95% cushions price pressure.
- pricing transparency: PV InfoLink 2024 ASP ~0.18 USD/W
- auction impact: margins compressed ~20%
- differentiation: design + BOS engineering
- delivery: ~95% on-time rate
After-sales service dependence
Buyers of SPI Energy systems in 2024 demand robust O&M, warranty backing, and remediation within 48–72 hours; weak service increases churn and forces average contract discounts of 8–12%. Proactive maintenance and defined escalation paths have cut retention losses by up to 20% in comparable peers. Service-level credits align incentives and lower dispute costs.
- O&M response: 48–72h
- Contract discount pressure: 8–12%
- Retention improvement: ~20%
- Service credits: reduce disputes
Reverse auctions, PV ASP 0.18 USD/W cut margins ~20%; uptime >99%
Large utility and C&I buyers exert high bargaining power via reverse auctions, transparent pricing (PV InfoLink 2024 ASP ~0.18 USD/W) and lender covenants, compressing margins ~20%; uptime (>99%), 48–72h O&M response and 15–25y PPAs are primary negotiation levers. SPI offsets pressure with BOS engineering, differentiated modules and ~95% on‑time delivery to protect margins.
| Metric | 2024 Value |
|---|---|
| Module ASP | 0.18 USD/W |
| Margin compression | ~20% |
| Uptime | >99% |
| O&M response | 48–72h |
| On‑time delivery | ~95% |
Preview the Actual Deliverable
SPI Energy Co. Porter's Five Forces Analysis
SPI Energy Co. Porter's Five Forces Analysis assesses supplier power, buyer power, threat of new entrants, substitute products, and competitive rivalry to gauge industry profitability and strategic risks. The report notes moderate supplier leverage for specialized components, strong buyer bargaining from project developers, high rivalry among renewables and cleantech firms, and medium threats from substitutes and entrants. This preview shows the exact document you'll receive immediately after purchase—no surprises, no placeholders.











