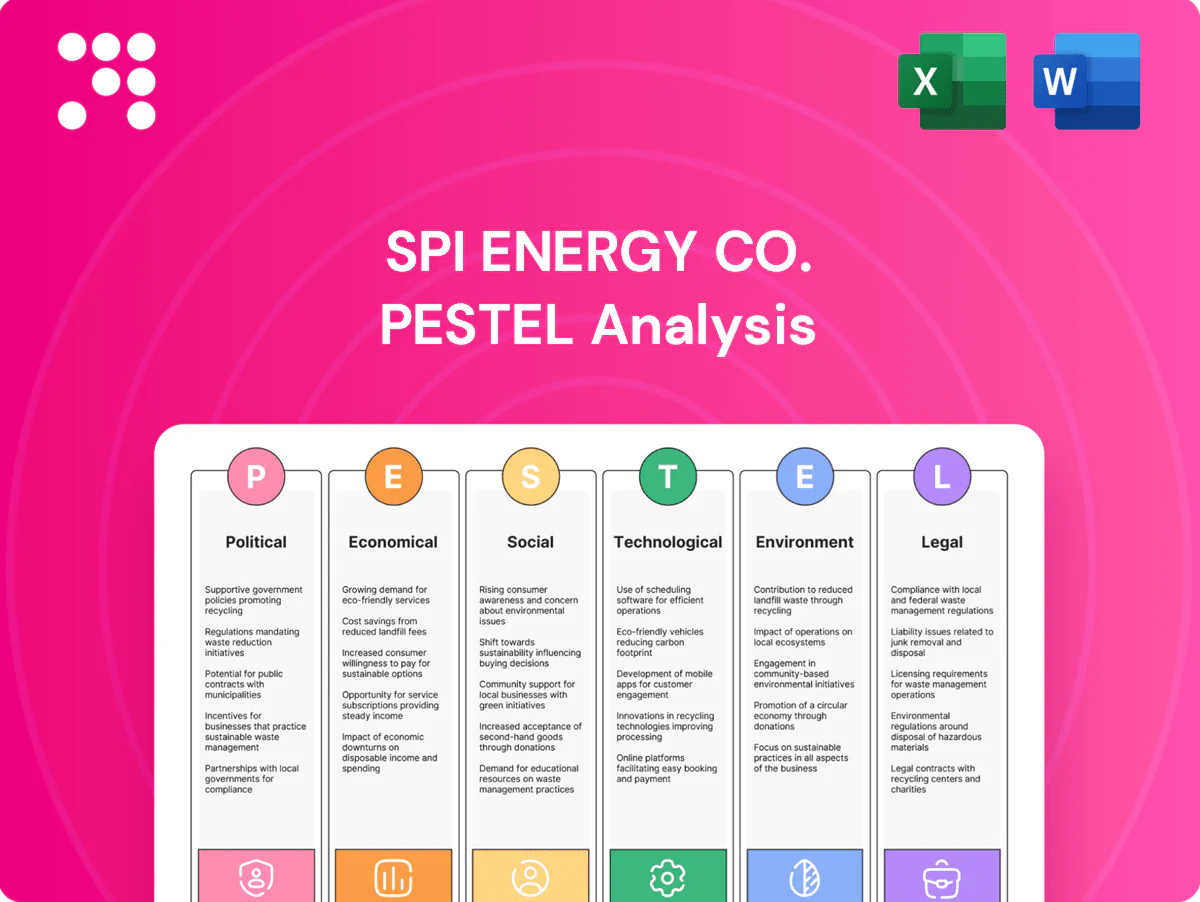
SPI Energy Co. PESTLE Analysis

Your Competitive Advantage Starts with This Report
Discover how political shifts, economic trends, regulation, social preferences, technology advances, and environmental pressures are reshaping SPI Energy Co.’s prospects in our concise PESTLE snapshot. Use these strategic insights to refine investment theses or competitive plans. Purchase the full PESTLE for a detailed, actionable briefing you can download instantly.
Political factors

Renewable incentives and subsidies
National and regional incentives directly shape SPI Energy’s pipeline: the US Inflation Reduction Act set a 30% federal ITC base (with wage/domestic-content adders that can boost credits toward 40–50%), while feed‑in tariffs and grants vary by jurisdiction. Policy stability drives bankability and cost of capital; US interconnection queues exceed 1,100 GW, so sudden step‑downs or clawbacks risk stalled builds and stranded queue positions. Close monitoring and targeted advocacy align bids to incentive cadence and reduce execution risk.
Trade policy and tariffs on PV/EV supply chains
Anti-dumping, countervailing duties and country-of-origin rules in the US and EU have raised module, inverter and charger input costs by up to 30–50% in targeted cases, materially affecting SPI Energy procurement economics. The 2018 US Section 201 tariffs (30% initial, phased down) and recent AD/CVD actions have compressed margins and forced delays in some projects. Diversified sourcing, flexible bills of materials and robust origin-traceability systems are now essential to manage tariff risk and maintain supply continuity.

Grid interconnection and transmission planning
Public utility commission priorities and national grid policy set interconnection timelines and upgrade cost responsibility, with U.S. interconnection backlogs near 1,100 GW in 2024 and upgrade bills often ranging from $50–500m per utility-scale tie‑in. Queue reform and cost-allocation shifts directly affect project IRRs and go/no-go decisions. Utility-scale vs distributed preferences can push SPI Energy toward DER or large‑site pipelines. Proactive engagement with ISOs/TSOs reduces permitting and curtails curtailment risk.

Geopolitical tensions and export controls
Geopolitical tensions in US–China and EU–China relations constrain component flows, limit access to advanced inverter technologies, and dampen financing sentiment for cross-border deals. Sanctions and export controls have already interrupted supplier chains and software dependencies, raising delivery and compliance costs. Higher political risk premiums push up hurdle rates, so scenario planning is essential for resilient portfolio construction.
- Supply-chain disruption
- Tech access restrictions
- Financing risk premium
- Scenario-driven allocation
Local permitting and community politics
County-level zoning, permitting boards, and local stakeholders can accelerate or block SPI Energy sites; industry data in 2024 shows permitting adds 30–180 days and can raise project soft costs by roughly $0.01–$0.03/W. Favorable local leadership often enables expedited approvals and incentives; oppositional groups frequently impose setbacks, vegetative buffers, and visual mitigation rules. Early outreach and community benefits packages measurably improve approval odds.
- Permitting delay: 30–180 days (2024)
- Soft‑cost impact: ~$0.01–$0.03/W
- Common mitigation: setbacks, vegetation, visual screening
- Mitigation: early outreach + benefits packages
30% IRA lifts returns; tariffs and 1,100 GW queue raise execution risk
Policy incentives (IRA base 30%; wage/domestic adders lift to ~40–50%) drive project economics and bidding cadence. Tariffs and AD/CVD actions raised some component costs 30–50%, compressing margins; US interconnection queues ~1,100 GW (2024) heighten execution risk. Permitting delays (30–180 days) and soft‑costs (~$0.01–$0.03/W) plus geopolitics raise financing premiums and require diversified sourcing.
| Metric | 2024/25 | Impact |
|---|---|---|
| Federal ITC | 30% base; 40–50% w/adders | Boosts NPV, alters bid timing |
| Interconnection queue | ~1,100 GW (2024) | Delay/stranding risk |
| Tariff impact | +30–50% input cost | Compresses margins |
| Permitting | 30–180 days; $0.01–$0.03/W | Increases soft costs, delays |
What is included in the product
 Detailed Word Document
Explores how Political, Economic, Social, Technological, Environmental, and Legal forces uniquely affect SPI Energy Co., combining data-driven trends and region-specific regulations to identify risks and growth opportunities for executives, investors, and strategists.

 Customizable Excel Spreadsheet
A concise, visually segmented PESTLE summary of SPI Energy Co. that relieves meeting prep pain—drop-ready for slides, editable with notes for region or business line, and easily shareable for rapid team alignment on external risks and market positioning.
Economic factors

Interest rates and project finance costs
Rising policy rates — US Fed funds 5.25–5.50% and ECB deposit ~4.00% in mid‑2025 — push up WACC and materially cut NPV on long‑dated PPAs, especially beyond 15–20 years. Stricter debt sizing and DSCR covenants reduce feasible leverage; merchant exposure becomes riskier, favoring contracted cash flows. Active hedging and capital recycling help preserve returns.
Module and polysilicon price cycles
Polysilicon spot fell over 60% from 2021 peaks to 2024 lows, and module ASPs compressed roughly 30% to about $0.18/W by Q4 2024, boosting SPI Energy margins and opening lower-LCOE markets while price spikes can stall financing and PPA deals. Manufacturing oversupply drives ASP pressure and supplier stress. Strategic procurement timing, multi-year framework contracts and engineering standardization permit capturing favorable curves and rapid vendor switches.

FX volatility across operating geographies
Revenues and costs across USD, CNY and EUR expose SPI Energy to both translation and transaction risks that can compress reported margins. Established hedging policies and project-level natural currency offsets (local revenues vs local costs) aim to stabilize cash flows. Currency swings materially affect cross-border capex prioritization, often deferring investments in weaker-currency markets. Increasing local debt funding is used to reduce currency mismatches on the balance sheet.

Power market dynamics and PPA competitiveness
EV charging demand growth and utilization
Charger economics hinge on site selection, dwell time and throughput; public DC fast-charger utilization typically ranges 10–25% with top nodes above 40%. Incentives and fleet electrification are accelerating ramps as global EV sales reached ~14 million in 2024 (~18% of new cars), boosting utilization. Competition and pricing wars compress margins in mature nodes while bundled solar-plus-charging can cut payback by ~10–30%.
- Site selection: high dwell = higher throughput
- Utilization: 10–25% typical, peaks >40%
- EV sales: ~14M in 2024 (~18% share)
- Margins: compressed by pricing wars
- Bundled solar: improves payback ~10–30%
30% IRA lifts returns; tariffs and 1,100 GW queue raise execution risk
Higher policy rates (Fed 5.25–5.50% / ECB ~4.00% mid‑2025) raise WACC and reduce NPV on long PPAs; tighter covenants lower leverage and favor contracted cash flows. Supply‑side solar deflation (polysilicon down ~60% vs 2021; module ASP ~$0.18/W in Q4 2024) lowers LCOE but raises merchant risk; currency swings and nodal price volatility (> $20/MWh spreads) drive project prioritization.
| Metric | Value |
|---|---|
| Fed funds (mid‑2025) | 5.25–5.50% |
| ECB deposit (mid‑2025) | ~4.00% |
| Module ASP (Q4 2024) | $0.18/W |
| Polysilicon change (2021–2024) | −~60% |
| EV sales (2024) | ~14M (18%) |
| LMP spreads | > $20/MWh |
Preview Before You Purchase
SPI Energy Co. PESTLE Analysis
The preview shown here is the exact SPI Energy PESTLE Analysis you’ll receive after purchase—fully formatted and ready to use. It covers political, economic, social, technological, legal, and environmental factors with professional structure and actionable insights. No placeholders or surprises; the file is the final version available for immediate download.

Your Competitive Advantage Starts with This Report
Discover how political shifts, economic trends, regulation, social preferences, technology advances, and environmental pressures are reshaping SPI Energy Co.’s prospects in our concise PESTLE snapshot. Use these strategic insights to refine investment theses or competitive plans. Purchase the full PESTLE for a detailed, actionable briefing you can download instantly.
Political factors
Renewable incentives and subsidies
National and regional incentives directly shape SPI Energy’s pipeline: the US Inflation Reduction Act set a 30% federal ITC base (with wage/domestic-content adders that can boost credits toward 40–50%), while feed‑in tariffs and grants vary by jurisdiction. Policy stability drives bankability and cost of capital; US interconnection queues exceed 1,100 GW, so sudden step‑downs or clawbacks risk stalled builds and stranded queue positions. Close monitoring and targeted advocacy align bids to incentive cadence and reduce execution risk.
Trade policy and tariffs on PV/EV supply chains
Anti-dumping, countervailing duties and country-of-origin rules in the US and EU have raised module, inverter and charger input costs by up to 30–50% in targeted cases, materially affecting SPI Energy procurement economics. The 2018 US Section 201 tariffs (30% initial, phased down) and recent AD/CVD actions have compressed margins and forced delays in some projects. Diversified sourcing, flexible bills of materials and robust origin-traceability systems are now essential to manage tariff risk and maintain supply continuity.
Grid interconnection and transmission planning
Public utility commission priorities and national grid policy set interconnection timelines and upgrade cost responsibility, with U.S. interconnection backlogs near 1,100 GW in 2024 and upgrade bills often ranging from $50–500m per utility-scale tie‑in. Queue reform and cost-allocation shifts directly affect project IRRs and go/no-go decisions. Utility-scale vs distributed preferences can push SPI Energy toward DER or large‑site pipelines. Proactive engagement with ISOs/TSOs reduces permitting and curtails curtailment risk.
Geopolitical tensions and export controls
Geopolitical tensions in US–China and EU–China relations constrain component flows, limit access to advanced inverter technologies, and dampen financing sentiment for cross-border deals. Sanctions and export controls have already interrupted supplier chains and software dependencies, raising delivery and compliance costs. Higher political risk premiums push up hurdle rates, so scenario planning is essential for resilient portfolio construction.
- Supply-chain disruption
- Tech access restrictions
- Financing risk premium
- Scenario-driven allocation
Local permitting and community politics
County-level zoning, permitting boards, and local stakeholders can accelerate or block SPI Energy sites; industry data in 2024 shows permitting adds 30–180 days and can raise project soft costs by roughly $0.01–$0.03/W. Favorable local leadership often enables expedited approvals and incentives; oppositional groups frequently impose setbacks, vegetative buffers, and visual mitigation rules. Early outreach and community benefits packages measurably improve approval odds.
- Permitting delay: 30–180 days (2024)
- Soft‑cost impact: ~$0.01–$0.03/W
- Common mitigation: setbacks, vegetation, visual screening
- Mitigation: early outreach + benefits packages
30% IRA lifts returns; tariffs and 1,100 GW queue raise execution risk
Policy incentives (IRA base 30%; wage/domestic adders lift to ~40–50%) drive project economics and bidding cadence. Tariffs and AD/CVD actions raised some component costs 30–50%, compressing margins; US interconnection queues ~1,100 GW (2024) heighten execution risk. Permitting delays (30–180 days) and soft‑costs (~$0.01–$0.03/W) plus geopolitics raise financing premiums and require diversified sourcing.
| Metric | 2024/25 | Impact |
|---|---|---|
| Federal ITC | 30% base; 40–50% w/adders | Boosts NPV, alters bid timing |
| Interconnection queue | ~1,100 GW (2024) | Delay/stranding risk |
| Tariff impact | +30–50% input cost | Compresses margins |
| Permitting | 30–180 days; $0.01–$0.03/W | Increases soft costs, delays |
What is included in the product
Detailed Word Document
Explores how Political, Economic, Social, Technological, Environmental, and Legal forces uniquely affect SPI Energy Co., combining data-driven trends and region-specific regulations to identify risks and growth opportunities for executives, investors, and strategists.
Customizable Excel Spreadsheet
A concise, visually segmented PESTLE summary of SPI Energy Co. that relieves meeting prep pain—drop-ready for slides, editable with notes for region or business line, and easily shareable for rapid team alignment on external risks and market positioning.
Economic factors
Interest rates and project finance costs
Rising policy rates — US Fed funds 5.25–5.50% and ECB deposit ~4.00% in mid‑2025 — push up WACC and materially cut NPV on long‑dated PPAs, especially beyond 15–20 years. Stricter debt sizing and DSCR covenants reduce feasible leverage; merchant exposure becomes riskier, favoring contracted cash flows. Active hedging and capital recycling help preserve returns.
Module and polysilicon price cycles
Polysilicon spot fell over 60% from 2021 peaks to 2024 lows, and module ASPs compressed roughly 30% to about $0.18/W by Q4 2024, boosting SPI Energy margins and opening lower-LCOE markets while price spikes can stall financing and PPA deals. Manufacturing oversupply drives ASP pressure and supplier stress. Strategic procurement timing, multi-year framework contracts and engineering standardization permit capturing favorable curves and rapid vendor switches.
FX volatility across operating geographies
Revenues and costs across USD, CNY and EUR expose SPI Energy to both translation and transaction risks that can compress reported margins. Established hedging policies and project-level natural currency offsets (local revenues vs local costs) aim to stabilize cash flows. Currency swings materially affect cross-border capex prioritization, often deferring investments in weaker-currency markets. Increasing local debt funding is used to reduce currency mismatches on the balance sheet.
Power market dynamics and PPA competitiveness
EV charging demand growth and utilization
Charger economics hinge on site selection, dwell time and throughput; public DC fast-charger utilization typically ranges 10–25% with top nodes above 40%. Incentives and fleet electrification are accelerating ramps as global EV sales reached ~14 million in 2024 (~18% of new cars), boosting utilization. Competition and pricing wars compress margins in mature nodes while bundled solar-plus-charging can cut payback by ~10–30%.
- Site selection: high dwell = higher throughput
- Utilization: 10–25% typical, peaks >40%
- EV sales: ~14M in 2024 (~18% share)
- Margins: compressed by pricing wars
- Bundled solar: improves payback ~10–30%
30% IRA lifts returns; tariffs and 1,100 GW queue raise execution risk
Higher policy rates (Fed 5.25–5.50% / ECB ~4.00% mid‑2025) raise WACC and reduce NPV on long PPAs; tighter covenants lower leverage and favor contracted cash flows. Supply‑side solar deflation (polysilicon down ~60% vs 2021; module ASP ~$0.18/W in Q4 2024) lowers LCOE but raises merchant risk; currency swings and nodal price volatility (> $20/MWh spreads) drive project prioritization.
| Metric | Value |
|---|---|
| Fed funds (mid‑2025) | 5.25–5.50% |
| ECB deposit (mid‑2025) | ~4.00% |
| Module ASP (Q4 2024) | $0.18/W |
| Polysilicon change (2021–2024) | −~60% |
| EV sales (2024) | ~14M (18%) |
| LMP spreads | > $20/MWh |
Preview Before You Purchase
SPI Energy Co. PESTLE Analysis
The preview shown here is the exact SPI Energy PESTLE Analysis you’ll receive after purchase—fully formatted and ready to use. It covers political, economic, social, technological, legal, and environmental factors with professional structure and actionable insights. No placeholders or surprises; the file is the final version available for immediate download.
Original: $10.00
-65%$10.00
$3.50Description
Your Competitive Advantage Starts with This Report
Discover how political shifts, economic trends, regulation, social preferences, technology advances, and environmental pressures are reshaping SPI Energy Co.’s prospects in our concise PESTLE snapshot. Use these strategic insights to refine investment theses or competitive plans. Purchase the full PESTLE for a detailed, actionable briefing you can download instantly.
Political factors
Renewable incentives and subsidies
National and regional incentives directly shape SPI Energy’s pipeline: the US Inflation Reduction Act set a 30% federal ITC base (with wage/domestic-content adders that can boost credits toward 40–50%), while feed‑in tariffs and grants vary by jurisdiction. Policy stability drives bankability and cost of capital; US interconnection queues exceed 1,100 GW, so sudden step‑downs or clawbacks risk stalled builds and stranded queue positions. Close monitoring and targeted advocacy align bids to incentive cadence and reduce execution risk.
Trade policy and tariffs on PV/EV supply chains
Anti-dumping, countervailing duties and country-of-origin rules in the US and EU have raised module, inverter and charger input costs by up to 30–50% in targeted cases, materially affecting SPI Energy procurement economics. The 2018 US Section 201 tariffs (30% initial, phased down) and recent AD/CVD actions have compressed margins and forced delays in some projects. Diversified sourcing, flexible bills of materials and robust origin-traceability systems are now essential to manage tariff risk and maintain supply continuity.
Grid interconnection and transmission planning
Public utility commission priorities and national grid policy set interconnection timelines and upgrade cost responsibility, with U.S. interconnection backlogs near 1,100 GW in 2024 and upgrade bills often ranging from $50–500m per utility-scale tie‑in. Queue reform and cost-allocation shifts directly affect project IRRs and go/no-go decisions. Utility-scale vs distributed preferences can push SPI Energy toward DER or large‑site pipelines. Proactive engagement with ISOs/TSOs reduces permitting and curtails curtailment risk.
Geopolitical tensions and export controls
Geopolitical tensions in US–China and EU–China relations constrain component flows, limit access to advanced inverter technologies, and dampen financing sentiment for cross-border deals. Sanctions and export controls have already interrupted supplier chains and software dependencies, raising delivery and compliance costs. Higher political risk premiums push up hurdle rates, so scenario planning is essential for resilient portfolio construction.
- Supply-chain disruption
- Tech access restrictions
- Financing risk premium
- Scenario-driven allocation
Local permitting and community politics
County-level zoning, permitting boards, and local stakeholders can accelerate or block SPI Energy sites; industry data in 2024 shows permitting adds 30–180 days and can raise project soft costs by roughly $0.01–$0.03/W. Favorable local leadership often enables expedited approvals and incentives; oppositional groups frequently impose setbacks, vegetative buffers, and visual mitigation rules. Early outreach and community benefits packages measurably improve approval odds.
- Permitting delay: 30–180 days (2024)
- Soft‑cost impact: ~$0.01–$0.03/W
- Common mitigation: setbacks, vegetation, visual screening
- Mitigation: early outreach + benefits packages
30% IRA lifts returns; tariffs and 1,100 GW queue raise execution risk
Policy incentives (IRA base 30%; wage/domestic adders lift to ~40–50%) drive project economics and bidding cadence. Tariffs and AD/CVD actions raised some component costs 30–50%, compressing margins; US interconnection queues ~1,100 GW (2024) heighten execution risk. Permitting delays (30–180 days) and soft‑costs (~$0.01–$0.03/W) plus geopolitics raise financing premiums and require diversified sourcing.
| Metric | 2024/25 | Impact |
|---|---|---|
| Federal ITC | 30% base; 40–50% w/adders | Boosts NPV, alters bid timing |
| Interconnection queue | ~1,100 GW (2024) | Delay/stranding risk |
| Tariff impact | +30–50% input cost | Compresses margins |
| Permitting | 30–180 days; $0.01–$0.03/W | Increases soft costs, delays |
What is included in the product
Detailed Word Document
Explores how Political, Economic, Social, Technological, Environmental, and Legal forces uniquely affect SPI Energy Co., combining data-driven trends and region-specific regulations to identify risks and growth opportunities for executives, investors, and strategists.
Customizable Excel Spreadsheet
A concise, visually segmented PESTLE summary of SPI Energy Co. that relieves meeting prep pain—drop-ready for slides, editable with notes for region or business line, and easily shareable for rapid team alignment on external risks and market positioning.
Economic factors
Interest rates and project finance costs
Rising policy rates — US Fed funds 5.25–5.50% and ECB deposit ~4.00% in mid‑2025 — push up WACC and materially cut NPV on long‑dated PPAs, especially beyond 15–20 years. Stricter debt sizing and DSCR covenants reduce feasible leverage; merchant exposure becomes riskier, favoring contracted cash flows. Active hedging and capital recycling help preserve returns.
Module and polysilicon price cycles
Polysilicon spot fell over 60% from 2021 peaks to 2024 lows, and module ASPs compressed roughly 30% to about $0.18/W by Q4 2024, boosting SPI Energy margins and opening lower-LCOE markets while price spikes can stall financing and PPA deals. Manufacturing oversupply drives ASP pressure and supplier stress. Strategic procurement timing, multi-year framework contracts and engineering standardization permit capturing favorable curves and rapid vendor switches.
FX volatility across operating geographies
Revenues and costs across USD, CNY and EUR expose SPI Energy to both translation and transaction risks that can compress reported margins. Established hedging policies and project-level natural currency offsets (local revenues vs local costs) aim to stabilize cash flows. Currency swings materially affect cross-border capex prioritization, often deferring investments in weaker-currency markets. Increasing local debt funding is used to reduce currency mismatches on the balance sheet.
Power market dynamics and PPA competitiveness
EV charging demand growth and utilization
Charger economics hinge on site selection, dwell time and throughput; public DC fast-charger utilization typically ranges 10–25% with top nodes above 40%. Incentives and fleet electrification are accelerating ramps as global EV sales reached ~14 million in 2024 (~18% of new cars), boosting utilization. Competition and pricing wars compress margins in mature nodes while bundled solar-plus-charging can cut payback by ~10–30%.
- Site selection: high dwell = higher throughput
- Utilization: 10–25% typical, peaks >40%
- EV sales: ~14M in 2024 (~18% share)
- Margins: compressed by pricing wars
- Bundled solar: improves payback ~10–30%
30% IRA lifts returns; tariffs and 1,100 GW queue raise execution risk
Higher policy rates (Fed 5.25–5.50% / ECB ~4.00% mid‑2025) raise WACC and reduce NPV on long PPAs; tighter covenants lower leverage and favor contracted cash flows. Supply‑side solar deflation (polysilicon down ~60% vs 2021; module ASP ~$0.18/W in Q4 2024) lowers LCOE but raises merchant risk; currency swings and nodal price volatility (> $20/MWh spreads) drive project prioritization.
| Metric | Value |
|---|---|
| Fed funds (mid‑2025) | 5.25–5.50% |
| ECB deposit (mid‑2025) | ~4.00% |
| Module ASP (Q4 2024) | $0.18/W |
| Polysilicon change (2021–2024) | −~60% |
| EV sales (2024) | ~14M (18%) |
| LMP spreads | > $20/MWh |
Preview Before You Purchase
SPI Energy Co. PESTLE Analysis
The preview shown here is the exact SPI Energy PESTLE Analysis you’ll receive after purchase—fully formatted and ready to use. It covers political, economic, social, technological, legal, and environmental factors with professional structure and actionable insights. No placeholders or surprises; the file is the final version available for immediate download.











