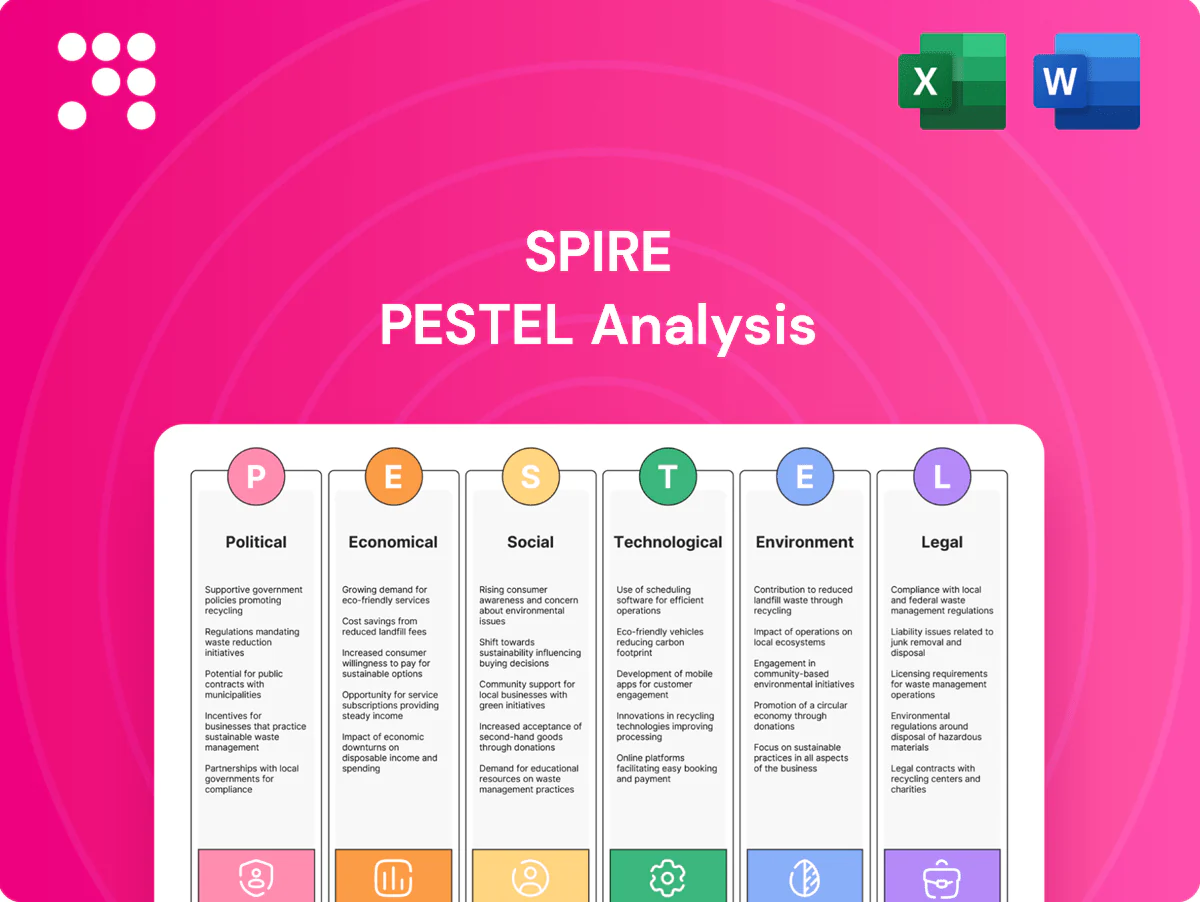
Spire PESTLE Analysis

Make Smarter Strategic Decisions with a Complete PESTEL View
Our Spire PESTLE Analysis reveals how political shifts, economic trends, social dynamics, technological advances, legal changes, and environmental pressures will shape the company’s trajectory; it's written for investors and strategists who need fast, actionable intelligence. Use these insights to anticipate risks, identify growth opportunities, and refine your competitive strategy. Buy the full report now for the complete, downloadable analysis and ready-to-use charts.
Political factors

State utility commission oversight
State public service commissions determine Spire’s rates, allowed ROE (generally ~8–11% across its jurisdictions in 2024) and cost recovery, with regulatory stability enabling long-term capital and safety programs. Adverse rulings can delay capital recovery and increase regulatory lag. Trackers and riders (gas-cost and infrastructure riders in multiple states) bolster cash-flow predictability.
Federal energy policy alignment
FERC jurisdiction over interstate pipelines and PHMSA safety rules directly shape Spire’s interstate operations and compliance costs, requiring federal permitting and integrity management. Shifts in federal permitting priorities have altered timelines for pipeline projects, affecting capital deployment and permitting risk. Recent federal methane initiatives aim to tighten leak detection and reporting, raising potential retrofit costs. Coordination with agencies reduces project risk and improves regulatory credibility.

Infrastructure funding and incentives
Public programs and tax incentives from the Inflation Reduction Act (about 369 billion for clean energy) and the Bipartisan Infrastructure Law (roughly 65 billion for power/grid) can materially lower Spires net capex for modernization, safety, and emissions reduction. Accessing federal and state grants for leak reduction and RNG integration improves project IRRs and payback timelines. Competing policy priorities could redirect funds away from gas networks, so proactive eligibility positioning strengthens capital efficiency and grant capture.

Municipal relations and franchises
City councils and local governments control right-of-way access, franchise renewals and construction timelines, affecting Spire’s pipeline replacements as it serves ~1.7 million customers (2024); community benefits agreements have sped permitting on some projects, while city-level political shifts increase scrutiny of fossil fuel infrastructure.
- Right-of-way access: municipal approval required
- CBA value: reduces permitting delays
- Local scrutiny: raises reputational risk
Geopolitics affecting gas markets
Regulatory ROE ~8–11%, federal funds and LNG exports drive capex pressure
State PSCs set rates/allowed ROE (~8–11% in 2024) and riders that stabilize cash flow; adverse rulings raise regulatory lag. FERC/PHMSA oversight increases compliance, permitting timelines and retrofit costs amid tighter methane rules. Federal programs (IRA $369B; BIL $65B) and US LNG exports (13.6 Bcf/d in 2024) affect capex funding and price volatility.
| Metric | Value |
|---|---|
| Allowed ROE (2024) | ~8–11% |
| Customers (2024) | 1.7M |
| IRA funding | $369B |
| BIL funding | $65B |
| US LNG exports (2024) | 13.6 Bcf/d |
What is included in the product
 Detailed Word Document
Explores how Political, Economic, Social, Technological, Environmental and Legal forces uniquely affect the Spire, with data-backed trends and region/industry context; designed for executives and advisors to identify threats, opportunities and forward-looking scenarios ready for plans, decks, or reports.

 Customizable Excel Spreadsheet
Concise Spire PESTLE summary that distills external risks and opportunities by category, easing meeting prep and enabling fast, aligned strategic decisions.
Economic factors

Interest rates and capital costs
Rising policy rates (fed funds ~5.25–5.50% in 2024–25 and 10‑yr Treasury ~4.3%) push up debt service and WACC, pressuring customer affordability and utility valuation. Allowed ROE often lags market rates until the next rate case, constraining earnings in the interim. Prudent refinancing and laddered maturities reduce rollover risk. Investment‑grade ratings help secure lower-cost funding for multi‑year capex.
Commodity price pass-through
Spire passes natural gas costs to customers through a purchased gas adjustment (PGA), so commodity volatility moves customer bills and arrears risk rather than long-term utility margins. The U.S. Henry Hub average was about 2.96 USD/MMBtu in 2024 (EIA), illustrating the scale of pass-through. Storage optimization and forward hedging programs smooth seasonal spikes, and transparent fuel cost recovery maintains regulatory trust and rate stability.

Customer and load growth
Residential, commercial, and industrial demand trends drive throughput and scale benefits for Spire, which serves roughly 1.7 million customers across Alabama, Mississippi and Missouri, allowing unit-cost dilution as volumes rise.
Economic development in service areas supports new connections and conversions, while efficiency gains from system optimization and demand-side programs can offset some volumetric growth.
Balanced growth planning aligns capex with demonstrable demand to protect returns and support regulated ratebase expansion.

Revenue decoupling and normalization
Revenue decoupling mechanisms at Spire stabilize revenues despite weather or conservation by separating distribution margins from sales volumes, improving earnings visibility for its ~1.7 million customers served as of 2024. Reduced volumetric risk narrows cash flow swings; specific plan design drives timing of recovery and smoothness of monthly cash flows. Clear, transparent communication is required for stakeholder acceptance of periodic adjustments.
- decoupling: stabilizes margins vs volume
- 1.7M customers (2024)
- design dictates recovery timing
- communication ensures stakeholder buy-in
Inflation in labor and materials
Pipeline steel, compressors and contractor costs have risen, squeezing Spire budgets and capital plans; wage inflation is tightening availability of skilled integrity crews, raising project timelines. Escalation clauses and productivity gains can offset some pressure, while timely rate filings help align revenues with higher operating and capital costs.
- Cost pressure: higher steel, compressor, contractor rates
- Labor: wage inflation limits skilled integrity labor
- Mitigants: escalation clauses, productivity improvements
- Regulatory: prompt rate filings to recover costs
Regulatory ROE ~8–11%, federal funds and LNG exports drive capex pressure
Higher policy rates (fed funds ~5.25–5.50% in 2024; 10‑yr ~4.3%) raise WACC and debt service; ROE lags until rate cases. Gas cost pass‑through (Henry Hub ~2.96 USD/MMBtu in 2024) shifts commodity risk to customer bills; decoupling stabilizes margins for ~1.7M customers. Capex and material/labor inflation tighten timelines and recovery needs.
| Metric | Value (2024) |
|---|---|
| Fed funds | 5.25–5.50% |
| 10‑yr Treasury | ~4.3% |
| Henry Hub | 2.96 USD/MMBtu |
| Customers | 1.7M |
Full Version Awaits
Spire PESTLE Analysis
The preview shown here is the exact Spire PESTLE Analysis document you’ll receive after purchase—fully formatted and ready to use. This is the real, finished file with complete political, economic, social, technological, legal and environmental insights. No placeholders, no surprises—download it immediately after checkout.

Make Smarter Strategic Decisions with a Complete PESTEL View
Our Spire PESTLE Analysis reveals how political shifts, economic trends, social dynamics, technological advances, legal changes, and environmental pressures will shape the company’s trajectory; it's written for investors and strategists who need fast, actionable intelligence. Use these insights to anticipate risks, identify growth opportunities, and refine your competitive strategy. Buy the full report now for the complete, downloadable analysis and ready-to-use charts.
Political factors
State utility commission oversight
State public service commissions determine Spire’s rates, allowed ROE (generally ~8–11% across its jurisdictions in 2024) and cost recovery, with regulatory stability enabling long-term capital and safety programs. Adverse rulings can delay capital recovery and increase regulatory lag. Trackers and riders (gas-cost and infrastructure riders in multiple states) bolster cash-flow predictability.
Federal energy policy alignment
FERC jurisdiction over interstate pipelines and PHMSA safety rules directly shape Spire’s interstate operations and compliance costs, requiring federal permitting and integrity management. Shifts in federal permitting priorities have altered timelines for pipeline projects, affecting capital deployment and permitting risk. Recent federal methane initiatives aim to tighten leak detection and reporting, raising potential retrofit costs. Coordination with agencies reduces project risk and improves regulatory credibility.
Infrastructure funding and incentives
Public programs and tax incentives from the Inflation Reduction Act (about 369 billion for clean energy) and the Bipartisan Infrastructure Law (roughly 65 billion for power/grid) can materially lower Spires net capex for modernization, safety, and emissions reduction. Accessing federal and state grants for leak reduction and RNG integration improves project IRRs and payback timelines. Competing policy priorities could redirect funds away from gas networks, so proactive eligibility positioning strengthens capital efficiency and grant capture.
Municipal relations and franchises
City councils and local governments control right-of-way access, franchise renewals and construction timelines, affecting Spire’s pipeline replacements as it serves ~1.7 million customers (2024); community benefits agreements have sped permitting on some projects, while city-level political shifts increase scrutiny of fossil fuel infrastructure.
- Right-of-way access: municipal approval required
- CBA value: reduces permitting delays
- Local scrutiny: raises reputational risk
Geopolitics affecting gas markets
Regulatory ROE ~8–11%, federal funds and LNG exports drive capex pressure
State PSCs set rates/allowed ROE (~8–11% in 2024) and riders that stabilize cash flow; adverse rulings raise regulatory lag. FERC/PHMSA oversight increases compliance, permitting timelines and retrofit costs amid tighter methane rules. Federal programs (IRA $369B; BIL $65B) and US LNG exports (13.6 Bcf/d in 2024) affect capex funding and price volatility.
| Metric | Value |
|---|---|
| Allowed ROE (2024) | ~8–11% |
| Customers (2024) | 1.7M |
| IRA funding | $369B |
| BIL funding | $65B |
| US LNG exports (2024) | 13.6 Bcf/d |
What is included in the product
Detailed Word Document
Explores how Political, Economic, Social, Technological, Environmental and Legal forces uniquely affect the Spire, with data-backed trends and region/industry context; designed for executives and advisors to identify threats, opportunities and forward-looking scenarios ready for plans, decks, or reports.
Customizable Excel Spreadsheet
Concise Spire PESTLE summary that distills external risks and opportunities by category, easing meeting prep and enabling fast, aligned strategic decisions.
Economic factors
Interest rates and capital costs
Rising policy rates (fed funds ~5.25–5.50% in 2024–25 and 10‑yr Treasury ~4.3%) push up debt service and WACC, pressuring customer affordability and utility valuation. Allowed ROE often lags market rates until the next rate case, constraining earnings in the interim. Prudent refinancing and laddered maturities reduce rollover risk. Investment‑grade ratings help secure lower-cost funding for multi‑year capex.
Commodity price pass-through
Spire passes natural gas costs to customers through a purchased gas adjustment (PGA), so commodity volatility moves customer bills and arrears risk rather than long-term utility margins. The U.S. Henry Hub average was about 2.96 USD/MMBtu in 2024 (EIA), illustrating the scale of pass-through. Storage optimization and forward hedging programs smooth seasonal spikes, and transparent fuel cost recovery maintains regulatory trust and rate stability.
Customer and load growth
Residential, commercial, and industrial demand trends drive throughput and scale benefits for Spire, which serves roughly 1.7 million customers across Alabama, Mississippi and Missouri, allowing unit-cost dilution as volumes rise.
Economic development in service areas supports new connections and conversions, while efficiency gains from system optimization and demand-side programs can offset some volumetric growth.
Balanced growth planning aligns capex with demonstrable demand to protect returns and support regulated ratebase expansion.
Revenue decoupling and normalization
Revenue decoupling mechanisms at Spire stabilize revenues despite weather or conservation by separating distribution margins from sales volumes, improving earnings visibility for its ~1.7 million customers served as of 2024. Reduced volumetric risk narrows cash flow swings; specific plan design drives timing of recovery and smoothness of monthly cash flows. Clear, transparent communication is required for stakeholder acceptance of periodic adjustments.
- decoupling: stabilizes margins vs volume
- 1.7M customers (2024)
- design dictates recovery timing
- communication ensures stakeholder buy-in
Inflation in labor and materials
Pipeline steel, compressors and contractor costs have risen, squeezing Spire budgets and capital plans; wage inflation is tightening availability of skilled integrity crews, raising project timelines. Escalation clauses and productivity gains can offset some pressure, while timely rate filings help align revenues with higher operating and capital costs.
- Cost pressure: higher steel, compressor, contractor rates
- Labor: wage inflation limits skilled integrity labor
- Mitigants: escalation clauses, productivity improvements
- Regulatory: prompt rate filings to recover costs
Regulatory ROE ~8–11%, federal funds and LNG exports drive capex pressure
Higher policy rates (fed funds ~5.25–5.50% in 2024; 10‑yr ~4.3%) raise WACC and debt service; ROE lags until rate cases. Gas cost pass‑through (Henry Hub ~2.96 USD/MMBtu in 2024) shifts commodity risk to customer bills; decoupling stabilizes margins for ~1.7M customers. Capex and material/labor inflation tighten timelines and recovery needs.
| Metric | Value (2024) |
|---|---|
| Fed funds | 5.25–5.50% |
| 10‑yr Treasury | ~4.3% |
| Henry Hub | 2.96 USD/MMBtu |
| Customers | 1.7M |
Full Version Awaits
Spire PESTLE Analysis
The preview shown here is the exact Spire PESTLE Analysis document you’ll receive after purchase—fully formatted and ready to use. This is the real, finished file with complete political, economic, social, technological, legal and environmental insights. No placeholders, no surprises—download it immediately after checkout.
Original: $10.00
-65%$10.00
$3.50Description
Make Smarter Strategic Decisions with a Complete PESTEL View
Our Spire PESTLE Analysis reveals how political shifts, economic trends, social dynamics, technological advances, legal changes, and environmental pressures will shape the company’s trajectory; it's written for investors and strategists who need fast, actionable intelligence. Use these insights to anticipate risks, identify growth opportunities, and refine your competitive strategy. Buy the full report now for the complete, downloadable analysis and ready-to-use charts.
Political factors
State utility commission oversight
State public service commissions determine Spire’s rates, allowed ROE (generally ~8–11% across its jurisdictions in 2024) and cost recovery, with regulatory stability enabling long-term capital and safety programs. Adverse rulings can delay capital recovery and increase regulatory lag. Trackers and riders (gas-cost and infrastructure riders in multiple states) bolster cash-flow predictability.
Federal energy policy alignment
FERC jurisdiction over interstate pipelines and PHMSA safety rules directly shape Spire’s interstate operations and compliance costs, requiring federal permitting and integrity management. Shifts in federal permitting priorities have altered timelines for pipeline projects, affecting capital deployment and permitting risk. Recent federal methane initiatives aim to tighten leak detection and reporting, raising potential retrofit costs. Coordination with agencies reduces project risk and improves regulatory credibility.
Infrastructure funding and incentives
Public programs and tax incentives from the Inflation Reduction Act (about 369 billion for clean energy) and the Bipartisan Infrastructure Law (roughly 65 billion for power/grid) can materially lower Spires net capex for modernization, safety, and emissions reduction. Accessing federal and state grants for leak reduction and RNG integration improves project IRRs and payback timelines. Competing policy priorities could redirect funds away from gas networks, so proactive eligibility positioning strengthens capital efficiency and grant capture.
Municipal relations and franchises
City councils and local governments control right-of-way access, franchise renewals and construction timelines, affecting Spire’s pipeline replacements as it serves ~1.7 million customers (2024); community benefits agreements have sped permitting on some projects, while city-level political shifts increase scrutiny of fossil fuel infrastructure.
- Right-of-way access: municipal approval required
- CBA value: reduces permitting delays
- Local scrutiny: raises reputational risk
Geopolitics affecting gas markets
Regulatory ROE ~8–11%, federal funds and LNG exports drive capex pressure
State PSCs set rates/allowed ROE (~8–11% in 2024) and riders that stabilize cash flow; adverse rulings raise regulatory lag. FERC/PHMSA oversight increases compliance, permitting timelines and retrofit costs amid tighter methane rules. Federal programs (IRA $369B; BIL $65B) and US LNG exports (13.6 Bcf/d in 2024) affect capex funding and price volatility.
| Metric | Value |
|---|---|
| Allowed ROE (2024) | ~8–11% |
| Customers (2024) | 1.7M |
| IRA funding | $369B |
| BIL funding | $65B |
| US LNG exports (2024) | 13.6 Bcf/d |
What is included in the product
Detailed Word Document
Explores how Political, Economic, Social, Technological, Environmental and Legal forces uniquely affect the Spire, with data-backed trends and region/industry context; designed for executives and advisors to identify threats, opportunities and forward-looking scenarios ready for plans, decks, or reports.
Customizable Excel Spreadsheet
Concise Spire PESTLE summary that distills external risks and opportunities by category, easing meeting prep and enabling fast, aligned strategic decisions.
Economic factors
Interest rates and capital costs
Rising policy rates (fed funds ~5.25–5.50% in 2024–25 and 10‑yr Treasury ~4.3%) push up debt service and WACC, pressuring customer affordability and utility valuation. Allowed ROE often lags market rates until the next rate case, constraining earnings in the interim. Prudent refinancing and laddered maturities reduce rollover risk. Investment‑grade ratings help secure lower-cost funding for multi‑year capex.
Commodity price pass-through
Spire passes natural gas costs to customers through a purchased gas adjustment (PGA), so commodity volatility moves customer bills and arrears risk rather than long-term utility margins. The U.S. Henry Hub average was about 2.96 USD/MMBtu in 2024 (EIA), illustrating the scale of pass-through. Storage optimization and forward hedging programs smooth seasonal spikes, and transparent fuel cost recovery maintains regulatory trust and rate stability.
Customer and load growth
Residential, commercial, and industrial demand trends drive throughput and scale benefits for Spire, which serves roughly 1.7 million customers across Alabama, Mississippi and Missouri, allowing unit-cost dilution as volumes rise.
Economic development in service areas supports new connections and conversions, while efficiency gains from system optimization and demand-side programs can offset some volumetric growth.
Balanced growth planning aligns capex with demonstrable demand to protect returns and support regulated ratebase expansion.
Revenue decoupling and normalization
Revenue decoupling mechanisms at Spire stabilize revenues despite weather or conservation by separating distribution margins from sales volumes, improving earnings visibility for its ~1.7 million customers served as of 2024. Reduced volumetric risk narrows cash flow swings; specific plan design drives timing of recovery and smoothness of monthly cash flows. Clear, transparent communication is required for stakeholder acceptance of periodic adjustments.
- decoupling: stabilizes margins vs volume
- 1.7M customers (2024)
- design dictates recovery timing
- communication ensures stakeholder buy-in
Inflation in labor and materials
Pipeline steel, compressors and contractor costs have risen, squeezing Spire budgets and capital plans; wage inflation is tightening availability of skilled integrity crews, raising project timelines. Escalation clauses and productivity gains can offset some pressure, while timely rate filings help align revenues with higher operating and capital costs.
- Cost pressure: higher steel, compressor, contractor rates
- Labor: wage inflation limits skilled integrity labor
- Mitigants: escalation clauses, productivity improvements
- Regulatory: prompt rate filings to recover costs
Regulatory ROE ~8–11%, federal funds and LNG exports drive capex pressure
Higher policy rates (fed funds ~5.25–5.50% in 2024; 10‑yr ~4.3%) raise WACC and debt service; ROE lags until rate cases. Gas cost pass‑through (Henry Hub ~2.96 USD/MMBtu in 2024) shifts commodity risk to customer bills; decoupling stabilizes margins for ~1.7M customers. Capex and material/labor inflation tighten timelines and recovery needs.
| Metric | Value (2024) |
|---|---|
| Fed funds | 5.25–5.50% |
| 10‑yr Treasury | ~4.3% |
| Henry Hub | 2.96 USD/MMBtu |
| Customers | 1.7M |
Full Version Awaits
Spire PESTLE Analysis
The preview shown here is the exact Spire PESTLE Analysis document you’ll receive after purchase—fully formatted and ready to use. This is the real, finished file with complete political, economic, social, technological, legal and environmental insights. No placeholders, no surprises—download it immediately after checkout.











