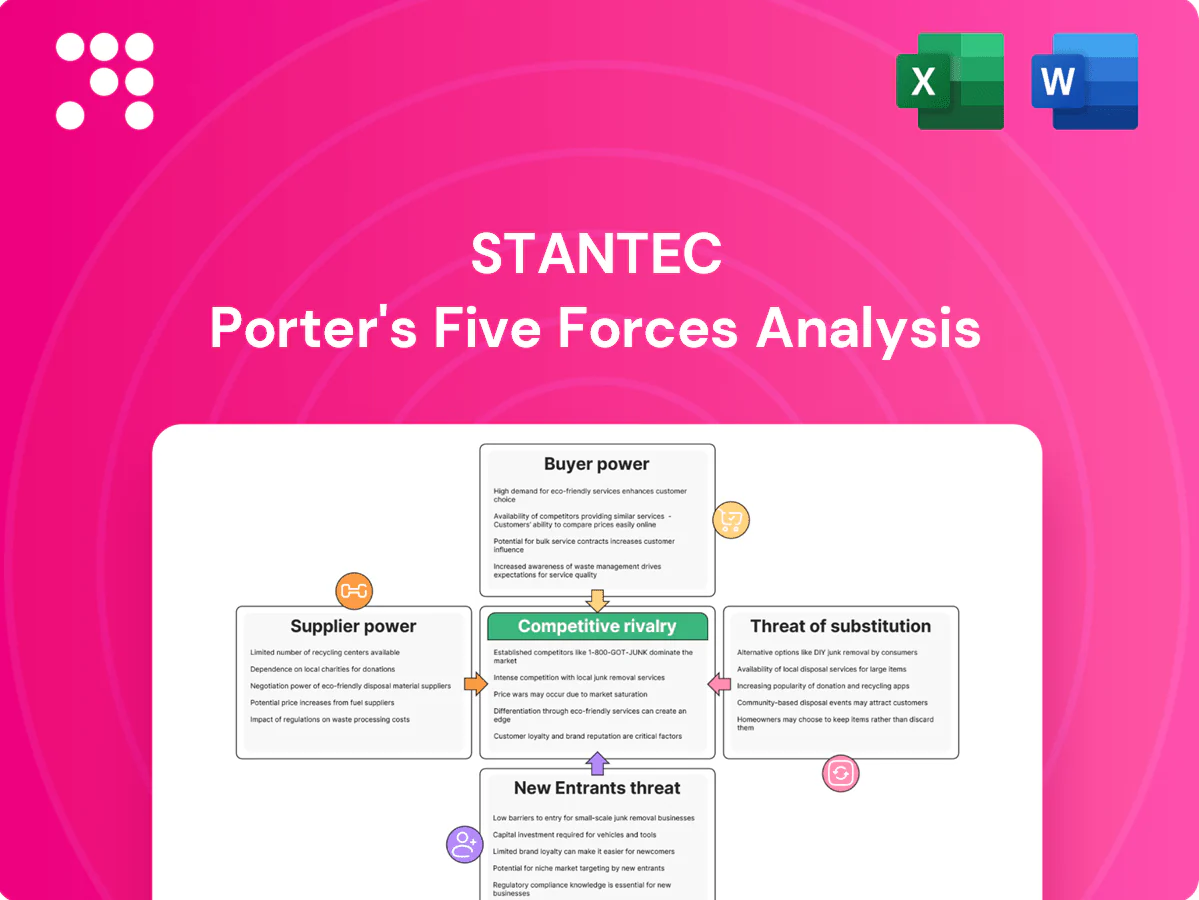
Stantec Porter's Five Forces Analysis

A Must-Have Tool for Decision-Makers
Stantec faces moderate rivalry with large firms and niche specialists, variable buyer power from institutional clients, and supplier influence in specialized engineering inputs; barriers to entry are significant but niche substitutes and project-based competition pose ongoing threats. This brief snapshot only scratches the surface. Unlock the full Porter's Five Forces Analysis to explore Stantec’s competitive dynamics, market pressures, and strategic advantages in detail.
Suppliers Bargaining Power

Specialized talent scarcity
Stantec relies on niche engineers, architects and environmental scientists and employed approximately 27,000 professionals in 2024, making specialized talent scarcity a material constraint. Limited supply has pushed industry wage growth to roughly 5–7% in 2024, raising retention and recruitment costs and strengthening labor supplier power. Union rules and professional licensing further restrict switching, while investments in talent pipelines and employer branding help moderate this pressure.
Critical software and data tools
Critical design platforms (Autodesk, Esri, Bentley) remain concentrated in 2024, and subscription pricing plus high switching and interoperability costs amplify supplier leverage. License restrictions or outages have caused documented project delays and cost overruns on major infrastructure programs. Stantec mitigates risk through multi-vendor standards, open geospatial formats and selective in-house tool development to lower dependency.

Subconsultants and specialty firms
Complex projects force Stantec to hire niche subconsultants for geotechnical, environmental permitting and surveys, often representing significant scope and permitting lead times. Limited local availability and client preapproval lists push rates higher, while schedule-critical scopes give subs added negotiating clout. Preferred networks and master service agreements in 2024 procurement studies show typical cost containment savings of about 10-15%.

Regulatory testing and labs
Environmental testing, materials labs and certification bodies are regionally concentrated, often requiring ISO/IEC 17025 accreditation; turnaround times and accreditation needs give these suppliers measurable leverage. Rush fees (commonly up to ~30%) and capacity bottlenecks compress project margins, while early booking and using alternate accredited providers reduce risk.
- Regional concentration: accreditation hubs
- Accreditation: ISO/IEC 17025 required
- Rush fees: ~30% premium
- Mitigation: early booking, alternate accredited labs
Equipment and field services
Supply power: 27k, pay 5–7%, lead 12–24w
Supplier power is elevated: 27,000 specialized staff in 2024 and 5–7% industry wage growth tighten labor supply; concentrated software vendors (Autodesk/Esri/Bentley) raise switching costs; niche subs, labs and gear have long lead times (12–24 weeks) and rush fees ~30%, while pooled procurement and MSAs capture typical savings of 5–15%.
| Item | 2024 metric | Impact |
|---|---|---|
| Specialized labor | 27,000; wages +5–7% | Higher retention cost |
| Software | 3 major vendors | High switching cost |
| Labs/rush fees | ~30% premium | Margin compression |
| Equipment lead time | 12–24 weeks | Scheduling risk |
What is included in the product
 Detailed Word Document
Tailored Porter's Five Forces analysis for Stantec that uncovers competitive drivers, supplier and buyer power, barriers to entry, substitutes and disruptive threats, providing strategic commentary and an editable Word format for easy inclusion in reports and investor materials.

 Customizable Excel Spreadsheet
One-sheet Stantec Porter's Five Forces that instantly maps competitive pressure with a customizable spider chart—perfect for quick strategic decisions and boardroom slides. Easily swap in your data, duplicate scenarios (pre/post regulation) and integrate into dashboards without macros.
Customers Bargaining Power

Sophisticated public owners
Governments and infrastructure agencies run formal RFPs with price-weighted scoring and, given public procurement represents about 12% of GDP in OECD countries (OECD, 2024), large volumes and multi-year framework agreements create strong buyer bargaining power. Transparency and disclosure rules limit margin flexibility, while superior technical scoring and documented past performance can offset price pressure.
Corporate clients with alternatives
In 2024 private developers and utilities increasingly benchmarked fees across multiple global firms and routinely unbundled scopes to push fixed-fee or lump-sum contracts, intensifying fee pressure and transferring project risk to consultants. This compresses margins and raises variability in cashflow timing. Deep client relationships and bundled value-add services remain the main defenses against switching.

Project concentration risk
Mega-projects (typically >US$1bn) create concentrated backlog that gives buyers leverage on pricing and contract terms. Change-order disputes are common, with variations often representing roughly 5–15% of contract value under tight budgets. Extended payment terms and 5–10% holdbacks strain Stantec’s working capital and cash conversion. Broad portfolio diversification across sectors and geographies helps mitigate buyer power.

Data-driven procurement
Clients increasingly use KPI dashboards and cost databases to challenge rates, with procurement digitization delivering 10-20% sourcing cost reductions per McKinsey; standardized deliverables and benchmarking make vendor comparison easier. Performance clauses and penalties are more common, raising commercial pressure. Demonstrable outcome metrics and digital twins enable shift toward value-based pricing tied to measurable outcomes.
- KPI dashboards
- Cost databases
- Standardized deliverables
- Performance clauses
- Digital twins/value pricing
Sustainability-driven demands
Clients increasingly demand ESG outcomes, net-zero pathways and resilient design, pushing firms to offer specialized credentials as table stakes while comparisons shift toward cost; Bloomberg Intelligence reports global ESG assets reached 40.5 trillion USD in 2023, underpinning intense client scrutiny. High-stakes sustainability goals permit expertise premiums, and proven impact (measured reporting, verified carbon reductions) buys negotiating room despite price sensitivity.
- ESG demand
- Net-zero pathways
- Resilient design
- Credentials = table stakes
- Expertise premium
- Proven impact = leverage
Public and mega-project buyers push 5–20% pricing pressure
Public procurement (~12% GDP OECD, OECD 2024) and mega-projects concentrate volume and force price-weighted RFPs; change orders often equal 5–15% of contract value, with 5–10% holdbacks. Private developers benchmark fees globally and unbundle scopes, driving 10–20% fee pressure via digitized sourcing (McKinsey). ESG demand (global ESG assets US$40.5trn, 2023) creates credential premiums but overall stronger buyer bargaining power.
| Buyer type | Leverage | Margin impact |
|---|---|---|
| Public | High | Price-weighted RFPs |
| Private | Medium-High | 10–20% fee pressure |
| Mega-projects | High | 5–15% change orders |
Same Document Delivered
Stantec Porter's Five Forces Analysis
This preview of the Stantec Porter's Five Forces Analysis shows the exact document you'll receive immediately after purchase—fully formatted and ready to use. No mockups, placeholders, or samples: the file available for instant download is precisely what you see here. Buy now and get immediate access to this complete, professionally written analysis.

A Must-Have Tool for Decision-Makers
Stantec faces moderate rivalry with large firms and niche specialists, variable buyer power from institutional clients, and supplier influence in specialized engineering inputs; barriers to entry are significant but niche substitutes and project-based competition pose ongoing threats. This brief snapshot only scratches the surface. Unlock the full Porter's Five Forces Analysis to explore Stantec’s competitive dynamics, market pressures, and strategic advantages in detail.
Suppliers Bargaining Power
Specialized talent scarcity
Stantec relies on niche engineers, architects and environmental scientists and employed approximately 27,000 professionals in 2024, making specialized talent scarcity a material constraint. Limited supply has pushed industry wage growth to roughly 5–7% in 2024, raising retention and recruitment costs and strengthening labor supplier power. Union rules and professional licensing further restrict switching, while investments in talent pipelines and employer branding help moderate this pressure.
Critical software and data tools
Critical design platforms (Autodesk, Esri, Bentley) remain concentrated in 2024, and subscription pricing plus high switching and interoperability costs amplify supplier leverage. License restrictions or outages have caused documented project delays and cost overruns on major infrastructure programs. Stantec mitigates risk through multi-vendor standards, open geospatial formats and selective in-house tool development to lower dependency.
Subconsultants and specialty firms
Complex projects force Stantec to hire niche subconsultants for geotechnical, environmental permitting and surveys, often representing significant scope and permitting lead times. Limited local availability and client preapproval lists push rates higher, while schedule-critical scopes give subs added negotiating clout. Preferred networks and master service agreements in 2024 procurement studies show typical cost containment savings of about 10-15%.
Regulatory testing and labs
Environmental testing, materials labs and certification bodies are regionally concentrated, often requiring ISO/IEC 17025 accreditation; turnaround times and accreditation needs give these suppliers measurable leverage. Rush fees (commonly up to ~30%) and capacity bottlenecks compress project margins, while early booking and using alternate accredited providers reduce risk.
- Regional concentration: accreditation hubs
- Accreditation: ISO/IEC 17025 required
- Rush fees: ~30% premium
- Mitigation: early booking, alternate accredited labs
Equipment and field services
Supply power: 27k, pay 5–7%, lead 12–24w
Supplier power is elevated: 27,000 specialized staff in 2024 and 5–7% industry wage growth tighten labor supply; concentrated software vendors (Autodesk/Esri/Bentley) raise switching costs; niche subs, labs and gear have long lead times (12–24 weeks) and rush fees ~30%, while pooled procurement and MSAs capture typical savings of 5–15%.
| Item | 2024 metric | Impact |
|---|---|---|
| Specialized labor | 27,000; wages +5–7% | Higher retention cost |
| Software | 3 major vendors | High switching cost |
| Labs/rush fees | ~30% premium | Margin compression |
| Equipment lead time | 12–24 weeks | Scheduling risk |
What is included in the product
Detailed Word Document
Tailored Porter's Five Forces analysis for Stantec that uncovers competitive drivers, supplier and buyer power, barriers to entry, substitutes and disruptive threats, providing strategic commentary and an editable Word format for easy inclusion in reports and investor materials.
Customizable Excel Spreadsheet
One-sheet Stantec Porter's Five Forces that instantly maps competitive pressure with a customizable spider chart—perfect for quick strategic decisions and boardroom slides. Easily swap in your data, duplicate scenarios (pre/post regulation) and integrate into dashboards without macros.
Customers Bargaining Power
Sophisticated public owners
Governments and infrastructure agencies run formal RFPs with price-weighted scoring and, given public procurement represents about 12% of GDP in OECD countries (OECD, 2024), large volumes and multi-year framework agreements create strong buyer bargaining power. Transparency and disclosure rules limit margin flexibility, while superior technical scoring and documented past performance can offset price pressure.
Corporate clients with alternatives
In 2024 private developers and utilities increasingly benchmarked fees across multiple global firms and routinely unbundled scopes to push fixed-fee or lump-sum contracts, intensifying fee pressure and transferring project risk to consultants. This compresses margins and raises variability in cashflow timing. Deep client relationships and bundled value-add services remain the main defenses against switching.
Project concentration risk
Mega-projects (typically >US$1bn) create concentrated backlog that gives buyers leverage on pricing and contract terms. Change-order disputes are common, with variations often representing roughly 5–15% of contract value under tight budgets. Extended payment terms and 5–10% holdbacks strain Stantec’s working capital and cash conversion. Broad portfolio diversification across sectors and geographies helps mitigate buyer power.
Data-driven procurement
Clients increasingly use KPI dashboards and cost databases to challenge rates, with procurement digitization delivering 10-20% sourcing cost reductions per McKinsey; standardized deliverables and benchmarking make vendor comparison easier. Performance clauses and penalties are more common, raising commercial pressure. Demonstrable outcome metrics and digital twins enable shift toward value-based pricing tied to measurable outcomes.
- KPI dashboards
- Cost databases
- Standardized deliverables
- Performance clauses
- Digital twins/value pricing
Sustainability-driven demands
Clients increasingly demand ESG outcomes, net-zero pathways and resilient design, pushing firms to offer specialized credentials as table stakes while comparisons shift toward cost; Bloomberg Intelligence reports global ESG assets reached 40.5 trillion USD in 2023, underpinning intense client scrutiny. High-stakes sustainability goals permit expertise premiums, and proven impact (measured reporting, verified carbon reductions) buys negotiating room despite price sensitivity.
- ESG demand
- Net-zero pathways
- Resilient design
- Credentials = table stakes
- Expertise premium
- Proven impact = leverage
Public and mega-project buyers push 5–20% pricing pressure
Public procurement (~12% GDP OECD, OECD 2024) and mega-projects concentrate volume and force price-weighted RFPs; change orders often equal 5–15% of contract value, with 5–10% holdbacks. Private developers benchmark fees globally and unbundle scopes, driving 10–20% fee pressure via digitized sourcing (McKinsey). ESG demand (global ESG assets US$40.5trn, 2023) creates credential premiums but overall stronger buyer bargaining power.
| Buyer type | Leverage | Margin impact |
|---|---|---|
| Public | High | Price-weighted RFPs |
| Private | Medium-High | 10–20% fee pressure |
| Mega-projects | High | 5–15% change orders |
Same Document Delivered
Stantec Porter's Five Forces Analysis
This preview of the Stantec Porter's Five Forces Analysis shows the exact document you'll receive immediately after purchase—fully formatted and ready to use. No mockups, placeholders, or samples: the file available for instant download is precisely what you see here. Buy now and get immediate access to this complete, professionally written analysis.
Original: $10.00
-65%$10.00
$3.50Description
A Must-Have Tool for Decision-Makers
Stantec faces moderate rivalry with large firms and niche specialists, variable buyer power from institutional clients, and supplier influence in specialized engineering inputs; barriers to entry are significant but niche substitutes and project-based competition pose ongoing threats. This brief snapshot only scratches the surface. Unlock the full Porter's Five Forces Analysis to explore Stantec’s competitive dynamics, market pressures, and strategic advantages in detail.
Suppliers Bargaining Power
Specialized talent scarcity
Stantec relies on niche engineers, architects and environmental scientists and employed approximately 27,000 professionals in 2024, making specialized talent scarcity a material constraint. Limited supply has pushed industry wage growth to roughly 5–7% in 2024, raising retention and recruitment costs and strengthening labor supplier power. Union rules and professional licensing further restrict switching, while investments in talent pipelines and employer branding help moderate this pressure.
Critical software and data tools
Critical design platforms (Autodesk, Esri, Bentley) remain concentrated in 2024, and subscription pricing plus high switching and interoperability costs amplify supplier leverage. License restrictions or outages have caused documented project delays and cost overruns on major infrastructure programs. Stantec mitigates risk through multi-vendor standards, open geospatial formats and selective in-house tool development to lower dependency.
Subconsultants and specialty firms
Complex projects force Stantec to hire niche subconsultants for geotechnical, environmental permitting and surveys, often representing significant scope and permitting lead times. Limited local availability and client preapproval lists push rates higher, while schedule-critical scopes give subs added negotiating clout. Preferred networks and master service agreements in 2024 procurement studies show typical cost containment savings of about 10-15%.
Regulatory testing and labs
Environmental testing, materials labs and certification bodies are regionally concentrated, often requiring ISO/IEC 17025 accreditation; turnaround times and accreditation needs give these suppliers measurable leverage. Rush fees (commonly up to ~30%) and capacity bottlenecks compress project margins, while early booking and using alternate accredited providers reduce risk.
- Regional concentration: accreditation hubs
- Accreditation: ISO/IEC 17025 required
- Rush fees: ~30% premium
- Mitigation: early booking, alternate accredited labs
Equipment and field services
Supply power: 27k, pay 5–7%, lead 12–24w
Supplier power is elevated: 27,000 specialized staff in 2024 and 5–7% industry wage growth tighten labor supply; concentrated software vendors (Autodesk/Esri/Bentley) raise switching costs; niche subs, labs and gear have long lead times (12–24 weeks) and rush fees ~30%, while pooled procurement and MSAs capture typical savings of 5–15%.
| Item | 2024 metric | Impact |
|---|---|---|
| Specialized labor | 27,000; wages +5–7% | Higher retention cost |
| Software | 3 major vendors | High switching cost |
| Labs/rush fees | ~30% premium | Margin compression |
| Equipment lead time | 12–24 weeks | Scheduling risk |
What is included in the product
Detailed Word Document
Tailored Porter's Five Forces analysis for Stantec that uncovers competitive drivers, supplier and buyer power, barriers to entry, substitutes and disruptive threats, providing strategic commentary and an editable Word format for easy inclusion in reports and investor materials.
Customizable Excel Spreadsheet
One-sheet Stantec Porter's Five Forces that instantly maps competitive pressure with a customizable spider chart—perfect for quick strategic decisions and boardroom slides. Easily swap in your data, duplicate scenarios (pre/post regulation) and integrate into dashboards without macros.
Customers Bargaining Power
Sophisticated public owners
Governments and infrastructure agencies run formal RFPs with price-weighted scoring and, given public procurement represents about 12% of GDP in OECD countries (OECD, 2024), large volumes and multi-year framework agreements create strong buyer bargaining power. Transparency and disclosure rules limit margin flexibility, while superior technical scoring and documented past performance can offset price pressure.
Corporate clients with alternatives
In 2024 private developers and utilities increasingly benchmarked fees across multiple global firms and routinely unbundled scopes to push fixed-fee or lump-sum contracts, intensifying fee pressure and transferring project risk to consultants. This compresses margins and raises variability in cashflow timing. Deep client relationships and bundled value-add services remain the main defenses against switching.
Project concentration risk
Mega-projects (typically >US$1bn) create concentrated backlog that gives buyers leverage on pricing and contract terms. Change-order disputes are common, with variations often representing roughly 5–15% of contract value under tight budgets. Extended payment terms and 5–10% holdbacks strain Stantec’s working capital and cash conversion. Broad portfolio diversification across sectors and geographies helps mitigate buyer power.
Data-driven procurement
Clients increasingly use KPI dashboards and cost databases to challenge rates, with procurement digitization delivering 10-20% sourcing cost reductions per McKinsey; standardized deliverables and benchmarking make vendor comparison easier. Performance clauses and penalties are more common, raising commercial pressure. Demonstrable outcome metrics and digital twins enable shift toward value-based pricing tied to measurable outcomes.
- KPI dashboards
- Cost databases
- Standardized deliverables
- Performance clauses
- Digital twins/value pricing
Sustainability-driven demands
Clients increasingly demand ESG outcomes, net-zero pathways and resilient design, pushing firms to offer specialized credentials as table stakes while comparisons shift toward cost; Bloomberg Intelligence reports global ESG assets reached 40.5 trillion USD in 2023, underpinning intense client scrutiny. High-stakes sustainability goals permit expertise premiums, and proven impact (measured reporting, verified carbon reductions) buys negotiating room despite price sensitivity.
- ESG demand
- Net-zero pathways
- Resilient design
- Credentials = table stakes
- Expertise premium
- Proven impact = leverage
Public and mega-project buyers push 5–20% pricing pressure
Public procurement (~12% GDP OECD, OECD 2024) and mega-projects concentrate volume and force price-weighted RFPs; change orders often equal 5–15% of contract value, with 5–10% holdbacks. Private developers benchmark fees globally and unbundle scopes, driving 10–20% fee pressure via digitized sourcing (McKinsey). ESG demand (global ESG assets US$40.5trn, 2023) creates credential premiums but overall stronger buyer bargaining power.
| Buyer type | Leverage | Margin impact |
|---|---|---|
| Public | High | Price-weighted RFPs |
| Private | Medium-High | 10–20% fee pressure |
| Mega-projects | High | 5–15% change orders |
Same Document Delivered
Stantec Porter's Five Forces Analysis
This preview of the Stantec Porter's Five Forces Analysis shows the exact document you'll receive immediately after purchase—fully formatted and ready to use. No mockups, placeholders, or samples: the file available for instant download is precisely what you see here. Buy now and get immediate access to this complete, professionally written analysis.











