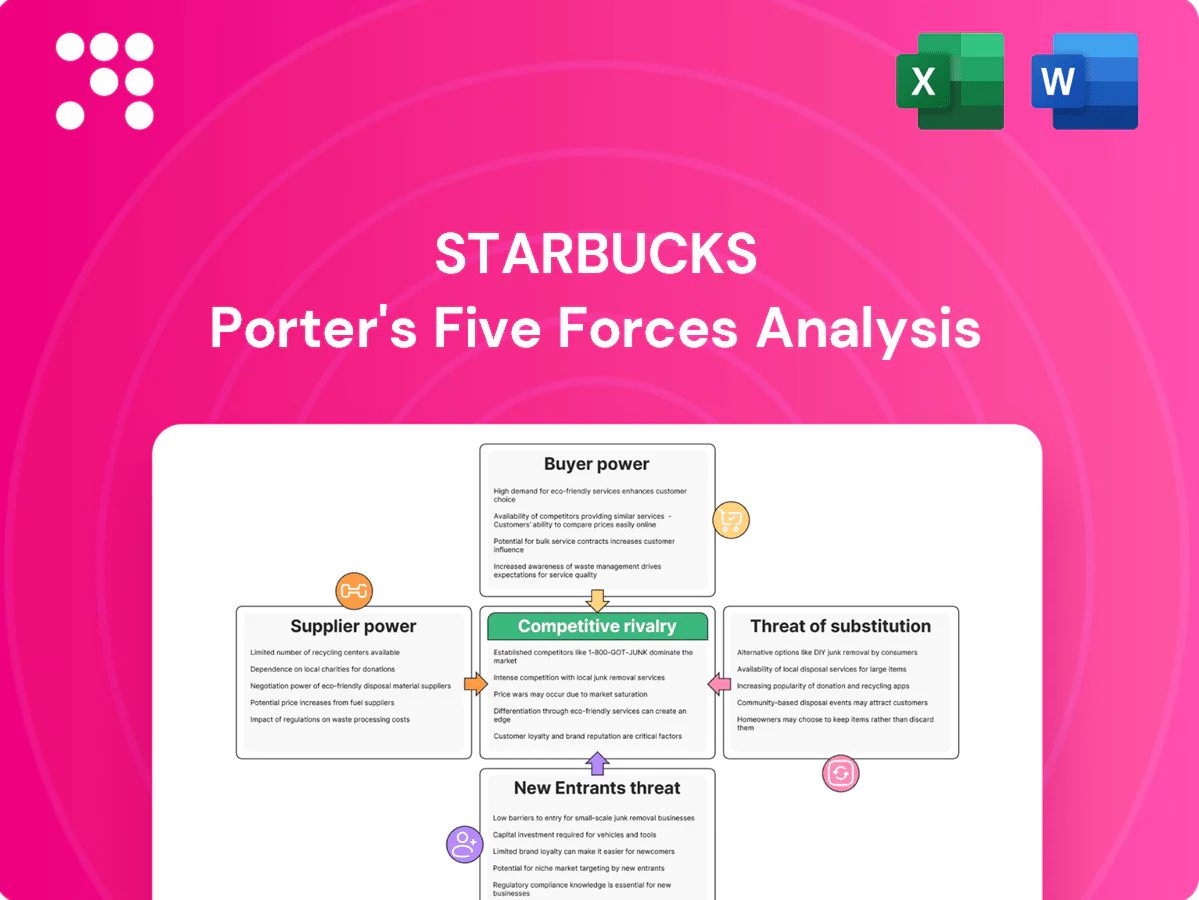
Starbucks Porter's Five Forces Analysis

Elevate Your Analysis with the Complete Porter's Five Forces Analysis
Starbucks faces intense competitive rivalry, moderate supplier power, strong buyer expectations, growing substitute threats from specialty and at‑home coffee, and high barriers limiting new entrants—yet digital channels and global expansion shift the balance. This brief snapshot only scratches the surface. Unlock the full Porter's Five Forces Analysis to explore Starbucks’s competitive dynamics, market pressures, and strategic advantages in detail.
Suppliers Bargaining Power

Concentrated arabica sources
High-quality arabica is concentrated in limited regions—Brazil alone produces roughly 40% of global arabica—creating regional concentration risk. Weather shocks or geopolitical issues in Latin America, Africa, or Asia can sharply tighten supply and spike prices. This concentration increases supplier leverage during disruptions; Starbucks mitigates exposure via multi-origin sourcing from ~30 countries and long-term supplier relationships, purchasing about 1% of global coffee.
Commodity price volatility
Coffee, dairy, sugar and cocoa prices move with global commodity markets, with Arabica and related commodities showing swings often exceeding 30% year-over-year in volatile periods, pressuring margins if costs are not hedged or passed through. Suppliers gain leverage in tight crops or supply-chain disruption. Starbucks offsets via systematic hedging, strategic menu pricing and mix management to protect margins.

Scale offsets supplier power
Starbucks' global scale—over 36,000 stores and fiscal 2024 revenue near $38 billion—gives it strong negotiating clout with growers and ingredient suppliers. Preferred-supplier programs and long-term contracts, including forward purchases, reduce counterparty leverage and stabilize costs. Volume commitments secure priority access and better pricing. These factors soften but do not eliminate supplier power given commodity volatility and supply risks.

Ethical sourcing requirements
Starbucks' C.A.F.E. Practices and sustainability targets narrow the pool of compliant suppliers, increasing dependence on qualified partners. Starbucks provides farmer training and sourcing premiums to build loyalty and resilience. Mutual investments and long-term sourcing agreements help rebalance bargaining power between Starbucks and suppliers.
- fewer compliant suppliers
- supplier dependence rises
- training + premiums build loyalty
- mutual investment reduces risk
Logistics and equipment dependencies
Specialized espresso machines, proprietary cups and syrup formulations create pockets of supplier specificity for Starbucks, raising switching costs tied to certification and compatibility; with ~36,000 global stores (2024) localized logistics bottlenecks can sharply amplify supplier leverage during disruptions such as 2021–22 supply shocks.
- Dual-sourcing lowers single-supplier exposure
- Inventory buffers mitigate short-term bottlenecks
- Specialty inputs → higher switching costs
Brazil ≈40% arabica supply power; buyers face >30% swings
High-quality arabica is regionally concentrated (Brazil ~40% of arabica), creating supplier leverage in shocks. Starbucks (≈36,000 stores; FY2024 revenue ≈$38B) buys ~1% of global coffee, giving scale but not immunity to >30% YoY commodity swings. Long-term contracts, hedging and C.A.F.E. Practices reduce but do not eliminate supplier power.
| Metric | Value |
|---|---|
| Stores (2024) | ≈36,000 |
| Revenue FY2024 | ≈$38B |
| Share of global coffee | ≈1% |
| Brazil arabica | ≈40% |
| Commodity swing | >30% YoY |
What is included in the product
 Detailed Word Document
Tailored Porter’s Five Forces analysis of Starbucks uncovering competitive intensity, buyer/supplier power, substitution risks, entry barriers, and disruptive threats shaping its pricing, margins, and strategic positioning.

 Customizable Excel Spreadsheet
A concise one-sheet Porter's Five Forces for Starbucks that visualizes competitive pressure with a spider chart and customizable scores—ideal for quick strategic decisions, slide-ready, and easy to adapt to shifting market conditions.
Customers Bargaining Power

Low switching costs
Low switching costs mean consumers can pick rivals or brew at home, forcing pricing discipline and high service quality; Starbucks had about 38,000 stores globally in 2024 and roughly 30 million US Rewards members, which it leverages to retain customers. Promotions and value menus gain traction during price-sensitive periods. Dense store footprint and convenience partially offset ease of switching.
Loyalty ecosystem lock-in
Starbucks Rewards (over 30 million members in US/Canada in 2024) plus mobile ordering and personalization raise perceived switching costs; digital orders made about 64% of US company‑operated store sales in FY2024. Points, targeted offers and seamless payments build habit and data‑driven nudges lift frequency and ticket size, dampening buyer bargaining power among members.

Broad customer base
Millions of fragmented consumers give Starbucks limited individual leverage, despite the company operating roughly 37,000 stores worldwide in 2024 and serving millions daily. Aggregate sentiment can swiftly sway demand, as viral social media reactions to pricing or policy moves accelerate shifts in foot traffic and sales. Brand equity and 100+ billion annual customer interactions cushion impacts, but collective pressure still forces rapid response and policy reversals.

Retail and CPG channel buyers
- Retailer concentration ~33% of US grocery sales
- Slotting fees commonly tens–hundreds k USD per SKU
- Private label share ~15–20%
- Starbucks brand strength improves negotiation leverage
Quality and health expectations
Customers demand consistent quality, customizable drinks and healthier options, and with Starbucks operating about 37,000 stores worldwide in 2024, expectations are uniform across markets. Failure to match preferences switches spend to rivals and local chains. Transparency on ingredients and sustainability now strongly influences choice. When Starbucks meets these needs, buyer leverage is reduced.
- Quality consistency: critical
- Customization & health: rising
- Transparency/sustainability: decisive
37,000 stores, 30M+ members — loyalty counters low switching costs
Low switching costs and many alternatives keep buyer power moderate; Starbucks had ~37,000 stores worldwide and >30M US/Canada Rewards members in 2024, which temper churn. Digital adoption (≈64% of US company‑operated sales in FY2024) and loyalty raise perceived switching costs. Retail grocery partners (≈33% US grocery share) and slotting fees squeeze CPG margins.
| Metric | 2024 value |
|---|---|
| Stores (global) | ≈37,000 |
| Rewards members (US/CAN) | >30M |
| Digital sales US | ≈64% |
| Grocery concentration | ≈33% |
What You See Is What You Get
Starbucks Porter's Five Forces Analysis
This preview shows the exact Starbucks Porter's Five Forces Analysis you'll receive immediately after purchase—no surprises or placeholders. The document displayed here is the professionally written, fully formatted file you can download and use the moment you buy. You're viewing the final deliverable; instant access to this identical, ready-to-use analysis is provided upon payment.

Elevate Your Analysis with the Complete Porter's Five Forces Analysis
Starbucks faces intense competitive rivalry, moderate supplier power, strong buyer expectations, growing substitute threats from specialty and at‑home coffee, and high barriers limiting new entrants—yet digital channels and global expansion shift the balance. This brief snapshot only scratches the surface. Unlock the full Porter's Five Forces Analysis to explore Starbucks’s competitive dynamics, market pressures, and strategic advantages in detail.
Suppliers Bargaining Power
Concentrated arabica sources
High-quality arabica is concentrated in limited regions—Brazil alone produces roughly 40% of global arabica—creating regional concentration risk. Weather shocks or geopolitical issues in Latin America, Africa, or Asia can sharply tighten supply and spike prices. This concentration increases supplier leverage during disruptions; Starbucks mitigates exposure via multi-origin sourcing from ~30 countries and long-term supplier relationships, purchasing about 1% of global coffee.
Commodity price volatility
Coffee, dairy, sugar and cocoa prices move with global commodity markets, with Arabica and related commodities showing swings often exceeding 30% year-over-year in volatile periods, pressuring margins if costs are not hedged or passed through. Suppliers gain leverage in tight crops or supply-chain disruption. Starbucks offsets via systematic hedging, strategic menu pricing and mix management to protect margins.
Scale offsets supplier power
Starbucks' global scale—over 36,000 stores and fiscal 2024 revenue near $38 billion—gives it strong negotiating clout with growers and ingredient suppliers. Preferred-supplier programs and long-term contracts, including forward purchases, reduce counterparty leverage and stabilize costs. Volume commitments secure priority access and better pricing. These factors soften but do not eliminate supplier power given commodity volatility and supply risks.
Ethical sourcing requirements
Starbucks' C.A.F.E. Practices and sustainability targets narrow the pool of compliant suppliers, increasing dependence on qualified partners. Starbucks provides farmer training and sourcing premiums to build loyalty and resilience. Mutual investments and long-term sourcing agreements help rebalance bargaining power between Starbucks and suppliers.
- fewer compliant suppliers
- supplier dependence rises
- training + premiums build loyalty
- mutual investment reduces risk
Logistics and equipment dependencies
Specialized espresso machines, proprietary cups and syrup formulations create pockets of supplier specificity for Starbucks, raising switching costs tied to certification and compatibility; with ~36,000 global stores (2024) localized logistics bottlenecks can sharply amplify supplier leverage during disruptions such as 2021–22 supply shocks.
- Dual-sourcing lowers single-supplier exposure
- Inventory buffers mitigate short-term bottlenecks
- Specialty inputs → higher switching costs
Brazil ≈40% arabica supply power; buyers face >30% swings
High-quality arabica is regionally concentrated (Brazil ~40% of arabica), creating supplier leverage in shocks. Starbucks (≈36,000 stores; FY2024 revenue ≈$38B) buys ~1% of global coffee, giving scale but not immunity to >30% YoY commodity swings. Long-term contracts, hedging and C.A.F.E. Practices reduce but do not eliminate supplier power.
| Metric | Value |
|---|---|
| Stores (2024) | ≈36,000 |
| Revenue FY2024 | ≈$38B |
| Share of global coffee | ≈1% |
| Brazil arabica | ≈40% |
| Commodity swing | >30% YoY |
What is included in the product
Detailed Word Document
Tailored Porter’s Five Forces analysis of Starbucks uncovering competitive intensity, buyer/supplier power, substitution risks, entry barriers, and disruptive threats shaping its pricing, margins, and strategic positioning.
Customizable Excel Spreadsheet
A concise one-sheet Porter's Five Forces for Starbucks that visualizes competitive pressure with a spider chart and customizable scores—ideal for quick strategic decisions, slide-ready, and easy to adapt to shifting market conditions.
Customers Bargaining Power
Low switching costs
Low switching costs mean consumers can pick rivals or brew at home, forcing pricing discipline and high service quality; Starbucks had about 38,000 stores globally in 2024 and roughly 30 million US Rewards members, which it leverages to retain customers. Promotions and value menus gain traction during price-sensitive periods. Dense store footprint and convenience partially offset ease of switching.
Loyalty ecosystem lock-in
Starbucks Rewards (over 30 million members in US/Canada in 2024) plus mobile ordering and personalization raise perceived switching costs; digital orders made about 64% of US company‑operated store sales in FY2024. Points, targeted offers and seamless payments build habit and data‑driven nudges lift frequency and ticket size, dampening buyer bargaining power among members.
Broad customer base
Millions of fragmented consumers give Starbucks limited individual leverage, despite the company operating roughly 37,000 stores worldwide in 2024 and serving millions daily. Aggregate sentiment can swiftly sway demand, as viral social media reactions to pricing or policy moves accelerate shifts in foot traffic and sales. Brand equity and 100+ billion annual customer interactions cushion impacts, but collective pressure still forces rapid response and policy reversals.
Retail and CPG channel buyers
- Retailer concentration ~33% of US grocery sales
- Slotting fees commonly tens–hundreds k USD per SKU
- Private label share ~15–20%
- Starbucks brand strength improves negotiation leverage
Quality and health expectations
Customers demand consistent quality, customizable drinks and healthier options, and with Starbucks operating about 37,000 stores worldwide in 2024, expectations are uniform across markets. Failure to match preferences switches spend to rivals and local chains. Transparency on ingredients and sustainability now strongly influences choice. When Starbucks meets these needs, buyer leverage is reduced.
- Quality consistency: critical
- Customization & health: rising
- Transparency/sustainability: decisive
37,000 stores, 30M+ members — loyalty counters low switching costs
Low switching costs and many alternatives keep buyer power moderate; Starbucks had ~37,000 stores worldwide and >30M US/Canada Rewards members in 2024, which temper churn. Digital adoption (≈64% of US company‑operated sales in FY2024) and loyalty raise perceived switching costs. Retail grocery partners (≈33% US grocery share) and slotting fees squeeze CPG margins.
| Metric | 2024 value |
|---|---|
| Stores (global) | ≈37,000 |
| Rewards members (US/CAN) | >30M |
| Digital sales US | ≈64% |
| Grocery concentration | ≈33% |
What You See Is What You Get
Starbucks Porter's Five Forces Analysis
This preview shows the exact Starbucks Porter's Five Forces Analysis you'll receive immediately after purchase—no surprises or placeholders. The document displayed here is the professionally written, fully formatted file you can download and use the moment you buy. You're viewing the final deliverable; instant access to this identical, ready-to-use analysis is provided upon payment.
Description
Elevate Your Analysis with the Complete Porter's Five Forces Analysis
Starbucks faces intense competitive rivalry, moderate supplier power, strong buyer expectations, growing substitute threats from specialty and at‑home coffee, and high barriers limiting new entrants—yet digital channels and global expansion shift the balance. This brief snapshot only scratches the surface. Unlock the full Porter's Five Forces Analysis to explore Starbucks’s competitive dynamics, market pressures, and strategic advantages in detail.
Suppliers Bargaining Power
Concentrated arabica sources
High-quality arabica is concentrated in limited regions—Brazil alone produces roughly 40% of global arabica—creating regional concentration risk. Weather shocks or geopolitical issues in Latin America, Africa, or Asia can sharply tighten supply and spike prices. This concentration increases supplier leverage during disruptions; Starbucks mitigates exposure via multi-origin sourcing from ~30 countries and long-term supplier relationships, purchasing about 1% of global coffee.
Commodity price volatility
Coffee, dairy, sugar and cocoa prices move with global commodity markets, with Arabica and related commodities showing swings often exceeding 30% year-over-year in volatile periods, pressuring margins if costs are not hedged or passed through. Suppliers gain leverage in tight crops or supply-chain disruption. Starbucks offsets via systematic hedging, strategic menu pricing and mix management to protect margins.
Scale offsets supplier power
Starbucks' global scale—over 36,000 stores and fiscal 2024 revenue near $38 billion—gives it strong negotiating clout with growers and ingredient suppliers. Preferred-supplier programs and long-term contracts, including forward purchases, reduce counterparty leverage and stabilize costs. Volume commitments secure priority access and better pricing. These factors soften but do not eliminate supplier power given commodity volatility and supply risks.
Ethical sourcing requirements
Starbucks' C.A.F.E. Practices and sustainability targets narrow the pool of compliant suppliers, increasing dependence on qualified partners. Starbucks provides farmer training and sourcing premiums to build loyalty and resilience. Mutual investments and long-term sourcing agreements help rebalance bargaining power between Starbucks and suppliers.
- fewer compliant suppliers
- supplier dependence rises
- training + premiums build loyalty
- mutual investment reduces risk
Logistics and equipment dependencies
Specialized espresso machines, proprietary cups and syrup formulations create pockets of supplier specificity for Starbucks, raising switching costs tied to certification and compatibility; with ~36,000 global stores (2024) localized logistics bottlenecks can sharply amplify supplier leverage during disruptions such as 2021–22 supply shocks.
- Dual-sourcing lowers single-supplier exposure
- Inventory buffers mitigate short-term bottlenecks
- Specialty inputs → higher switching costs
Brazil ≈40% arabica supply power; buyers face >30% swings
High-quality arabica is regionally concentrated (Brazil ~40% of arabica), creating supplier leverage in shocks. Starbucks (≈36,000 stores; FY2024 revenue ≈$38B) buys ~1% of global coffee, giving scale but not immunity to >30% YoY commodity swings. Long-term contracts, hedging and C.A.F.E. Practices reduce but do not eliminate supplier power.
| Metric | Value |
|---|---|
| Stores (2024) | ≈36,000 |
| Revenue FY2024 | ≈$38B |
| Share of global coffee | ≈1% |
| Brazil arabica | ≈40% |
| Commodity swing | >30% YoY |
What is included in the product
Detailed Word Document
Tailored Porter’s Five Forces analysis of Starbucks uncovering competitive intensity, buyer/supplier power, substitution risks, entry barriers, and disruptive threats shaping its pricing, margins, and strategic positioning.
Customizable Excel Spreadsheet
A concise one-sheet Porter's Five Forces for Starbucks that visualizes competitive pressure with a spider chart and customizable scores—ideal for quick strategic decisions, slide-ready, and easy to adapt to shifting market conditions.
Customers Bargaining Power
Low switching costs
Low switching costs mean consumers can pick rivals or brew at home, forcing pricing discipline and high service quality; Starbucks had about 38,000 stores globally in 2024 and roughly 30 million US Rewards members, which it leverages to retain customers. Promotions and value menus gain traction during price-sensitive periods. Dense store footprint and convenience partially offset ease of switching.
Loyalty ecosystem lock-in
Starbucks Rewards (over 30 million members in US/Canada in 2024) plus mobile ordering and personalization raise perceived switching costs; digital orders made about 64% of US company‑operated store sales in FY2024. Points, targeted offers and seamless payments build habit and data‑driven nudges lift frequency and ticket size, dampening buyer bargaining power among members.
Broad customer base
Millions of fragmented consumers give Starbucks limited individual leverage, despite the company operating roughly 37,000 stores worldwide in 2024 and serving millions daily. Aggregate sentiment can swiftly sway demand, as viral social media reactions to pricing or policy moves accelerate shifts in foot traffic and sales. Brand equity and 100+ billion annual customer interactions cushion impacts, but collective pressure still forces rapid response and policy reversals.
Retail and CPG channel buyers
- Retailer concentration ~33% of US grocery sales
- Slotting fees commonly tens–hundreds k USD per SKU
- Private label share ~15–20%
- Starbucks brand strength improves negotiation leverage
Quality and health expectations
Customers demand consistent quality, customizable drinks and healthier options, and with Starbucks operating about 37,000 stores worldwide in 2024, expectations are uniform across markets. Failure to match preferences switches spend to rivals and local chains. Transparency on ingredients and sustainability now strongly influences choice. When Starbucks meets these needs, buyer leverage is reduced.
- Quality consistency: critical
- Customization & health: rising
- Transparency/sustainability: decisive
37,000 stores, 30M+ members — loyalty counters low switching costs
Low switching costs and many alternatives keep buyer power moderate; Starbucks had ~37,000 stores worldwide and >30M US/Canada Rewards members in 2024, which temper churn. Digital adoption (≈64% of US company‑operated sales in FY2024) and loyalty raise perceived switching costs. Retail grocery partners (≈33% US grocery share) and slotting fees squeeze CPG margins.
| Metric | 2024 value |
|---|---|
| Stores (global) | ≈37,000 |
| Rewards members (US/CAN) | >30M |
| Digital sales US | ≈64% |
| Grocery concentration | ≈33% |
What You See Is What You Get
Starbucks Porter's Five Forces Analysis
This preview shows the exact Starbucks Porter's Five Forces Analysis you'll receive immediately after purchase—no surprises or placeholders. The document displayed here is the professionally written, fully formatted file you can download and use the moment you buy. You're viewing the final deliverable; instant access to this identical, ready-to-use analysis is provided upon payment.











