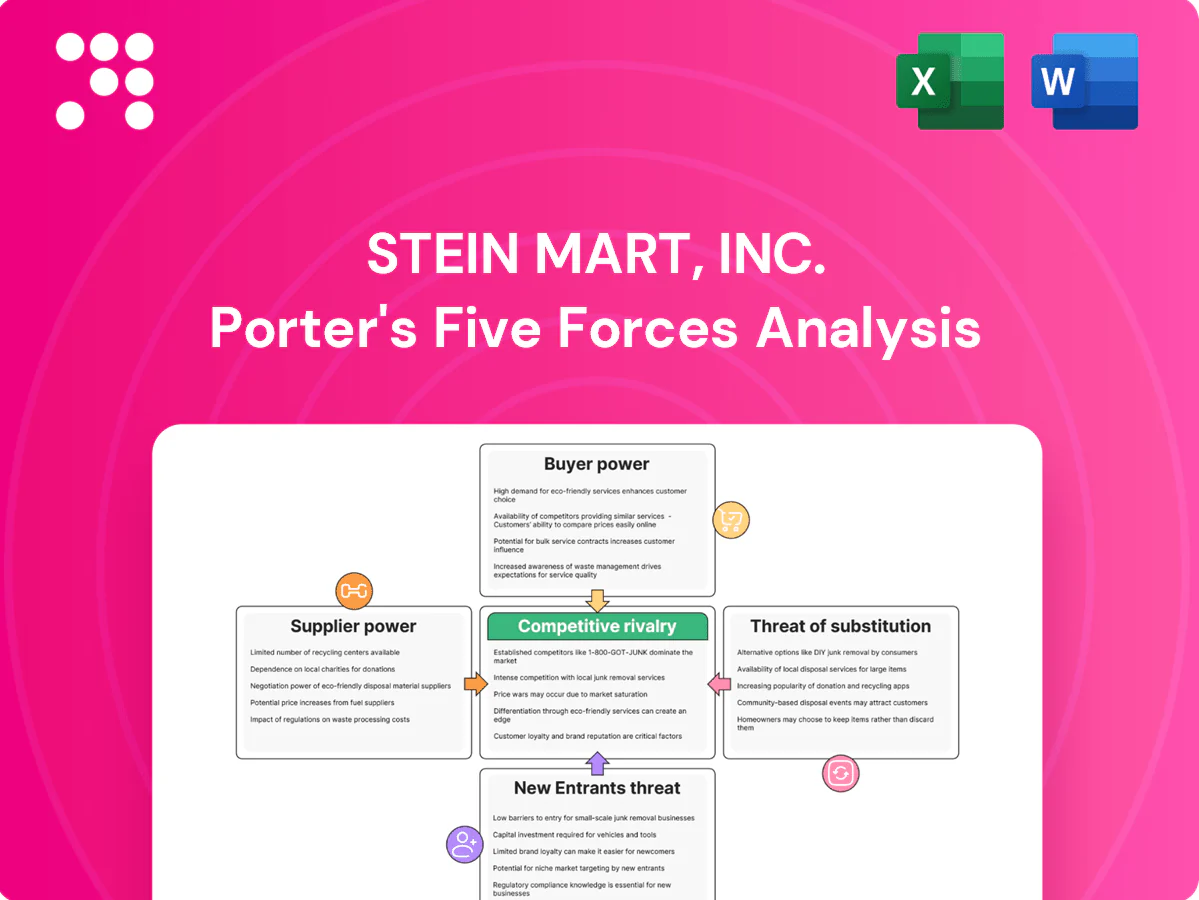
Stein Mart, Inc. Porter's Five Forces Analysis

From Overview to Strategy Blueprint
Stein Mart faces intense rivalry from discount and online apparel retailers, high buyer price sensitivity, moderate supplier leverage, persistent substitute threats, and low barriers for nimble entrants. This snapshot highlights pressures shaping margins and strategic choices. Unlock the full Porter's Five Forces Analysis to explore Stein Mart, Inc.’s competitive dynamics, market pressures, and strategic advantages in detail.
Suppliers Bargaining Power

Fragmented vendors temper leverage
Stein Mart sources from many apparel and home‑goods suppliers, closeout sellers and importers, diluting any single vendor’s leverage; after filing Chapter 11 in August 2020 and closing about 279 stores, the brand operates primarily online. The e‑commerce model eases switching among comparable vendors. Seasonal cycles and rapid style shifts create brief periods where specific suppliers gain importance. Diversification remains key to negotiating favorable terms.
Branded labels retain clout
Recognized brands and premium labels command better margins and can ration supply to protect channel integrity. Stein Mart's August 2020 Chapter 11 filing and liquidation increased brand risk, making access to coveted labels less certain and raising supplier power. Vendors commonly impose minimums, MAP policies or limit assortments, constraining pricing flexibility and differentiation.

Platform and 3PL dependence
E-commerce for Stein Mart depends on cloud, payments, anti-fraud and 3PL providers whose outages or fee increases compress margins; hyperscalers held over 60% of cloud market in 2024. Switching core platforms causes operational disruption and material migration costs. This infrastructure layer elevates supplier bargaining power versus a vertically integrated stack.

Freight and sourcing volatility
Global freight rate volatility sharply affects Stein Mart landed costs: container rates fell to roughly one-fifth of 2022 peaks by 2024 (Drewry), but port congestion and currency swings keep quarter-to-quarter landed cost variance high. Smaller volumes versus mass retailers weaken Stein Mart’s negotiating leverage with carriers and factories, while suppliers increasingly pass through inflation and shorten lock-in periods. Volatility elevates supplier power during tight-capacity cycles.
- Carrier leverage: reduced for small shippers
- Cost pass-through: shorter contracts, higher variability
- Tight cycles: supplier power spikes
Private label as counterweight
Expanding private label could reduce Stein Mart's dependency on branded vendors and boost margins, but Stein Mart filed Chapter 11 on April 12, 2020 and liquidated ~279 stores, so any private-label gains are hypothetical absent a relaunched operating model. Control over design and sourcing typically strengthens negotiating leverage, yet MOQ, quality assurance and inventory risk create supplier pressure that can offset benefits. Execution capability ultimately dictates how much bargaining power shifts back to the retailer.
- Private label reduces branded spend
- Design+sourcing = stronger leverage
- MOQ, QA, inventory risk empower suppliers
- Execution capability determines net power shift
Apparel retailer faces moderate-high supplier power amid cloud and freight concentration
Stein Mart's supplier power is moderate-high: diversified apparel/import vendors and e-commerce switching lower single-vendor leverage, but brand access limits, MOQ/MAP constraints and smaller volumes versus mass retailers increase supplier influence. 2024 cloud hyperscalers >60% share and container rates ~20% of 2022 peaks (Drewry) amplify infrastructure and freight supplier power during tight cycles.
| Metric | 2024 |
|---|---|
| Cloud market share (top hyperscalers) | >60% |
| Container rates vs 2022 peak | ~20% |
| Store count post-2020 | ~0 retail; online focus |
What is included in the product
 Detailed Word Document
Analyzes competitive intensity, buyer and supplier power, threat of new entrants and substitutes, and rivalry for Stein Mart—highlighting retail pressures from e-commerce, supplier consolidation, price-sensitive buyers, and low differentiation that compress margins and constrain profitability.

 Customizable Excel Spreadsheet
Clear, one-sheet Porter's Five Forces for Stein Mart—instantly pinpoint competitive pain points, customize pressure levels with current data, and drop a clean chart into decks without macros or finance expertise.
Customers Bargaining Power

High price sensitivity online
Value shoppers compare Stein Mart pricing with Amazon (roughly 40% of US e‑commerce) and Walmart (around 10% share) and off‑price rivals like TJX (TJX net sales $51.9B FY2024), so transparent online pricing and frequent promotions amplify buyer power. Small price deltas often trigger switching, while deeper discounts and perceived value reliably drive conversion and basket lift.
Low switching costs
E-commerce buyers face minimal friction to try alternatives, reflected in a 69.57% global cart abandonment rate (Baymard Institute, 2023). Apparel e-commerce return rates average roughly 20–30%, so poor shipping, delivery speed, or returns policies spike abandonment. Stein Mart’s 2020 store closures eroded offline loyalty, increasing churn risk, and customers now leverage low switching costs to demand better pricing, faster delivery, and lenient returns.

Reviews and social proof
Ratings and user content drive buying: 92% of consumers consult reviews (BrightLocal 2024), amplifying customer power over Stein Mart’s assortment and pricing. Negative reviews can crater sell-through, forcing markdowns that compress margins; quick response and QC cut risk, while social channels can pivot demand in real time.

Returns expectations
Apparel returns average about 30% online versus ~8–10% in-store, driving customer expectations for easy, often free returns; liberal policies that lift e‑commerce conversion raise buyer power while adding $10–$20 average cost-to-serve per return and compressing Stein Mart margins. Tightening policies can cut return costs but risks a ~10–15% drop in conversion, so balancing CX and margin is a constant negotiation with buyers.
- 30% online apparel return rate
- $10–$20 avg cost per return
- 8–10% in-store return rate
- 10–15% conversion risk if returns tightened
Limited differentiation post-relaunch
As an online-only discounter, Stein Mart faces heavy assortment overlap with mass merchants and marketplaces, weakening uniqueness; 2024 U.S. e-commerce sales approached $1.1 trillion, intensifying competition. Without experiential stores, buyers focus on price, curation, and logistics, raising their bargaining leverage; weak differentiation increases price elasticity and churn, so brand rebuilding is required to capture margin.
- Overlap with mass merchants
- Price/curation/logistics-driven buying
- Higher buyer leverage, greater elasticity
- Need brand rebuilding to regain margin
69.57% cart loss, 30% returns empower shoppers, squeeze margins
Customers wield strong bargaining power: easy switching to Amazon/Walmart/TJX, high cart abandonment (69.57%) and 20–30% apparel return rates force frequent promotions and liberal returns that compress margins.
| Metric | Value |
|---|---|
| Amazon share | ~40% |
| TJX net sales FY2024 | $51.9B |
| Cart abandonment | 69.57% |
| Online return rate | 30% |
Preview the Actual Deliverable
Stein Mart, Inc. Porter's Five Forces Analysis
This Porter's Five Forces analysis for Stein Mart assesses industry rivalry, buyer and supplier power, threat of substitutes and new entrants, and strategic implications for an off‑price apparel retailer. It highlights strong competitive rivalry and high buyer power, moderate supplier leverage, significant substitute threats from online and value retailers, and low-to-moderate entry barriers. This preview shows the exact document you'll receive immediately after purchase—no surprises, no placeholders.

From Overview to Strategy Blueprint
Stein Mart faces intense rivalry from discount and online apparel retailers, high buyer price sensitivity, moderate supplier leverage, persistent substitute threats, and low barriers for nimble entrants. This snapshot highlights pressures shaping margins and strategic choices. Unlock the full Porter's Five Forces Analysis to explore Stein Mart, Inc.’s competitive dynamics, market pressures, and strategic advantages in detail.
Suppliers Bargaining Power
Fragmented vendors temper leverage
Stein Mart sources from many apparel and home‑goods suppliers, closeout sellers and importers, diluting any single vendor’s leverage; after filing Chapter 11 in August 2020 and closing about 279 stores, the brand operates primarily online. The e‑commerce model eases switching among comparable vendors. Seasonal cycles and rapid style shifts create brief periods where specific suppliers gain importance. Diversification remains key to negotiating favorable terms.
Branded labels retain clout
Recognized brands and premium labels command better margins and can ration supply to protect channel integrity. Stein Mart's August 2020 Chapter 11 filing and liquidation increased brand risk, making access to coveted labels less certain and raising supplier power. Vendors commonly impose minimums, MAP policies or limit assortments, constraining pricing flexibility and differentiation.
Platform and 3PL dependence
E-commerce for Stein Mart depends on cloud, payments, anti-fraud and 3PL providers whose outages or fee increases compress margins; hyperscalers held over 60% of cloud market in 2024. Switching core platforms causes operational disruption and material migration costs. This infrastructure layer elevates supplier bargaining power versus a vertically integrated stack.
Freight and sourcing volatility
Global freight rate volatility sharply affects Stein Mart landed costs: container rates fell to roughly one-fifth of 2022 peaks by 2024 (Drewry), but port congestion and currency swings keep quarter-to-quarter landed cost variance high. Smaller volumes versus mass retailers weaken Stein Mart’s negotiating leverage with carriers and factories, while suppliers increasingly pass through inflation and shorten lock-in periods. Volatility elevates supplier power during tight-capacity cycles.
- Carrier leverage: reduced for small shippers
- Cost pass-through: shorter contracts, higher variability
- Tight cycles: supplier power spikes
Private label as counterweight
Expanding private label could reduce Stein Mart's dependency on branded vendors and boost margins, but Stein Mart filed Chapter 11 on April 12, 2020 and liquidated ~279 stores, so any private-label gains are hypothetical absent a relaunched operating model. Control over design and sourcing typically strengthens negotiating leverage, yet MOQ, quality assurance and inventory risk create supplier pressure that can offset benefits. Execution capability ultimately dictates how much bargaining power shifts back to the retailer.
- Private label reduces branded spend
- Design+sourcing = stronger leverage
- MOQ, QA, inventory risk empower suppliers
- Execution capability determines net power shift
Apparel retailer faces moderate-high supplier power amid cloud and freight concentration
Stein Mart's supplier power is moderate-high: diversified apparel/import vendors and e-commerce switching lower single-vendor leverage, but brand access limits, MOQ/MAP constraints and smaller volumes versus mass retailers increase supplier influence. 2024 cloud hyperscalers >60% share and container rates ~20% of 2022 peaks (Drewry) amplify infrastructure and freight supplier power during tight cycles.
| Metric | 2024 |
|---|---|
| Cloud market share (top hyperscalers) | >60% |
| Container rates vs 2022 peak | ~20% |
| Store count post-2020 | ~0 retail; online focus |
What is included in the product
Detailed Word Document
Analyzes competitive intensity, buyer and supplier power, threat of new entrants and substitutes, and rivalry for Stein Mart—highlighting retail pressures from e-commerce, supplier consolidation, price-sensitive buyers, and low differentiation that compress margins and constrain profitability.
Customizable Excel Spreadsheet
Clear, one-sheet Porter's Five Forces for Stein Mart—instantly pinpoint competitive pain points, customize pressure levels with current data, and drop a clean chart into decks without macros or finance expertise.
Customers Bargaining Power
High price sensitivity online
Value shoppers compare Stein Mart pricing with Amazon (roughly 40% of US e‑commerce) and Walmart (around 10% share) and off‑price rivals like TJX (TJX net sales $51.9B FY2024), so transparent online pricing and frequent promotions amplify buyer power. Small price deltas often trigger switching, while deeper discounts and perceived value reliably drive conversion and basket lift.
Low switching costs
E-commerce buyers face minimal friction to try alternatives, reflected in a 69.57% global cart abandonment rate (Baymard Institute, 2023). Apparel e-commerce return rates average roughly 20–30%, so poor shipping, delivery speed, or returns policies spike abandonment. Stein Mart’s 2020 store closures eroded offline loyalty, increasing churn risk, and customers now leverage low switching costs to demand better pricing, faster delivery, and lenient returns.
Reviews and social proof
Ratings and user content drive buying: 92% of consumers consult reviews (BrightLocal 2024), amplifying customer power over Stein Mart’s assortment and pricing. Negative reviews can crater sell-through, forcing markdowns that compress margins; quick response and QC cut risk, while social channels can pivot demand in real time.
Returns expectations
Apparel returns average about 30% online versus ~8–10% in-store, driving customer expectations for easy, often free returns; liberal policies that lift e‑commerce conversion raise buyer power while adding $10–$20 average cost-to-serve per return and compressing Stein Mart margins. Tightening policies can cut return costs but risks a ~10–15% drop in conversion, so balancing CX and margin is a constant negotiation with buyers.
- 30% online apparel return rate
- $10–$20 avg cost per return
- 8–10% in-store return rate
- 10–15% conversion risk if returns tightened
Limited differentiation post-relaunch
As an online-only discounter, Stein Mart faces heavy assortment overlap with mass merchants and marketplaces, weakening uniqueness; 2024 U.S. e-commerce sales approached $1.1 trillion, intensifying competition. Without experiential stores, buyers focus on price, curation, and logistics, raising their bargaining leverage; weak differentiation increases price elasticity and churn, so brand rebuilding is required to capture margin.
- Overlap with mass merchants
- Price/curation/logistics-driven buying
- Higher buyer leverage, greater elasticity
- Need brand rebuilding to regain margin
69.57% cart loss, 30% returns empower shoppers, squeeze margins
Customers wield strong bargaining power: easy switching to Amazon/Walmart/TJX, high cart abandonment (69.57%) and 20–30% apparel return rates force frequent promotions and liberal returns that compress margins.
| Metric | Value |
|---|---|
| Amazon share | ~40% |
| TJX net sales FY2024 | $51.9B |
| Cart abandonment | 69.57% |
| Online return rate | 30% |
Preview the Actual Deliverable
Stein Mart, Inc. Porter's Five Forces Analysis
This Porter's Five Forces analysis for Stein Mart assesses industry rivalry, buyer and supplier power, threat of substitutes and new entrants, and strategic implications for an off‑price apparel retailer. It highlights strong competitive rivalry and high buyer power, moderate supplier leverage, significant substitute threats from online and value retailers, and low-to-moderate entry barriers. This preview shows the exact document you'll receive immediately after purchase—no surprises, no placeholders.
Original: $10.00
-65%$10.00
$3.50Description
From Overview to Strategy Blueprint
Stein Mart faces intense rivalry from discount and online apparel retailers, high buyer price sensitivity, moderate supplier leverage, persistent substitute threats, and low barriers for nimble entrants. This snapshot highlights pressures shaping margins and strategic choices. Unlock the full Porter's Five Forces Analysis to explore Stein Mart, Inc.’s competitive dynamics, market pressures, and strategic advantages in detail.
Suppliers Bargaining Power
Fragmented vendors temper leverage
Stein Mart sources from many apparel and home‑goods suppliers, closeout sellers and importers, diluting any single vendor’s leverage; after filing Chapter 11 in August 2020 and closing about 279 stores, the brand operates primarily online. The e‑commerce model eases switching among comparable vendors. Seasonal cycles and rapid style shifts create brief periods where specific suppliers gain importance. Diversification remains key to negotiating favorable terms.
Branded labels retain clout
Recognized brands and premium labels command better margins and can ration supply to protect channel integrity. Stein Mart's August 2020 Chapter 11 filing and liquidation increased brand risk, making access to coveted labels less certain and raising supplier power. Vendors commonly impose minimums, MAP policies or limit assortments, constraining pricing flexibility and differentiation.
Platform and 3PL dependence
E-commerce for Stein Mart depends on cloud, payments, anti-fraud and 3PL providers whose outages or fee increases compress margins; hyperscalers held over 60% of cloud market in 2024. Switching core platforms causes operational disruption and material migration costs. This infrastructure layer elevates supplier bargaining power versus a vertically integrated stack.
Freight and sourcing volatility
Global freight rate volatility sharply affects Stein Mart landed costs: container rates fell to roughly one-fifth of 2022 peaks by 2024 (Drewry), but port congestion and currency swings keep quarter-to-quarter landed cost variance high. Smaller volumes versus mass retailers weaken Stein Mart’s negotiating leverage with carriers and factories, while suppliers increasingly pass through inflation and shorten lock-in periods. Volatility elevates supplier power during tight-capacity cycles.
- Carrier leverage: reduced for small shippers
- Cost pass-through: shorter contracts, higher variability
- Tight cycles: supplier power spikes
Private label as counterweight
Expanding private label could reduce Stein Mart's dependency on branded vendors and boost margins, but Stein Mart filed Chapter 11 on April 12, 2020 and liquidated ~279 stores, so any private-label gains are hypothetical absent a relaunched operating model. Control over design and sourcing typically strengthens negotiating leverage, yet MOQ, quality assurance and inventory risk create supplier pressure that can offset benefits. Execution capability ultimately dictates how much bargaining power shifts back to the retailer.
- Private label reduces branded spend
- Design+sourcing = stronger leverage
- MOQ, QA, inventory risk empower suppliers
- Execution capability determines net power shift
Apparel retailer faces moderate-high supplier power amid cloud and freight concentration
Stein Mart's supplier power is moderate-high: diversified apparel/import vendors and e-commerce switching lower single-vendor leverage, but brand access limits, MOQ/MAP constraints and smaller volumes versus mass retailers increase supplier influence. 2024 cloud hyperscalers >60% share and container rates ~20% of 2022 peaks (Drewry) amplify infrastructure and freight supplier power during tight cycles.
| Metric | 2024 |
|---|---|
| Cloud market share (top hyperscalers) | >60% |
| Container rates vs 2022 peak | ~20% |
| Store count post-2020 | ~0 retail; online focus |
What is included in the product
Detailed Word Document
Analyzes competitive intensity, buyer and supplier power, threat of new entrants and substitutes, and rivalry for Stein Mart—highlighting retail pressures from e-commerce, supplier consolidation, price-sensitive buyers, and low differentiation that compress margins and constrain profitability.
Customizable Excel Spreadsheet
Clear, one-sheet Porter's Five Forces for Stein Mart—instantly pinpoint competitive pain points, customize pressure levels with current data, and drop a clean chart into decks without macros or finance expertise.
Customers Bargaining Power
High price sensitivity online
Value shoppers compare Stein Mart pricing with Amazon (roughly 40% of US e‑commerce) and Walmart (around 10% share) and off‑price rivals like TJX (TJX net sales $51.9B FY2024), so transparent online pricing and frequent promotions amplify buyer power. Small price deltas often trigger switching, while deeper discounts and perceived value reliably drive conversion and basket lift.
Low switching costs
E-commerce buyers face minimal friction to try alternatives, reflected in a 69.57% global cart abandonment rate (Baymard Institute, 2023). Apparel e-commerce return rates average roughly 20–30%, so poor shipping, delivery speed, or returns policies spike abandonment. Stein Mart’s 2020 store closures eroded offline loyalty, increasing churn risk, and customers now leverage low switching costs to demand better pricing, faster delivery, and lenient returns.
Reviews and social proof
Ratings and user content drive buying: 92% of consumers consult reviews (BrightLocal 2024), amplifying customer power over Stein Mart’s assortment and pricing. Negative reviews can crater sell-through, forcing markdowns that compress margins; quick response and QC cut risk, while social channels can pivot demand in real time.
Returns expectations
Apparel returns average about 30% online versus ~8–10% in-store, driving customer expectations for easy, often free returns; liberal policies that lift e‑commerce conversion raise buyer power while adding $10–$20 average cost-to-serve per return and compressing Stein Mart margins. Tightening policies can cut return costs but risks a ~10–15% drop in conversion, so balancing CX and margin is a constant negotiation with buyers.
- 30% online apparel return rate
- $10–$20 avg cost per return
- 8–10% in-store return rate
- 10–15% conversion risk if returns tightened
Limited differentiation post-relaunch
As an online-only discounter, Stein Mart faces heavy assortment overlap with mass merchants and marketplaces, weakening uniqueness; 2024 U.S. e-commerce sales approached $1.1 trillion, intensifying competition. Without experiential stores, buyers focus on price, curation, and logistics, raising their bargaining leverage; weak differentiation increases price elasticity and churn, so brand rebuilding is required to capture margin.
- Overlap with mass merchants
- Price/curation/logistics-driven buying
- Higher buyer leverage, greater elasticity
- Need brand rebuilding to regain margin
69.57% cart loss, 30% returns empower shoppers, squeeze margins
Customers wield strong bargaining power: easy switching to Amazon/Walmart/TJX, high cart abandonment (69.57%) and 20–30% apparel return rates force frequent promotions and liberal returns that compress margins.
| Metric | Value |
|---|---|
| Amazon share | ~40% |
| TJX net sales FY2024 | $51.9B |
| Cart abandonment | 69.57% |
| Online return rate | 30% |
Preview the Actual Deliverable
Stein Mart, Inc. Porter's Five Forces Analysis
This Porter's Five Forces analysis for Stein Mart assesses industry rivalry, buyer and supplier power, threat of substitutes and new entrants, and strategic implications for an off‑price apparel retailer. It highlights strong competitive rivalry and high buyer power, moderate supplier leverage, significant substitute threats from online and value retailers, and low-to-moderate entry barriers. This preview shows the exact document you'll receive immediately after purchase—no surprises, no placeholders.











