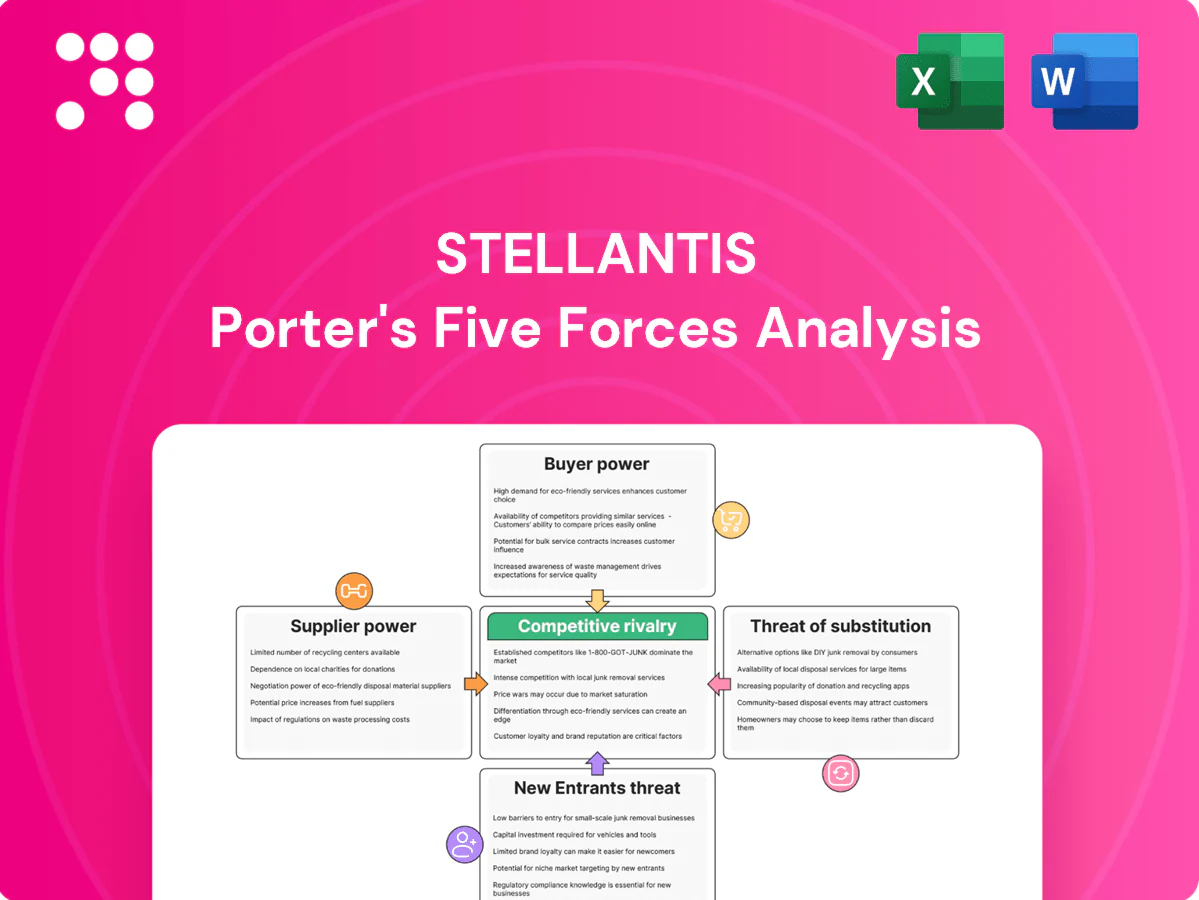
Stellantis Porter's Five Forces Analysis

From Overview to Strategy Blueprint
Stellantis faces intense industry rivalry, growing substitute threats from EV and mobility services, moderate supplier influence, and significant buyer power in key markets, while barriers keep new entrants relatively low-cost. This brief snapshot only scratches the surface. Unlock the full Porter's Five Forces Analysis to explore Stellantis’s competitive dynamics, market pressures, and strategic advantages in detail.
Suppliers Bargaining Power

Concentrated critical components
Semiconductor chips, batteries and advanced electronics come from a concentrated pool of tier-1 suppliers, raising switching costs and delivery risk for Stellantis. Shortages can halt production lines across plants, and long qualification cycles limit rapid multi-sourcing. Strategic inventory build-up and supplier partnerships partially mitigate supplier leverage.
Global platform standardization
Shared platforms across Stellantis’s 14 brands concentrate orders for over 6 million vehicles annually, expanding bargaining scope with suppliers and enabling aggregated demand to secure multi-year contracts and price concessions. Standardized parts amplify savings but create systemic exposure if a single supplier fails and affects entire platform families. Dual-sourcing key modules is therefore essential to retain negotiating power and operational resilience.

Raw material volatility
Volatility in lithium, nickel, steel and plastics—with lithium and nickel swings exceeding 30% in 2023–24—boosts supplier leverage over Stellantis; hedging and pass-through clauses blunt margin shocks but do not address availability risk. As EV mix rises (Stellantis BEV/PEV share reached roughly 10–15% of sales in 2024), battery-grade materials gain outsized importance. Strategic alliances and recycling programs reduce dependence and temper upstream power.

Regulatory and quality compliance
Suppliers must meet stringent safety (ISO 26262), emissions (EU target: 37.5% new car CO2 reduction by 2030 vs 2021) and cybersecurity rules, notably UN R155 entering force July 2024, narrowing the pool of qualified vendors and raising compliance costs that increase supplier stickiness and bargaining power.
- Compliance costs, regulatory risk, audits/scorecards align incentives; recalls/cyber failures give compliant suppliers negotiating leverage
Localization and logistics constraints
Localization and logistics constraints narrow supplier choices as regional sourcing to meet local content rules forces Stellantis to rely more on 30+ country manufacturing footprint and a supplier base exceeding 20,000, concentrating demand in key locales. Logistics bottlenecks and geopolitical tensions in 2024 amplified supplier influence, but Stellantis’s diversified footprint offsets single-region risk. Nearshoring and larger inventory buffers (inventory days rose in auto sector in 2023–24) reduce dependence on distant suppliers.
- Regional sourcing: higher local-content requirements
- Concentration: 30+ countries, 20,000+ suppliers
- Mitigation: diversified plants, nearshoring
- Buffers: increased inventory to hedge disruptions
Tier-1 supply concentration raises switching costs; 6M volumes boost buying leverage
Concentrated tier-1 supply for chips/batteries raises switching costs and delivery risk for Stellantis; platform volumes (~6.0M vehicles) give buying leverage. BEV/PEV share ~10–15% in 2024 increases battery-material importance while lithium/nickel swings >30% (2023–24) heighten supplier power. Stellantis uses 20,000+ suppliers across 30+ countries, hedging via partnerships, dual-sourcing and inventories.
| Metric | Value |
|---|---|
| Annual volumes | ~6.0M |
| BEV/PEV 2024 | 10–15% |
| Suppliers | 20,000+ |
| Countries | 30+ |
| Li/Ni price swing | >30% |
What is included in the product
 Detailed Word Document
Uncovers key drivers of competition, supplier and buyer power, entry barriers, substitutes, and competitive rivalry specific to Stellantis, highlighting disruptive threats and strategic levers that affect its pricing, profitability, and market position.

 Customizable Excel Spreadsheet
Clear, one-sheet Porter's Five Forces for Stellantis—instantly visualizes competitive pressures with a radar chart, customizable force levels for market shifts, and a clean layout ready to drop into pitch decks or integrate into Excel dashboards.
Customers Bargaining Power

Highly informed consumers
Price transparency, online configurators and reviews let buyers compare trim, incentives and TCO across brands in real time — by 2024 over 70% of shoppers used online tools to narrow choices, compressing dealer margins and heightening scrutiny of financing offers. Stellantis must differentiate through distinctive features, design and lower TCO to protect pricing power. Digital retailing boosts conversion but enforces stricter pricing discipline.
Fleet and commercial buyers
Large fleet and commercial buyers negotiate volume discounts and strict service-level commitments, leveraging scale to push prices and uptime clauses; in 2024 procurement teams increasingly demanded guaranteed availability windows. Switching costs exist but remain manageable across comparable van and light-truck models, enabling periodic retendering. Stellantis’s Pro One and expanded commercial portfolio help retain accounts by bundling financing, telematics and service, while total lifecycle cost and uptime assurances typically decide deal outcomes.

Brand portfolio as counterweight
Stellantis' 14-brand portfolio lets the group segment price points to reduce direct cannibalization and target diverse buyer tiers. Cross-selling across brands and channels helps retain customers shopping alternatives, lowering external bargaining power. Overlap in segments—especially compact SUVs and electrified models—can drive internal discounting and margin pressure. Clear, distinct positioning per brand curbs buyer leverage and preserves pricing power.

Financing and incentives
Access to Stellantis Financial Services boosts affordability and helps close deals, with OEM captive penetration in the US around 40% in 2024, raising conversion versus third-party offers. Buyers extract value through rate promotions and cash rebates — Stellantis and rivals used 0% APR and rebate packages frequently in 2024. Rising average new‑car APRs (~7% in 2024) makes buyers more sensitive to monthly payments. Tailored financing shifts negotiations toward total cost of ownership, tempering sticker-price bargaining power.
- captive-penetration: ~40% (US, 2024)
- avg-new-car-APR: ~7% (2024)
- promotions: 0% APR / rebates common (2024)
- strategy: value-focused financing reduces price pressure
After-sales and ecosystem
After-sales strength—service networks, warranties, OTA updates and parts availability—directly raises perceived value for Stellantis buyers; robust after-sales lowers switching and enhances loyalty. Weaknesses increase buyer bargaining power at purchase. Stellantis targets scaling software/OTA-driven revenue (goal €20bn by 2030), creating ongoing lock-in benefits.
- Service networks: global dealer/service footprint
- Warranties & parts: availability reduces leverage
- OTA updates: ongoing feature lock-in, software revenue target €20bn by 2030
- Weak after-sales raises buyer bargaining power
Buyers > 70% online; avg APR 7%; captive 40%; OTA €20bn
Buyers have high price transparency—>70% used online tools in 2024—compressing margins; captive financing (US penetration ~40%) and 0% APR/rebate promos moderate sticker pressure but rising avg new‑car APR (~7% in 2024) increases payment sensitivity. Large fleets exert strong volume leverage; after‑sales/OTA lock‑in (Stellantis software revenue target €20bn by 2030) reduces switching power.
| Metric | Value (2024/Target) |
|---|---|
| Online shoppers narrowing choices | >70% |
| Captive penetration (US) | ~40% |
| Avg new‑car APR | ~7% |
| Software/OTA revenue target | €20bn by 2030 |
Full Version Awaits
Stellantis Porter's Five Forces Analysis
This preview shows the exact Stellantis Porter’s Five Forces analysis you’ll receive immediately after purchase—no placeholders or mockups. The file is fully formatted, professionally written, and ready for download and use the moment you buy. It contains the complete assessment of competitive rivalry, supplier and buyer power, threats of new entrants and substitutes, and actionable implications for strategy and valuation.

From Overview to Strategy Blueprint
Stellantis faces intense industry rivalry, growing substitute threats from EV and mobility services, moderate supplier influence, and significant buyer power in key markets, while barriers keep new entrants relatively low-cost. This brief snapshot only scratches the surface. Unlock the full Porter's Five Forces Analysis to explore Stellantis’s competitive dynamics, market pressures, and strategic advantages in detail.
Suppliers Bargaining Power
Concentrated critical components
Semiconductor chips, batteries and advanced electronics come from a concentrated pool of tier-1 suppliers, raising switching costs and delivery risk for Stellantis. Shortages can halt production lines across plants, and long qualification cycles limit rapid multi-sourcing. Strategic inventory build-up and supplier partnerships partially mitigate supplier leverage.
Global platform standardization
Shared platforms across Stellantis’s 14 brands concentrate orders for over 6 million vehicles annually, expanding bargaining scope with suppliers and enabling aggregated demand to secure multi-year contracts and price concessions. Standardized parts amplify savings but create systemic exposure if a single supplier fails and affects entire platform families. Dual-sourcing key modules is therefore essential to retain negotiating power and operational resilience.
Raw material volatility
Volatility in lithium, nickel, steel and plastics—with lithium and nickel swings exceeding 30% in 2023–24—boosts supplier leverage over Stellantis; hedging and pass-through clauses blunt margin shocks but do not address availability risk. As EV mix rises (Stellantis BEV/PEV share reached roughly 10–15% of sales in 2024), battery-grade materials gain outsized importance. Strategic alliances and recycling programs reduce dependence and temper upstream power.
Regulatory and quality compliance
Suppliers must meet stringent safety (ISO 26262), emissions (EU target: 37.5% new car CO2 reduction by 2030 vs 2021) and cybersecurity rules, notably UN R155 entering force July 2024, narrowing the pool of qualified vendors and raising compliance costs that increase supplier stickiness and bargaining power.
- Compliance costs, regulatory risk, audits/scorecards align incentives; recalls/cyber failures give compliant suppliers negotiating leverage
Localization and logistics constraints
Localization and logistics constraints narrow supplier choices as regional sourcing to meet local content rules forces Stellantis to rely more on 30+ country manufacturing footprint and a supplier base exceeding 20,000, concentrating demand in key locales. Logistics bottlenecks and geopolitical tensions in 2024 amplified supplier influence, but Stellantis’s diversified footprint offsets single-region risk. Nearshoring and larger inventory buffers (inventory days rose in auto sector in 2023–24) reduce dependence on distant suppliers.
- Regional sourcing: higher local-content requirements
- Concentration: 30+ countries, 20,000+ suppliers
- Mitigation: diversified plants, nearshoring
- Buffers: increased inventory to hedge disruptions
Tier-1 supply concentration raises switching costs; 6M volumes boost buying leverage
Concentrated tier-1 supply for chips/batteries raises switching costs and delivery risk for Stellantis; platform volumes (~6.0M vehicles) give buying leverage. BEV/PEV share ~10–15% in 2024 increases battery-material importance while lithium/nickel swings >30% (2023–24) heighten supplier power. Stellantis uses 20,000+ suppliers across 30+ countries, hedging via partnerships, dual-sourcing and inventories.
| Metric | Value |
|---|---|
| Annual volumes | ~6.0M |
| BEV/PEV 2024 | 10–15% |
| Suppliers | 20,000+ |
| Countries | 30+ |
| Li/Ni price swing | >30% |
What is included in the product
Detailed Word Document
Uncovers key drivers of competition, supplier and buyer power, entry barriers, substitutes, and competitive rivalry specific to Stellantis, highlighting disruptive threats and strategic levers that affect its pricing, profitability, and market position.
Customizable Excel Spreadsheet
Clear, one-sheet Porter's Five Forces for Stellantis—instantly visualizes competitive pressures with a radar chart, customizable force levels for market shifts, and a clean layout ready to drop into pitch decks or integrate into Excel dashboards.
Customers Bargaining Power
Highly informed consumers
Price transparency, online configurators and reviews let buyers compare trim, incentives and TCO across brands in real time — by 2024 over 70% of shoppers used online tools to narrow choices, compressing dealer margins and heightening scrutiny of financing offers. Stellantis must differentiate through distinctive features, design and lower TCO to protect pricing power. Digital retailing boosts conversion but enforces stricter pricing discipline.
Fleet and commercial buyers
Large fleet and commercial buyers negotiate volume discounts and strict service-level commitments, leveraging scale to push prices and uptime clauses; in 2024 procurement teams increasingly demanded guaranteed availability windows. Switching costs exist but remain manageable across comparable van and light-truck models, enabling periodic retendering. Stellantis’s Pro One and expanded commercial portfolio help retain accounts by bundling financing, telematics and service, while total lifecycle cost and uptime assurances typically decide deal outcomes.
Brand portfolio as counterweight
Stellantis' 14-brand portfolio lets the group segment price points to reduce direct cannibalization and target diverse buyer tiers. Cross-selling across brands and channels helps retain customers shopping alternatives, lowering external bargaining power. Overlap in segments—especially compact SUVs and electrified models—can drive internal discounting and margin pressure. Clear, distinct positioning per brand curbs buyer leverage and preserves pricing power.
Financing and incentives
Access to Stellantis Financial Services boosts affordability and helps close deals, with OEM captive penetration in the US around 40% in 2024, raising conversion versus third-party offers. Buyers extract value through rate promotions and cash rebates — Stellantis and rivals used 0% APR and rebate packages frequently in 2024. Rising average new‑car APRs (~7% in 2024) makes buyers more sensitive to monthly payments. Tailored financing shifts negotiations toward total cost of ownership, tempering sticker-price bargaining power.
- captive-penetration: ~40% (US, 2024)
- avg-new-car-APR: ~7% (2024)
- promotions: 0% APR / rebates common (2024)
- strategy: value-focused financing reduces price pressure
After-sales and ecosystem
After-sales strength—service networks, warranties, OTA updates and parts availability—directly raises perceived value for Stellantis buyers; robust after-sales lowers switching and enhances loyalty. Weaknesses increase buyer bargaining power at purchase. Stellantis targets scaling software/OTA-driven revenue (goal €20bn by 2030), creating ongoing lock-in benefits.
- Service networks: global dealer/service footprint
- Warranties & parts: availability reduces leverage
- OTA updates: ongoing feature lock-in, software revenue target €20bn by 2030
- Weak after-sales raises buyer bargaining power
Buyers > 70% online; avg APR 7%; captive 40%; OTA €20bn
Buyers have high price transparency—>70% used online tools in 2024—compressing margins; captive financing (US penetration ~40%) and 0% APR/rebate promos moderate sticker pressure but rising avg new‑car APR (~7% in 2024) increases payment sensitivity. Large fleets exert strong volume leverage; after‑sales/OTA lock‑in (Stellantis software revenue target €20bn by 2030) reduces switching power.
| Metric | Value (2024/Target) |
|---|---|
| Online shoppers narrowing choices | >70% |
| Captive penetration (US) | ~40% |
| Avg new‑car APR | ~7% |
| Software/OTA revenue target | €20bn by 2030 |
Full Version Awaits
Stellantis Porter's Five Forces Analysis
This preview shows the exact Stellantis Porter’s Five Forces analysis you’ll receive immediately after purchase—no placeholders or mockups. The file is fully formatted, professionally written, and ready for download and use the moment you buy. It contains the complete assessment of competitive rivalry, supplier and buyer power, threats of new entrants and substitutes, and actionable implications for strategy and valuation.
Original: $10.00
-65%$10.00
$3.50Description
From Overview to Strategy Blueprint
Stellantis faces intense industry rivalry, growing substitute threats from EV and mobility services, moderate supplier influence, and significant buyer power in key markets, while barriers keep new entrants relatively low-cost. This brief snapshot only scratches the surface. Unlock the full Porter's Five Forces Analysis to explore Stellantis’s competitive dynamics, market pressures, and strategic advantages in detail.
Suppliers Bargaining Power
Concentrated critical components
Semiconductor chips, batteries and advanced electronics come from a concentrated pool of tier-1 suppliers, raising switching costs and delivery risk for Stellantis. Shortages can halt production lines across plants, and long qualification cycles limit rapid multi-sourcing. Strategic inventory build-up and supplier partnerships partially mitigate supplier leverage.
Global platform standardization
Shared platforms across Stellantis’s 14 brands concentrate orders for over 6 million vehicles annually, expanding bargaining scope with suppliers and enabling aggregated demand to secure multi-year contracts and price concessions. Standardized parts amplify savings but create systemic exposure if a single supplier fails and affects entire platform families. Dual-sourcing key modules is therefore essential to retain negotiating power and operational resilience.
Raw material volatility
Volatility in lithium, nickel, steel and plastics—with lithium and nickel swings exceeding 30% in 2023–24—boosts supplier leverage over Stellantis; hedging and pass-through clauses blunt margin shocks but do not address availability risk. As EV mix rises (Stellantis BEV/PEV share reached roughly 10–15% of sales in 2024), battery-grade materials gain outsized importance. Strategic alliances and recycling programs reduce dependence and temper upstream power.
Regulatory and quality compliance
Suppliers must meet stringent safety (ISO 26262), emissions (EU target: 37.5% new car CO2 reduction by 2030 vs 2021) and cybersecurity rules, notably UN R155 entering force July 2024, narrowing the pool of qualified vendors and raising compliance costs that increase supplier stickiness and bargaining power.
- Compliance costs, regulatory risk, audits/scorecards align incentives; recalls/cyber failures give compliant suppliers negotiating leverage
Localization and logistics constraints
Localization and logistics constraints narrow supplier choices as regional sourcing to meet local content rules forces Stellantis to rely more on 30+ country manufacturing footprint and a supplier base exceeding 20,000, concentrating demand in key locales. Logistics bottlenecks and geopolitical tensions in 2024 amplified supplier influence, but Stellantis’s diversified footprint offsets single-region risk. Nearshoring and larger inventory buffers (inventory days rose in auto sector in 2023–24) reduce dependence on distant suppliers.
- Regional sourcing: higher local-content requirements
- Concentration: 30+ countries, 20,000+ suppliers
- Mitigation: diversified plants, nearshoring
- Buffers: increased inventory to hedge disruptions
Tier-1 supply concentration raises switching costs; 6M volumes boost buying leverage
Concentrated tier-1 supply for chips/batteries raises switching costs and delivery risk for Stellantis; platform volumes (~6.0M vehicles) give buying leverage. BEV/PEV share ~10–15% in 2024 increases battery-material importance while lithium/nickel swings >30% (2023–24) heighten supplier power. Stellantis uses 20,000+ suppliers across 30+ countries, hedging via partnerships, dual-sourcing and inventories.
| Metric | Value |
|---|---|
| Annual volumes | ~6.0M |
| BEV/PEV 2024 | 10–15% |
| Suppliers | 20,000+ |
| Countries | 30+ |
| Li/Ni price swing | >30% |
What is included in the product
Detailed Word Document
Uncovers key drivers of competition, supplier and buyer power, entry barriers, substitutes, and competitive rivalry specific to Stellantis, highlighting disruptive threats and strategic levers that affect its pricing, profitability, and market position.
Customizable Excel Spreadsheet
Clear, one-sheet Porter's Five Forces for Stellantis—instantly visualizes competitive pressures with a radar chart, customizable force levels for market shifts, and a clean layout ready to drop into pitch decks or integrate into Excel dashboards.
Customers Bargaining Power
Highly informed consumers
Price transparency, online configurators and reviews let buyers compare trim, incentives and TCO across brands in real time — by 2024 over 70% of shoppers used online tools to narrow choices, compressing dealer margins and heightening scrutiny of financing offers. Stellantis must differentiate through distinctive features, design and lower TCO to protect pricing power. Digital retailing boosts conversion but enforces stricter pricing discipline.
Fleet and commercial buyers
Large fleet and commercial buyers negotiate volume discounts and strict service-level commitments, leveraging scale to push prices and uptime clauses; in 2024 procurement teams increasingly demanded guaranteed availability windows. Switching costs exist but remain manageable across comparable van and light-truck models, enabling periodic retendering. Stellantis’s Pro One and expanded commercial portfolio help retain accounts by bundling financing, telematics and service, while total lifecycle cost and uptime assurances typically decide deal outcomes.
Brand portfolio as counterweight
Stellantis' 14-brand portfolio lets the group segment price points to reduce direct cannibalization and target diverse buyer tiers. Cross-selling across brands and channels helps retain customers shopping alternatives, lowering external bargaining power. Overlap in segments—especially compact SUVs and electrified models—can drive internal discounting and margin pressure. Clear, distinct positioning per brand curbs buyer leverage and preserves pricing power.
Financing and incentives
Access to Stellantis Financial Services boosts affordability and helps close deals, with OEM captive penetration in the US around 40% in 2024, raising conversion versus third-party offers. Buyers extract value through rate promotions and cash rebates — Stellantis and rivals used 0% APR and rebate packages frequently in 2024. Rising average new‑car APRs (~7% in 2024) makes buyers more sensitive to monthly payments. Tailored financing shifts negotiations toward total cost of ownership, tempering sticker-price bargaining power.
- captive-penetration: ~40% (US, 2024)
- avg-new-car-APR: ~7% (2024)
- promotions: 0% APR / rebates common (2024)
- strategy: value-focused financing reduces price pressure
After-sales and ecosystem
After-sales strength—service networks, warranties, OTA updates and parts availability—directly raises perceived value for Stellantis buyers; robust after-sales lowers switching and enhances loyalty. Weaknesses increase buyer bargaining power at purchase. Stellantis targets scaling software/OTA-driven revenue (goal €20bn by 2030), creating ongoing lock-in benefits.
- Service networks: global dealer/service footprint
- Warranties & parts: availability reduces leverage
- OTA updates: ongoing feature lock-in, software revenue target €20bn by 2030
- Weak after-sales raises buyer bargaining power
Buyers > 70% online; avg APR 7%; captive 40%; OTA €20bn
Buyers have high price transparency—>70% used online tools in 2024—compressing margins; captive financing (US penetration ~40%) and 0% APR/rebate promos moderate sticker pressure but rising avg new‑car APR (~7% in 2024) increases payment sensitivity. Large fleets exert strong volume leverage; after‑sales/OTA lock‑in (Stellantis software revenue target €20bn by 2030) reduces switching power.
| Metric | Value (2024/Target) |
|---|---|
| Online shoppers narrowing choices | >70% |
| Captive penetration (US) | ~40% |
| Avg new‑car APR | ~7% |
| Software/OTA revenue target | €20bn by 2030 |
Full Version Awaits
Stellantis Porter's Five Forces Analysis
This preview shows the exact Stellantis Porter’s Five Forces analysis you’ll receive immediately after purchase—no placeholders or mockups. The file is fully formatted, professionally written, and ready for download and use the moment you buy. It contains the complete assessment of competitive rivalry, supplier and buyer power, threats of new entrants and substitutes, and actionable implications for strategy and valuation.











