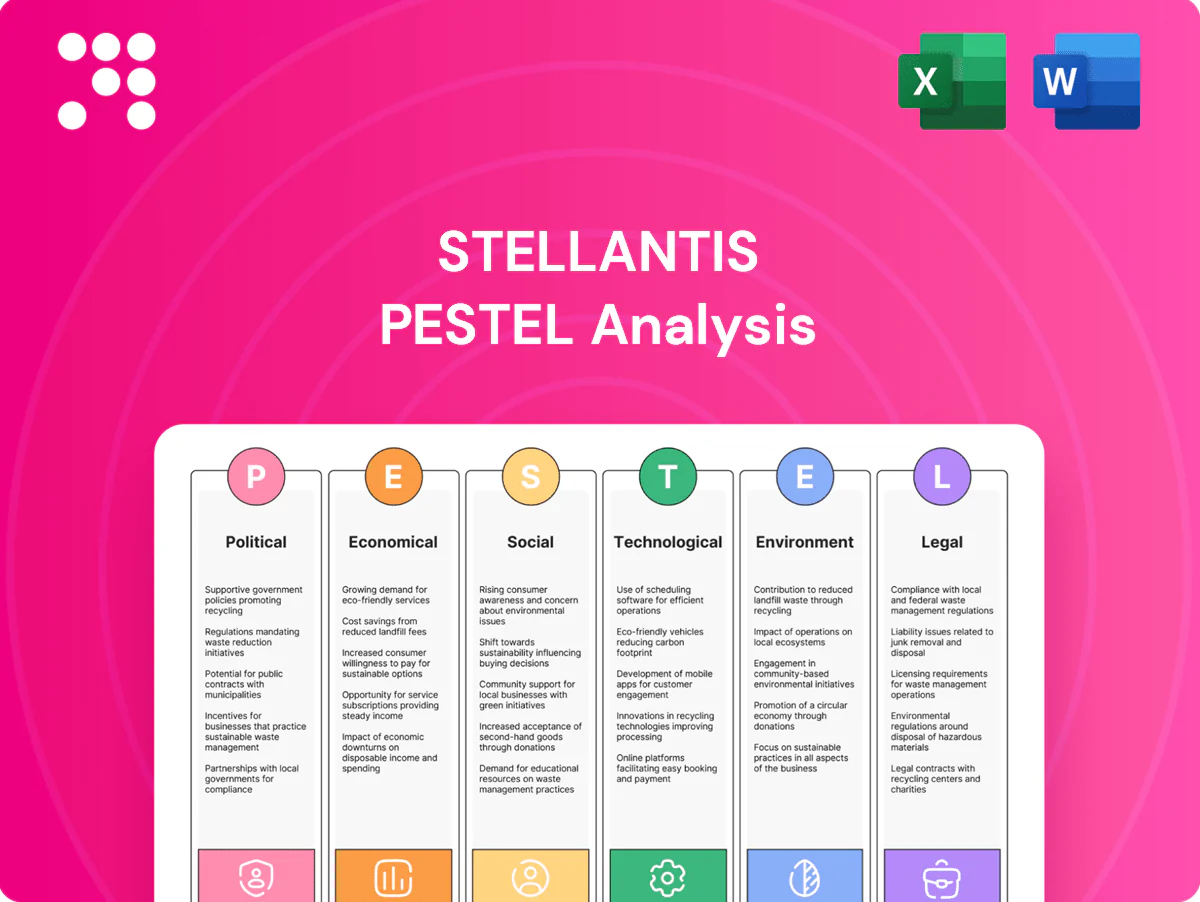
Stellantis PESTLE Analysis

Make Smarter Strategic Decisions with a Complete PESTEL View
Unlock strategic clarity with our expert PESTLE Analysis of Stellantis—three to five sentence snapshot revealing how political shifts, economic cycles, and tech disruption shape its competitive edge. Ideal for investors and strategists, the full report delivers actionable, ready-to-use insights; buy now to access the complete, editable analysis.
Political factors

EV incentives and industrial policy
Government subsidies, tax credits and local content rules — notably the U.S. Inflation Reduction Act with up to $7,500 EV tax credits and €369bn-equivalent energy measures in scope — plus the EU Green Deal (55% new-car CO2 cut by 2030) shape EV adoption and production footprints. Stellantis, which pledged roughly €30bn for EVs/software through 2025, must align product plans with EU, U.S. and Asian schemes. Policy shifts can pull-forward or delay demand, affecting capacity utilization and margins. Localization rules drive siting of battery plants and local supply partnerships.
Trade tariffs and geopolitics
Tariff regimes on vehicles, batteries and critical minerals directly pressure pricing and margins: the EU applies a 10% common external tariff on passenger cars while the US tariff is 2.5% for cars (25% for light trucks), raising exposure to duty shocks. EU–China and US–China tensions and anti‑dumping probes add import/export uncertainty. Stellantis needs flexible, diversified sourcing to hedge tariff shocks given China controls roughly 70% of battery processing; political instability in sourcing regions can disrupt logistics and component flow.

Public procurement and fleet electrification
Public procurement—estimated by UNCTAD at around 12% of global GDP—can create anchor demand as governments electrify fleets and public transport; compliance with local procurement rules often favors domestic production and partnerships, benefiting suppliers that localize manufacturing. Stellantis can leverage its commercial EVs (eg e-Deliver, e‑Ducato) to win tenders, while policy timelines shape model launch priorities and homologation sequences.

Regional regulatory fragmentation
Regional regulatory fragmentation across the EU, USMCA, Mercosur and Asia — with the EU mandating a 100% new-car CO2 reduction by 2035 — raises homologation and safety/emissions complexity for Stellantis and its global brands.
- Harmonize architectures to cut variant homologation time
- Scan regulations continuously
- Plan brand portfolio for rapid political shifts
Energy security and industrial resilience
Policies promoting energy independence and reshoring raise Stellantis production costs short-term but can lower supply risk; Stellantis targets full BEV sales in Europe by 2030 and must adapt capital allocation accordingly. Incentives such as the US IRA $7,500 EV credit and EU battery IPCEI (~€3.2bn) spur local materials and refining ecosystems. Stellantis must engage policymakers to secure grid access, fast-track permits and align projects to unlock grants that can cover significant capex for gigafactories and software hubs.
- policy-impact: IRA $7,500 EV credit, EU IPCEI ~€3.2bn
- strategy: align with policymakers for grid access & permits
- opportunity: grants/credits can subsidize large share of gigafactory capex
EV incentives, tariffs and China battery dominance force automaker to allocate €30bn
EV incentives (US IRA $7,500; EU Green Deal 55% CO2 cut by 2030, 100% by 2035) and tariffs (EU 10% cars; US 2.5% cars) shape Stellantis product siting and margins as it spends ~€30bn on EVs/software to 2025. Localization and battery-policy grants (EU IPCEI ~€3.2bn) drive CAPEX allocation; China controls ~70% battery processing, raising sourcing risk.
| Policy | Impact | Key figure |
|---|---|---|
| US IRA | Demand subsidy | $7,500 |
| EU Green Deal | Emissions cap | 55% by 2030/100% by 2035 |
| Stellantis EV spend | Capex | ~€30bn to 2025 |
What is included in the product
 Detailed Word Document
Explores how external macro-environmental factors uniquely affect Stellantis across six dimensions—Political, Economic, Social, Technological, Environmental, and Legal—backed by data and current trends to identify threats and opportunities. Designed for executives and advisers, it reflects regional market and regulatory dynamics and includes forward-looking insights for scenario planning and strategic action.

 Customizable Excel Spreadsheet
A concise, visually segmented Stellantis PESTLE summary that eases risk discussions and market positioning, editable for region or business line and ready to drop into presentations or share across teams for quick alignment.
Economic factors

Interest rates and auto financing
Higher policy rates (Fed funds around 5.25–5.50% in mid‑2024/early‑2025) push average new‑car loan APRs and monthly payments up, squeezing affordability and lowering volume. Stellantis Financial Services' captive performance directly affects retail demand by underwriting credit; weaker credit spreads reduce approvals. Stellantis uses subvented rates and leasing to smooth cycles, and rate cuts or stabilization can quickly unlock pent‑up demand.
Consumer demand cycles
Macro slowdowns shift consumer mix toward value brands and smaller vehicles. Fleet and commercial demand can be more resilient than retail, with fleet often accounting for roughly 30% of European volumes. Stellantis' 14-brand portfolio allows broad price-point coverage, and strict inventory discipline plus targeted incentive management help protect residual values.

Input costs and commodity volatility
Volatility in lithium (prices fell over 70% from 2022 peaks to 2024), nickel, steel and semiconductor markets drives margin swings for Stellantis, affecting battery and vehicle BOM costs and gross margin variability. Long-term offtake contracts and hedging programs temper short-term cost shocks while vertical battery partnerships (joint ventures and cell investments) stabilize supply and pricing. Design-to-cost initiatives and platform reuse (e.g., STLA platforms) improve unit economics by spreading R&D and procurement savings across higher volumes.

Currency fluctuations
Stellantis faces FX exposure from revenue and cost bases across EUR, USD, BRL and CNY; group revenue was €179.6bn in 2023, amplifying translation risk. Natural hedging via local production and financial hedges limit volatility, while pricing power differs by brand and segment, and greater localization reduces transaction and translation risk.
- EUR/USD, BRL, CNY exposure
- Natural hedges + derivatives
- Brand/segment pricing power
- Localization reduces FX impact
Scale economies and platform efficiency
Merging FCA and PSA in 2021 enabled common STLA platforms and shared modules, raising volumes on EV architectures and lowering per‑unit costs; management cited around €5 billion of merger synergies to be realized. Shared R&D and centralized procurement have enhanced bargaining power, while efficient plant loading across 400+ manufacturing sites boosts returns on invested capital.
- 2021 merger: common platforms
- €5 billion target synergies
- Higher EV volumes → lower unit cost
- Centralized R&D/procurement ↑ bargaining power
- Efficient plant loading → improved ROIC
EV incentives, tariffs and China battery dominance force automaker to allocate €30bn
Higher rates (Fed 5.25–5.50% mid‑2024) squeeze retail affordability; Stellantis Financial Services and subvented offers smooth demand. Macro slowdown shifts mix to value models; fleet ~30% EU volumes cushions volume. Commodity swings (lithium down >70% 2022–24) and FX (revenue €179.6bn 2023) drive margin volatility; merger synergies ~€5bn improve unit economics.
| Metric | Value |
|---|---|
| Group revenue | €179.6bn (2023) |
| Fed funds | 5.25–5.50% (mid‑2024) |
| Lithium price change | −>70% (2022–24) |
| EU fleet share | ~30% |
| Merger synergies | ~€5bn |
What You See Is What You Get
Stellantis PESTLE Analysis
This Stellantis PESTLE Analysis preview is the exact document you’ll receive after purchase—fully formatted and ready to use. The content, structure and layout shown here are the real file you’ll download immediately after payment. No placeholders or teasers—this is the final, professionally structured report.

Make Smarter Strategic Decisions with a Complete PESTEL View
Unlock strategic clarity with our expert PESTLE Analysis of Stellantis—three to five sentence snapshot revealing how political shifts, economic cycles, and tech disruption shape its competitive edge. Ideal for investors and strategists, the full report delivers actionable, ready-to-use insights; buy now to access the complete, editable analysis.
Political factors
EV incentives and industrial policy
Government subsidies, tax credits and local content rules — notably the U.S. Inflation Reduction Act with up to $7,500 EV tax credits and €369bn-equivalent energy measures in scope — plus the EU Green Deal (55% new-car CO2 cut by 2030) shape EV adoption and production footprints. Stellantis, which pledged roughly €30bn for EVs/software through 2025, must align product plans with EU, U.S. and Asian schemes. Policy shifts can pull-forward or delay demand, affecting capacity utilization and margins. Localization rules drive siting of battery plants and local supply partnerships.
Trade tariffs and geopolitics
Tariff regimes on vehicles, batteries and critical minerals directly pressure pricing and margins: the EU applies a 10% common external tariff on passenger cars while the US tariff is 2.5% for cars (25% for light trucks), raising exposure to duty shocks. EU–China and US–China tensions and anti‑dumping probes add import/export uncertainty. Stellantis needs flexible, diversified sourcing to hedge tariff shocks given China controls roughly 70% of battery processing; political instability in sourcing regions can disrupt logistics and component flow.
Public procurement and fleet electrification
Public procurement—estimated by UNCTAD at around 12% of global GDP—can create anchor demand as governments electrify fleets and public transport; compliance with local procurement rules often favors domestic production and partnerships, benefiting suppliers that localize manufacturing. Stellantis can leverage its commercial EVs (eg e-Deliver, e‑Ducato) to win tenders, while policy timelines shape model launch priorities and homologation sequences.
Regional regulatory fragmentation
Regional regulatory fragmentation across the EU, USMCA, Mercosur and Asia — with the EU mandating a 100% new-car CO2 reduction by 2035 — raises homologation and safety/emissions complexity for Stellantis and its global brands.
- Harmonize architectures to cut variant homologation time
- Scan regulations continuously
- Plan brand portfolio for rapid political shifts
Energy security and industrial resilience
Policies promoting energy independence and reshoring raise Stellantis production costs short-term but can lower supply risk; Stellantis targets full BEV sales in Europe by 2030 and must adapt capital allocation accordingly. Incentives such as the US IRA $7,500 EV credit and EU battery IPCEI (~€3.2bn) spur local materials and refining ecosystems. Stellantis must engage policymakers to secure grid access, fast-track permits and align projects to unlock grants that can cover significant capex for gigafactories and software hubs.
- policy-impact: IRA $7,500 EV credit, EU IPCEI ~€3.2bn
- strategy: align with policymakers for grid access & permits
- opportunity: grants/credits can subsidize large share of gigafactory capex
EV incentives, tariffs and China battery dominance force automaker to allocate €30bn
EV incentives (US IRA $7,500; EU Green Deal 55% CO2 cut by 2030, 100% by 2035) and tariffs (EU 10% cars; US 2.5% cars) shape Stellantis product siting and margins as it spends ~€30bn on EVs/software to 2025. Localization and battery-policy grants (EU IPCEI ~€3.2bn) drive CAPEX allocation; China controls ~70% battery processing, raising sourcing risk.
| Policy | Impact | Key figure |
|---|---|---|
| US IRA | Demand subsidy | $7,500 |
| EU Green Deal | Emissions cap | 55% by 2030/100% by 2035 |
| Stellantis EV spend | Capex | ~€30bn to 2025 |
What is included in the product
Detailed Word Document
Explores how external macro-environmental factors uniquely affect Stellantis across six dimensions—Political, Economic, Social, Technological, Environmental, and Legal—backed by data and current trends to identify threats and opportunities. Designed for executives and advisers, it reflects regional market and regulatory dynamics and includes forward-looking insights for scenario planning and strategic action.
Customizable Excel Spreadsheet
A concise, visually segmented Stellantis PESTLE summary that eases risk discussions and market positioning, editable for region or business line and ready to drop into presentations or share across teams for quick alignment.
Economic factors
Interest rates and auto financing
Higher policy rates (Fed funds around 5.25–5.50% in mid‑2024/early‑2025) push average new‑car loan APRs and monthly payments up, squeezing affordability and lowering volume. Stellantis Financial Services' captive performance directly affects retail demand by underwriting credit; weaker credit spreads reduce approvals. Stellantis uses subvented rates and leasing to smooth cycles, and rate cuts or stabilization can quickly unlock pent‑up demand.
Consumer demand cycles
Macro slowdowns shift consumer mix toward value brands and smaller vehicles. Fleet and commercial demand can be more resilient than retail, with fleet often accounting for roughly 30% of European volumes. Stellantis' 14-brand portfolio allows broad price-point coverage, and strict inventory discipline plus targeted incentive management help protect residual values.
Input costs and commodity volatility
Volatility in lithium (prices fell over 70% from 2022 peaks to 2024), nickel, steel and semiconductor markets drives margin swings for Stellantis, affecting battery and vehicle BOM costs and gross margin variability. Long-term offtake contracts and hedging programs temper short-term cost shocks while vertical battery partnerships (joint ventures and cell investments) stabilize supply and pricing. Design-to-cost initiatives and platform reuse (e.g., STLA platforms) improve unit economics by spreading R&D and procurement savings across higher volumes.
Currency fluctuations
Stellantis faces FX exposure from revenue and cost bases across EUR, USD, BRL and CNY; group revenue was €179.6bn in 2023, amplifying translation risk. Natural hedging via local production and financial hedges limit volatility, while pricing power differs by brand and segment, and greater localization reduces transaction and translation risk.
- EUR/USD, BRL, CNY exposure
- Natural hedges + derivatives
- Brand/segment pricing power
- Localization reduces FX impact
Scale economies and platform efficiency
Merging FCA and PSA in 2021 enabled common STLA platforms and shared modules, raising volumes on EV architectures and lowering per‑unit costs; management cited around €5 billion of merger synergies to be realized. Shared R&D and centralized procurement have enhanced bargaining power, while efficient plant loading across 400+ manufacturing sites boosts returns on invested capital.
- 2021 merger: common platforms
- €5 billion target synergies
- Higher EV volumes → lower unit cost
- Centralized R&D/procurement ↑ bargaining power
- Efficient plant loading → improved ROIC
EV incentives, tariffs and China battery dominance force automaker to allocate €30bn
Higher rates (Fed 5.25–5.50% mid‑2024) squeeze retail affordability; Stellantis Financial Services and subvented offers smooth demand. Macro slowdown shifts mix to value models; fleet ~30% EU volumes cushions volume. Commodity swings (lithium down >70% 2022–24) and FX (revenue €179.6bn 2023) drive margin volatility; merger synergies ~€5bn improve unit economics.
| Metric | Value |
|---|---|
| Group revenue | €179.6bn (2023) |
| Fed funds | 5.25–5.50% (mid‑2024) |
| Lithium price change | −>70% (2022–24) |
| EU fleet share | ~30% |
| Merger synergies | ~€5bn |
What You See Is What You Get
Stellantis PESTLE Analysis
This Stellantis PESTLE Analysis preview is the exact document you’ll receive after purchase—fully formatted and ready to use. The content, structure and layout shown here are the real file you’ll download immediately after payment. No placeholders or teasers—this is the final, professionally structured report.
Original: $10.00
-65%$10.00
$3.50Description
Make Smarter Strategic Decisions with a Complete PESTEL View
Unlock strategic clarity with our expert PESTLE Analysis of Stellantis—three to five sentence snapshot revealing how political shifts, economic cycles, and tech disruption shape its competitive edge. Ideal for investors and strategists, the full report delivers actionable, ready-to-use insights; buy now to access the complete, editable analysis.
Political factors
EV incentives and industrial policy
Government subsidies, tax credits and local content rules — notably the U.S. Inflation Reduction Act with up to $7,500 EV tax credits and €369bn-equivalent energy measures in scope — plus the EU Green Deal (55% new-car CO2 cut by 2030) shape EV adoption and production footprints. Stellantis, which pledged roughly €30bn for EVs/software through 2025, must align product plans with EU, U.S. and Asian schemes. Policy shifts can pull-forward or delay demand, affecting capacity utilization and margins. Localization rules drive siting of battery plants and local supply partnerships.
Trade tariffs and geopolitics
Tariff regimes on vehicles, batteries and critical minerals directly pressure pricing and margins: the EU applies a 10% common external tariff on passenger cars while the US tariff is 2.5% for cars (25% for light trucks), raising exposure to duty shocks. EU–China and US–China tensions and anti‑dumping probes add import/export uncertainty. Stellantis needs flexible, diversified sourcing to hedge tariff shocks given China controls roughly 70% of battery processing; political instability in sourcing regions can disrupt logistics and component flow.
Public procurement and fleet electrification
Public procurement—estimated by UNCTAD at around 12% of global GDP—can create anchor demand as governments electrify fleets and public transport; compliance with local procurement rules often favors domestic production and partnerships, benefiting suppliers that localize manufacturing. Stellantis can leverage its commercial EVs (eg e-Deliver, e‑Ducato) to win tenders, while policy timelines shape model launch priorities and homologation sequences.
Regional regulatory fragmentation
Regional regulatory fragmentation across the EU, USMCA, Mercosur and Asia — with the EU mandating a 100% new-car CO2 reduction by 2035 — raises homologation and safety/emissions complexity for Stellantis and its global brands.
- Harmonize architectures to cut variant homologation time
- Scan regulations continuously
- Plan brand portfolio for rapid political shifts
Energy security and industrial resilience
Policies promoting energy independence and reshoring raise Stellantis production costs short-term but can lower supply risk; Stellantis targets full BEV sales in Europe by 2030 and must adapt capital allocation accordingly. Incentives such as the US IRA $7,500 EV credit and EU battery IPCEI (~€3.2bn) spur local materials and refining ecosystems. Stellantis must engage policymakers to secure grid access, fast-track permits and align projects to unlock grants that can cover significant capex for gigafactories and software hubs.
- policy-impact: IRA $7,500 EV credit, EU IPCEI ~€3.2bn
- strategy: align with policymakers for grid access & permits
- opportunity: grants/credits can subsidize large share of gigafactory capex
EV incentives, tariffs and China battery dominance force automaker to allocate €30bn
EV incentives (US IRA $7,500; EU Green Deal 55% CO2 cut by 2030, 100% by 2035) and tariffs (EU 10% cars; US 2.5% cars) shape Stellantis product siting and margins as it spends ~€30bn on EVs/software to 2025. Localization and battery-policy grants (EU IPCEI ~€3.2bn) drive CAPEX allocation; China controls ~70% battery processing, raising sourcing risk.
| Policy | Impact | Key figure |
|---|---|---|
| US IRA | Demand subsidy | $7,500 |
| EU Green Deal | Emissions cap | 55% by 2030/100% by 2035 |
| Stellantis EV spend | Capex | ~€30bn to 2025 |
What is included in the product
Detailed Word Document
Explores how external macro-environmental factors uniquely affect Stellantis across six dimensions—Political, Economic, Social, Technological, Environmental, and Legal—backed by data and current trends to identify threats and opportunities. Designed for executives and advisers, it reflects regional market and regulatory dynamics and includes forward-looking insights for scenario planning and strategic action.
Customizable Excel Spreadsheet
A concise, visually segmented Stellantis PESTLE summary that eases risk discussions and market positioning, editable for region or business line and ready to drop into presentations or share across teams for quick alignment.
Economic factors
Interest rates and auto financing
Higher policy rates (Fed funds around 5.25–5.50% in mid‑2024/early‑2025) push average new‑car loan APRs and monthly payments up, squeezing affordability and lowering volume. Stellantis Financial Services' captive performance directly affects retail demand by underwriting credit; weaker credit spreads reduce approvals. Stellantis uses subvented rates and leasing to smooth cycles, and rate cuts or stabilization can quickly unlock pent‑up demand.
Consumer demand cycles
Macro slowdowns shift consumer mix toward value brands and smaller vehicles. Fleet and commercial demand can be more resilient than retail, with fleet often accounting for roughly 30% of European volumes. Stellantis' 14-brand portfolio allows broad price-point coverage, and strict inventory discipline plus targeted incentive management help protect residual values.
Input costs and commodity volatility
Volatility in lithium (prices fell over 70% from 2022 peaks to 2024), nickel, steel and semiconductor markets drives margin swings for Stellantis, affecting battery and vehicle BOM costs and gross margin variability. Long-term offtake contracts and hedging programs temper short-term cost shocks while vertical battery partnerships (joint ventures and cell investments) stabilize supply and pricing. Design-to-cost initiatives and platform reuse (e.g., STLA platforms) improve unit economics by spreading R&D and procurement savings across higher volumes.
Currency fluctuations
Stellantis faces FX exposure from revenue and cost bases across EUR, USD, BRL and CNY; group revenue was €179.6bn in 2023, amplifying translation risk. Natural hedging via local production and financial hedges limit volatility, while pricing power differs by brand and segment, and greater localization reduces transaction and translation risk.
- EUR/USD, BRL, CNY exposure
- Natural hedges + derivatives
- Brand/segment pricing power
- Localization reduces FX impact
Scale economies and platform efficiency
Merging FCA and PSA in 2021 enabled common STLA platforms and shared modules, raising volumes on EV architectures and lowering per‑unit costs; management cited around €5 billion of merger synergies to be realized. Shared R&D and centralized procurement have enhanced bargaining power, while efficient plant loading across 400+ manufacturing sites boosts returns on invested capital.
- 2021 merger: common platforms
- €5 billion target synergies
- Higher EV volumes → lower unit cost
- Centralized R&D/procurement ↑ bargaining power
- Efficient plant loading → improved ROIC
EV incentives, tariffs and China battery dominance force automaker to allocate €30bn
Higher rates (Fed 5.25–5.50% mid‑2024) squeeze retail affordability; Stellantis Financial Services and subvented offers smooth demand. Macro slowdown shifts mix to value models; fleet ~30% EU volumes cushions volume. Commodity swings (lithium down >70% 2022–24) and FX (revenue €179.6bn 2023) drive margin volatility; merger synergies ~€5bn improve unit economics.
| Metric | Value |
|---|---|
| Group revenue | €179.6bn (2023) |
| Fed funds | 5.25–5.50% (mid‑2024) |
| Lithium price change | −>70% (2022–24) |
| EU fleet share | ~30% |
| Merger synergies | ~€5bn |
What You See Is What You Get
Stellantis PESTLE Analysis
This Stellantis PESTLE Analysis preview is the exact document you’ll receive after purchase—fully formatted and ready to use. The content, structure and layout shown here are the real file you’ll download immediately after payment. No placeholders or teasers—this is the final, professionally structured report.











