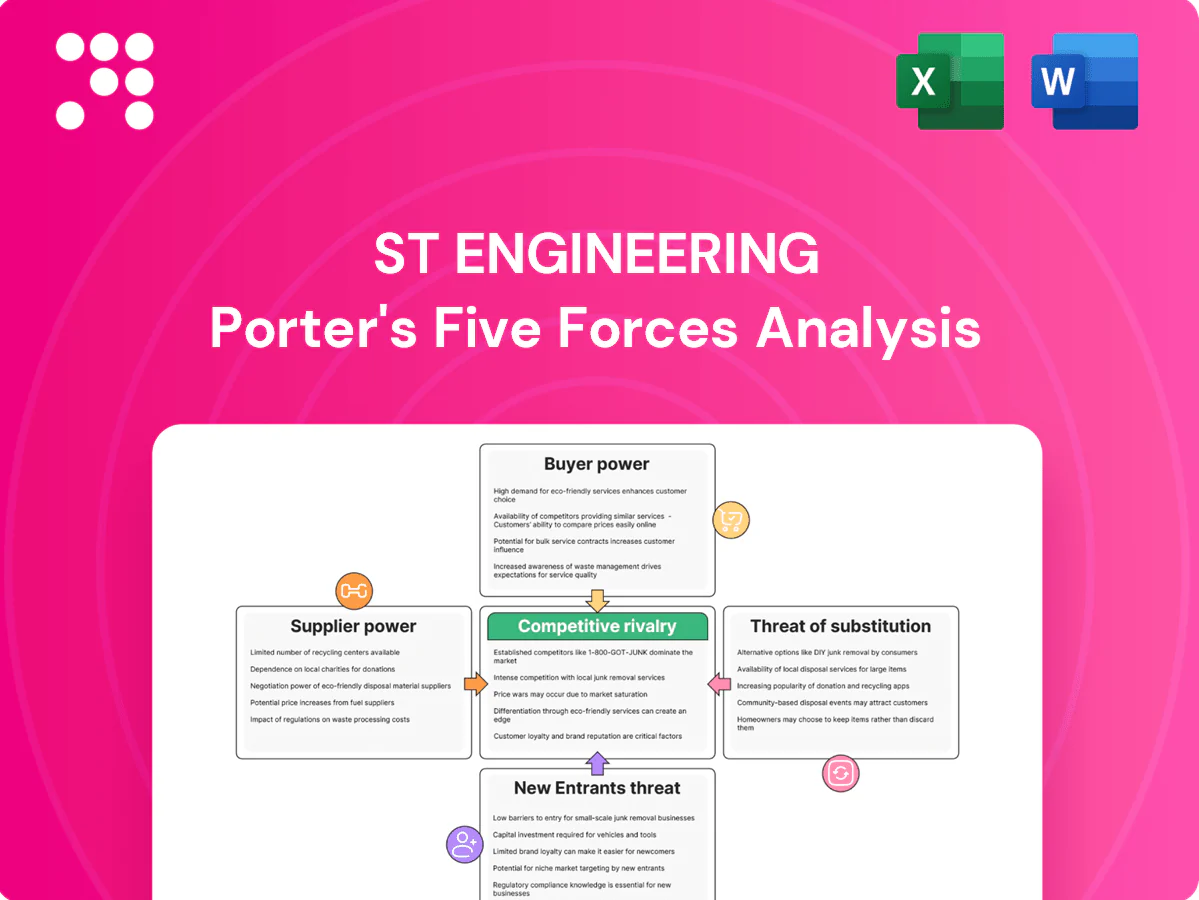
ST Engineering Porter's Five Forces Analysis

Don't Miss the Bigger Picture
ST Engineering faces moderate supplier power, intense buyer scrutiny, high barriers to entry but strong competitive rivalry across aerospace, defence and smart-city units; substitutes and regulatory shifts pose targeted risks. This snapshot highlights key tensions and strategic levers. Unlock the full Porter's Five Forces Analysis to explore force-by-force ratings, visuals and actionable implications tailored to ST Engineering.
Suppliers Bargaining Power

Concentrated critical components
As of 2024 ST Engineering depends on a small set of aerospace OEMs and Tier‑1s for engines, avionics and proprietary spares. These suppliers exert pricing and delivery power due to certification lock‑in and long qualification cycles. Limited qualified alternatives heighten exposure to shortages and service disruptions. Dual‑sourcing is possible in some categories but remains infeasible for many safety‑critical parts.
Specialized tech inputs
Specialized inputs—semiconductors (global market ~US$600B in 2024), cybersecurity tools (~US$170B) and robotics modules (~US$55B)—come from niche vendors, letting rapid tech cycles and strong IP tilt pricing and roadmap control to suppliers. Component obsolescence raises lifecycle costs and replacement risk, while strategic partnerships and early design engagement reduce supplier leverage.

Regulatory and certification barriers
As of 2024 FAA and EASA certification regimes plus ITAR/EAR export controls create high barriers to supplier substitution, since approved parts lists and supplier qualifications limit eligible vendors. Supplier pools are therefore concentrated, switching requires costly requalification and months of testing, reinforcing supplier leverage. ST Engineering and peers commonly use long‑term framework agreements to exchange price concessions for assured compliance and supply continuity.

Logistics and geopolitical exposure
Logistics and geopolitical exposure raise supplier power for ST Engineering as global supply chains face freight volatility (Baltic Dry Index averaged ~1,400 in 2024) and sanctions risk; defense and dual‑use goods incur licensing delays suppliers pass on, often adding 6–12 months to lead times and premium costs. Regionalization and inventory buffers blunt shocks but can lift working capital by ~10–20%; nearshoring and vendor‑managed inventory programs can cut disruption risk and trim lead times by up to ~30%.
- Freight volatility: Baltic Dry Index ~1,400 (2024)
- Licensing delays: defense/dual‑use add 6–12 months
- Working capital impact: +10–20% from buffers
- Mitigation: nearshoring/IM programs reduce lead times ~30%
Scale offsets and integrator role
ST Engineering’s scale and integrator status give counter‑leverage in 2024, enabling volume commitments and long‑horizon programs that secure more favorable supplier terms. Robust in‑house engineering and systems integration let ST redesign around constrained parts and source alternatives. Despite this, suppliers of monopoly subsystems retain high pricing power and strategic leverage.
- Scale: enables leverage via long‑term contracts
- Engineering: in‑house redesign reduces dependency
- Programs: multi‑year orders improve terms
- Risk: monopoly subsystem suppliers keep strong power
Supplier power, semiconductor shortages and licensing delays push working capital up 10–20%
In 2024 ST Engineering faces elevated supplier power from certified aerospace OEMs, niche semiconductor (~US$600B), cybersecurity (~US$170B) and robotics (~US$55B) vendors and regulatory/ITAR constraints. Freight volatility (BDI ~1,400) and licensing delays (6–12 months) amplify shortages; buffers raise working capital ~10–20%. Scale, long‑term contracts and in‑house engineering mitigate but monopoly subsystems keep pricing leverage.
| Metric | 2024 Value | Impact |
|---|---|---|
| Semiconductor market | US$600B | High supplier pricing |
| BDI | ~1,400 | Logistics volatility |
| Licensing delays | 6–12 months | Lead‑time risk |
| Working capital | +10–20% | Buffer cost |
What is included in the product
 Detailed Word Document
Tailored Porter's Five Forces analysis for ST Engineering that examines competitive rivalry, buyer and supplier power, threat of new entrants and substitutes, and identifies disruptive technologies and regulatory risks shaping profitability and strategic positioning.

 Customizable Excel Spreadsheet
A clear, one-sheet summary of ST Engineering's five forces—perfect for quick decision-making and boardroom use, with customizable pressure levels to reflect industry shifts and regulatory changes.
Customers Bargaining Power

Government anchor customers
Defense ministries and public agencies buy via competitive tenders with strict KPIs, giving them strong bargaining power on price, offsets and local content; the US 2024 defense budget was about $858bn while global military spending was $2.24tr in 2023 (SIPRI), concentrating buyer power. Multi-year budgets reduce vendor churn but intensify negotiations; performance and compliance, not lowest price, often determine renewals.
Airlines and MRO clients
Airlines are highly cost sensitive and benchmark MRO offers globally; the commercial MRO market (~USD 110bn in 2024) intensifies price competition. Long-term PBH and component contracts, which cover a large share of component spend, moderate cash-flow volatility but are competitively rebid. Turnaround time and reliability remain primary switching drivers, while consolidated airline groups (top 10 account for roughly 45% of capacity) amplify negotiating leverage.

Smart city and enterprise buyers
Cities and enterprise buyers, overseeing over 1,000 smart city initiatives globally as of 2024, run RFPs that standardize specs and drive commodity pricing, squeezing vendor margins. Deep integration and bespoke deployments create meaningful switching costs once systems are live, while outcome-based contracts transfer performance and uptime risk to the vendor. Increasing interoperability mandates, however, erode product differentiation and compress long-term pricing power.

High switching costs in systems
- High switching costs: retraining, re‑certification, downtime
- Customer stickiness reduces exit despite upfront leverage
- Retention reliant on strong SLAs and lifecycle support
- Context: $2.24T global military spend in 2023 (SIPRI)
Global referenceability and bundling
Cross-portfolio bundling across aerospace, defense and smart mobility lets ST Engineering offer integrated solutions that drive multi-year, multi-product contracts with deeper discounts in exchange for revenue visibility; SIPRI reported global military expenditure at US$2.24 trillion in 2023, supporting larger deal sizes and referenceability.
- Bundles increase deal size and lock-in
- Buyers accept discounts for multi-year certainty
- Reference wins cut perceived implementation risk
- Governance rules can force unbundling to best-of-breed
Defense demand concentrated: $858bn, global $2.24tr
Defense/public buyers use strict tenders and KPIs, driving strong price and local‑content leverage; US 2024 defence budget ~$858bn and global military spend $2.24tr (2023) concentrate demand. Airlines (commercial MRO ~USD110bn in 2024) push aggressive price benchmarking; long PBH contracts lower churn but are rebid. Bundling across portfolios increases lock‑in, mitigating buyer power.
| Buyer | Key metric | Impact |
|---|---|---|
| Defense | US $858bn (2024) | High leverage |
| Global military | $2.24tr (2023) | Concentrated demand |
| Airlines | MRO ~$110bn (2024) | Price pressure |
Full Version Awaits
ST Engineering Porter's Five Forces Analysis
This preview displays the exact ST Engineering Porter’s Five Forces analysis you will receive upon purchase—fully written, formatted, and ready to download. There are no placeholders or samples; the file shown is the final deliverable. Buy now for instant access to this complete, professional report.

Don't Miss the Bigger Picture
ST Engineering faces moderate supplier power, intense buyer scrutiny, high barriers to entry but strong competitive rivalry across aerospace, defence and smart-city units; substitutes and regulatory shifts pose targeted risks. This snapshot highlights key tensions and strategic levers. Unlock the full Porter's Five Forces Analysis to explore force-by-force ratings, visuals and actionable implications tailored to ST Engineering.
Suppliers Bargaining Power
Concentrated critical components
As of 2024 ST Engineering depends on a small set of aerospace OEMs and Tier‑1s for engines, avionics and proprietary spares. These suppliers exert pricing and delivery power due to certification lock‑in and long qualification cycles. Limited qualified alternatives heighten exposure to shortages and service disruptions. Dual‑sourcing is possible in some categories but remains infeasible for many safety‑critical parts.
Specialized tech inputs
Specialized inputs—semiconductors (global market ~US$600B in 2024), cybersecurity tools (~US$170B) and robotics modules (~US$55B)—come from niche vendors, letting rapid tech cycles and strong IP tilt pricing and roadmap control to suppliers. Component obsolescence raises lifecycle costs and replacement risk, while strategic partnerships and early design engagement reduce supplier leverage.
Regulatory and certification barriers
As of 2024 FAA and EASA certification regimes plus ITAR/EAR export controls create high barriers to supplier substitution, since approved parts lists and supplier qualifications limit eligible vendors. Supplier pools are therefore concentrated, switching requires costly requalification and months of testing, reinforcing supplier leverage. ST Engineering and peers commonly use long‑term framework agreements to exchange price concessions for assured compliance and supply continuity.
Logistics and geopolitical exposure
Logistics and geopolitical exposure raise supplier power for ST Engineering as global supply chains face freight volatility (Baltic Dry Index averaged ~1,400 in 2024) and sanctions risk; defense and dual‑use goods incur licensing delays suppliers pass on, often adding 6–12 months to lead times and premium costs. Regionalization and inventory buffers blunt shocks but can lift working capital by ~10–20%; nearshoring and vendor‑managed inventory programs can cut disruption risk and trim lead times by up to ~30%.
- Freight volatility: Baltic Dry Index ~1,400 (2024)
- Licensing delays: defense/dual‑use add 6–12 months
- Working capital impact: +10–20% from buffers
- Mitigation: nearshoring/IM programs reduce lead times ~30%
Scale offsets and integrator role
ST Engineering’s scale and integrator status give counter‑leverage in 2024, enabling volume commitments and long‑horizon programs that secure more favorable supplier terms. Robust in‑house engineering and systems integration let ST redesign around constrained parts and source alternatives. Despite this, suppliers of monopoly subsystems retain high pricing power and strategic leverage.
- Scale: enables leverage via long‑term contracts
- Engineering: in‑house redesign reduces dependency
- Programs: multi‑year orders improve terms
- Risk: monopoly subsystem suppliers keep strong power
Supplier power, semiconductor shortages and licensing delays push working capital up 10–20%
In 2024 ST Engineering faces elevated supplier power from certified aerospace OEMs, niche semiconductor (~US$600B), cybersecurity (~US$170B) and robotics (~US$55B) vendors and regulatory/ITAR constraints. Freight volatility (BDI ~1,400) and licensing delays (6–12 months) amplify shortages; buffers raise working capital ~10–20%. Scale, long‑term contracts and in‑house engineering mitigate but monopoly subsystems keep pricing leverage.
| Metric | 2024 Value | Impact |
|---|---|---|
| Semiconductor market | US$600B | High supplier pricing |
| BDI | ~1,400 | Logistics volatility |
| Licensing delays | 6–12 months | Lead‑time risk |
| Working capital | +10–20% | Buffer cost |
What is included in the product
Detailed Word Document
Tailored Porter's Five Forces analysis for ST Engineering that examines competitive rivalry, buyer and supplier power, threat of new entrants and substitutes, and identifies disruptive technologies and regulatory risks shaping profitability and strategic positioning.
Customizable Excel Spreadsheet
A clear, one-sheet summary of ST Engineering's five forces—perfect for quick decision-making and boardroom use, with customizable pressure levels to reflect industry shifts and regulatory changes.
Customers Bargaining Power
Government anchor customers
Defense ministries and public agencies buy via competitive tenders with strict KPIs, giving them strong bargaining power on price, offsets and local content; the US 2024 defense budget was about $858bn while global military spending was $2.24tr in 2023 (SIPRI), concentrating buyer power. Multi-year budgets reduce vendor churn but intensify negotiations; performance and compliance, not lowest price, often determine renewals.
Airlines and MRO clients
Airlines are highly cost sensitive and benchmark MRO offers globally; the commercial MRO market (~USD 110bn in 2024) intensifies price competition. Long-term PBH and component contracts, which cover a large share of component spend, moderate cash-flow volatility but are competitively rebid. Turnaround time and reliability remain primary switching drivers, while consolidated airline groups (top 10 account for roughly 45% of capacity) amplify negotiating leverage.
Smart city and enterprise buyers
Cities and enterprise buyers, overseeing over 1,000 smart city initiatives globally as of 2024, run RFPs that standardize specs and drive commodity pricing, squeezing vendor margins. Deep integration and bespoke deployments create meaningful switching costs once systems are live, while outcome-based contracts transfer performance and uptime risk to the vendor. Increasing interoperability mandates, however, erode product differentiation and compress long-term pricing power.
High switching costs in systems
- High switching costs: retraining, re‑certification, downtime
- Customer stickiness reduces exit despite upfront leverage
- Retention reliant on strong SLAs and lifecycle support
- Context: $2.24T global military spend in 2023 (SIPRI)
Global referenceability and bundling
Cross-portfolio bundling across aerospace, defense and smart mobility lets ST Engineering offer integrated solutions that drive multi-year, multi-product contracts with deeper discounts in exchange for revenue visibility; SIPRI reported global military expenditure at US$2.24 trillion in 2023, supporting larger deal sizes and referenceability.
- Bundles increase deal size and lock-in
- Buyers accept discounts for multi-year certainty
- Reference wins cut perceived implementation risk
- Governance rules can force unbundling to best-of-breed
Defense demand concentrated: $858bn, global $2.24tr
Defense/public buyers use strict tenders and KPIs, driving strong price and local‑content leverage; US 2024 defence budget ~$858bn and global military spend $2.24tr (2023) concentrate demand. Airlines (commercial MRO ~USD110bn in 2024) push aggressive price benchmarking; long PBH contracts lower churn but are rebid. Bundling across portfolios increases lock‑in, mitigating buyer power.
| Buyer | Key metric | Impact |
|---|---|---|
| Defense | US $858bn (2024) | High leverage |
| Global military | $2.24tr (2023) | Concentrated demand |
| Airlines | MRO ~$110bn (2024) | Price pressure |
Full Version Awaits
ST Engineering Porter's Five Forces Analysis
This preview displays the exact ST Engineering Porter’s Five Forces analysis you will receive upon purchase—fully written, formatted, and ready to download. There are no placeholders or samples; the file shown is the final deliverable. Buy now for instant access to this complete, professional report.
Original: $10.00
-65%$10.00
$3.50Description
Don't Miss the Bigger Picture
ST Engineering faces moderate supplier power, intense buyer scrutiny, high barriers to entry but strong competitive rivalry across aerospace, defence and smart-city units; substitutes and regulatory shifts pose targeted risks. This snapshot highlights key tensions and strategic levers. Unlock the full Porter's Five Forces Analysis to explore force-by-force ratings, visuals and actionable implications tailored to ST Engineering.
Suppliers Bargaining Power
Concentrated critical components
As of 2024 ST Engineering depends on a small set of aerospace OEMs and Tier‑1s for engines, avionics and proprietary spares. These suppliers exert pricing and delivery power due to certification lock‑in and long qualification cycles. Limited qualified alternatives heighten exposure to shortages and service disruptions. Dual‑sourcing is possible in some categories but remains infeasible for many safety‑critical parts.
Specialized tech inputs
Specialized inputs—semiconductors (global market ~US$600B in 2024), cybersecurity tools (~US$170B) and robotics modules (~US$55B)—come from niche vendors, letting rapid tech cycles and strong IP tilt pricing and roadmap control to suppliers. Component obsolescence raises lifecycle costs and replacement risk, while strategic partnerships and early design engagement reduce supplier leverage.
Regulatory and certification barriers
As of 2024 FAA and EASA certification regimes plus ITAR/EAR export controls create high barriers to supplier substitution, since approved parts lists and supplier qualifications limit eligible vendors. Supplier pools are therefore concentrated, switching requires costly requalification and months of testing, reinforcing supplier leverage. ST Engineering and peers commonly use long‑term framework agreements to exchange price concessions for assured compliance and supply continuity.
Logistics and geopolitical exposure
Logistics and geopolitical exposure raise supplier power for ST Engineering as global supply chains face freight volatility (Baltic Dry Index averaged ~1,400 in 2024) and sanctions risk; defense and dual‑use goods incur licensing delays suppliers pass on, often adding 6–12 months to lead times and premium costs. Regionalization and inventory buffers blunt shocks but can lift working capital by ~10–20%; nearshoring and vendor‑managed inventory programs can cut disruption risk and trim lead times by up to ~30%.
- Freight volatility: Baltic Dry Index ~1,400 (2024)
- Licensing delays: defense/dual‑use add 6–12 months
- Working capital impact: +10–20% from buffers
- Mitigation: nearshoring/IM programs reduce lead times ~30%
Scale offsets and integrator role
ST Engineering’s scale and integrator status give counter‑leverage in 2024, enabling volume commitments and long‑horizon programs that secure more favorable supplier terms. Robust in‑house engineering and systems integration let ST redesign around constrained parts and source alternatives. Despite this, suppliers of monopoly subsystems retain high pricing power and strategic leverage.
- Scale: enables leverage via long‑term contracts
- Engineering: in‑house redesign reduces dependency
- Programs: multi‑year orders improve terms
- Risk: monopoly subsystem suppliers keep strong power
Supplier power, semiconductor shortages and licensing delays push working capital up 10–20%
In 2024 ST Engineering faces elevated supplier power from certified aerospace OEMs, niche semiconductor (~US$600B), cybersecurity (~US$170B) and robotics (~US$55B) vendors and regulatory/ITAR constraints. Freight volatility (BDI ~1,400) and licensing delays (6–12 months) amplify shortages; buffers raise working capital ~10–20%. Scale, long‑term contracts and in‑house engineering mitigate but monopoly subsystems keep pricing leverage.
| Metric | 2024 Value | Impact |
|---|---|---|
| Semiconductor market | US$600B | High supplier pricing |
| BDI | ~1,400 | Logistics volatility |
| Licensing delays | 6–12 months | Lead‑time risk |
| Working capital | +10–20% | Buffer cost |
What is included in the product
Detailed Word Document
Tailored Porter's Five Forces analysis for ST Engineering that examines competitive rivalry, buyer and supplier power, threat of new entrants and substitutes, and identifies disruptive technologies and regulatory risks shaping profitability and strategic positioning.
Customizable Excel Spreadsheet
A clear, one-sheet summary of ST Engineering's five forces—perfect for quick decision-making and boardroom use, with customizable pressure levels to reflect industry shifts and regulatory changes.
Customers Bargaining Power
Government anchor customers
Defense ministries and public agencies buy via competitive tenders with strict KPIs, giving them strong bargaining power on price, offsets and local content; the US 2024 defense budget was about $858bn while global military spending was $2.24tr in 2023 (SIPRI), concentrating buyer power. Multi-year budgets reduce vendor churn but intensify negotiations; performance and compliance, not lowest price, often determine renewals.
Airlines and MRO clients
Airlines are highly cost sensitive and benchmark MRO offers globally; the commercial MRO market (~USD 110bn in 2024) intensifies price competition. Long-term PBH and component contracts, which cover a large share of component spend, moderate cash-flow volatility but are competitively rebid. Turnaround time and reliability remain primary switching drivers, while consolidated airline groups (top 10 account for roughly 45% of capacity) amplify negotiating leverage.
Smart city and enterprise buyers
Cities and enterprise buyers, overseeing over 1,000 smart city initiatives globally as of 2024, run RFPs that standardize specs and drive commodity pricing, squeezing vendor margins. Deep integration and bespoke deployments create meaningful switching costs once systems are live, while outcome-based contracts transfer performance and uptime risk to the vendor. Increasing interoperability mandates, however, erode product differentiation and compress long-term pricing power.
High switching costs in systems
- High switching costs: retraining, re‑certification, downtime
- Customer stickiness reduces exit despite upfront leverage
- Retention reliant on strong SLAs and lifecycle support
- Context: $2.24T global military spend in 2023 (SIPRI)
Global referenceability and bundling
Cross-portfolio bundling across aerospace, defense and smart mobility lets ST Engineering offer integrated solutions that drive multi-year, multi-product contracts with deeper discounts in exchange for revenue visibility; SIPRI reported global military expenditure at US$2.24 trillion in 2023, supporting larger deal sizes and referenceability.
- Bundles increase deal size and lock-in
- Buyers accept discounts for multi-year certainty
- Reference wins cut perceived implementation risk
- Governance rules can force unbundling to best-of-breed
Defense demand concentrated: $858bn, global $2.24tr
Defense/public buyers use strict tenders and KPIs, driving strong price and local‑content leverage; US 2024 defence budget ~$858bn and global military spend $2.24tr (2023) concentrate demand. Airlines (commercial MRO ~USD110bn in 2024) push aggressive price benchmarking; long PBH contracts lower churn but are rebid. Bundling across portfolios increases lock‑in, mitigating buyer power.
| Buyer | Key metric | Impact |
|---|---|---|
| Defense | US $858bn (2024) | High leverage |
| Global military | $2.24tr (2023) | Concentrated demand |
| Airlines | MRO ~$110bn (2024) | Price pressure |
Full Version Awaits
ST Engineering Porter's Five Forces Analysis
This preview displays the exact ST Engineering Porter’s Five Forces analysis you will receive upon purchase—fully written, formatted, and ready to download. There are no placeholders or samples; the file shown is the final deliverable. Buy now for instant access to this complete, professional report.











