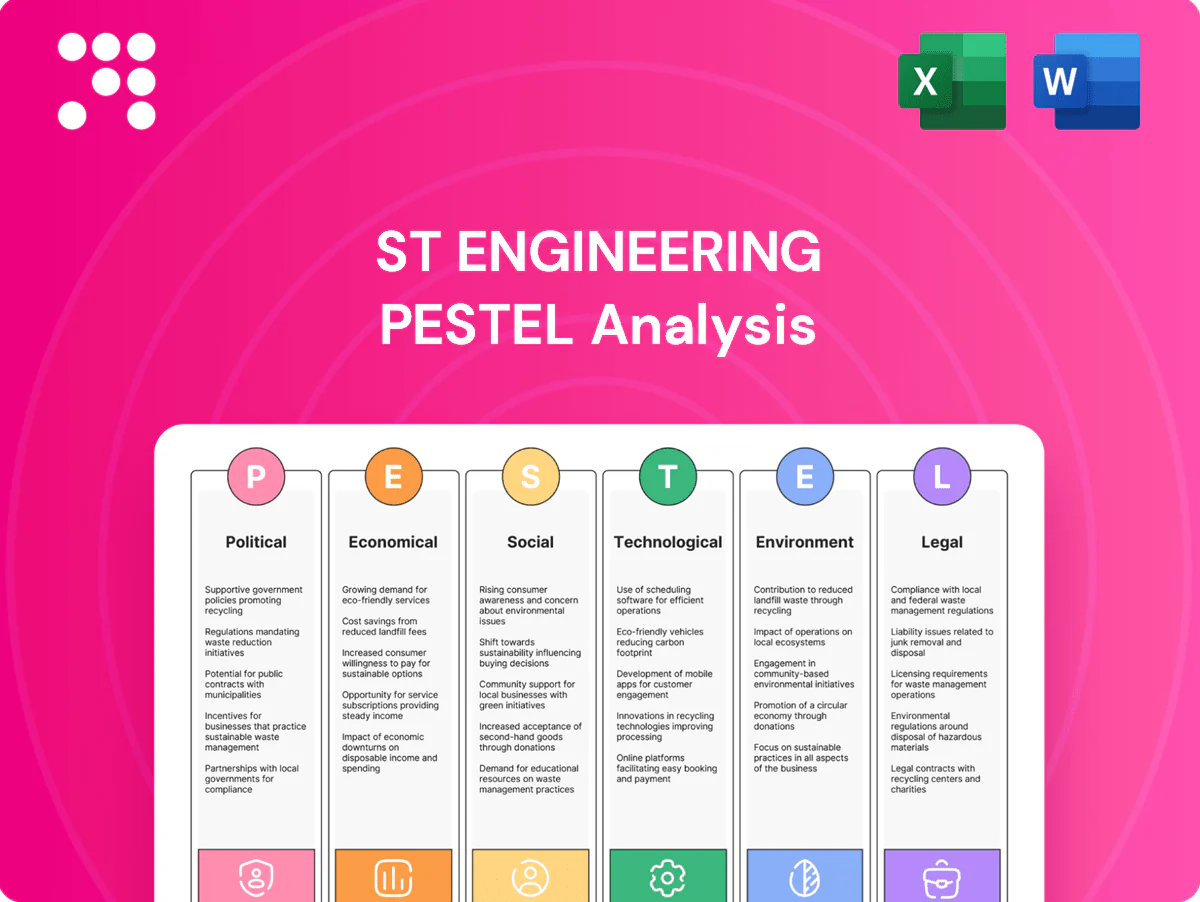
ST Engineering PESTLE Analysis

Make Smarter Strategic Decisions with a Complete PESTEL View
Discover how geopolitical shifts, economic cycles, and accelerating tech trends are reshaping ST Engineering's strategic landscape in our concise PESTLE overview. This snapshot highlights key risks and opportunities—perfect for investors and strategists. Buy the full PESTLE analysis to access the complete, actionable intelligence and ready-to-use supporting files.
Political factors

Defence procurement cycles
Government budget priorities and multi-year procurement plans—with global military spending at about $2.24 trillion in 2023 (SIPRI) and the US FY2024 defence budget near $858 billion—directly drive order visibility and backlog for defence platforms and services.
Shifts in administrations can reallocate spending between aerospace, land systems and public security, altering ST Engineering’s segment mix and contract pipelines.
Long sales cycles require sustained stakeholder engagement and offset/industrial participation commitments; delays or cancellations can depress capacity utilization and slow R&D amortization.
Geopolitical tensions and export controls
Regional flashpoints and great-power competition lift demand for defence and cyber solutions as global military expenditure reached $2,443 billion in 2023 (SIPRI), while tightened US export controls on advanced semiconductors in 2023 and expanding sanctions regimes restrict markets and technologies. Compliance costs and licensing delays rise, forcing ST Engineering to vet partners and design supply networks to mitigate end-use and re-export risks.

Home-market policy support
As a Singapore-linked group, ST Engineering benefits from national defence priorities and Smart Nation initiatives that underpin baseline demand; Singapore's defence outlay was about S$20 billion in 2024, sustaining procurement pipelines. Public-private partnerships have enabled urban solutions and digital infrastructure pilots, accelerating commercialisation. Policy stability reduces cash-flow volatility and supports capital investment, while strong domestic references help unlock overseas tenders.

Offsets and localization mandates
Many defence and aerospace customers require technology transfer, local content and co-production, with localization mandates commonly set at 10–30% of contract value in several markets; these conditions affect pricing, margin structure and IP protection strategies and increase programme costs and lead times.
- Local content: 10–30%
- Impact: higher CAPEX and lower gross margins
- Mitigation: JVs, clusters improve win rates and reduce political risk
International standards and alliances
Alignment with NATO STANAGs (NATO 32 members) and ICAO (193 contracting states) expands ST Engineering’s addressable markets and interoperability in civil and defense programs; regional trade pacts like CPTPP (11 members) and ASEAN (10) ease market entry and skilled labor movement. Diplomatic ties shape access to joint programs and funding amid global military spending of about 2.24 trillion USD (SIPRI 2023); non-alignment can both open niche markets and restrict some alliances.
- Market reach: NATO 32, ICAO 193
- Trade blocs: CPTPP 11, ASEAN 10
- Funding context: $2.24T global military spend (2023)
- Risk: non-alignment creates selective access
Government procurement, export controls and localisation shape defence order visibility
Government procurement and multi-year defence budgets (global military spend ~$2.24T in 2023; US FY2024 ~$858B) drive ST Engineering’s order visibility and backlog.
Export controls, sanctions and localisation mandates (commonly 10–30%) raise compliance costs, CAPEX and programme lead times.
Singapore’s defence outlay (~S$20B in 2024) and alignment with NATO/ICAO/CPTPP/ASEAN expand credibility and market access.
| Metric | Value |
|---|---|
| Global military spend (2023) | $2.24T |
| US defence FY2024 | $858B |
| Singapore defence (2024) | S$20B |
| Local content mandates | 10–30% |
What is included in the product
 Detailed Word Document
Explores how Political, Economic, Social, Technological, Environmental and Legal forces uniquely affect ST Engineering, combining data-driven trends and region-specific regulatory context to identify risks, opportunities and strategic scenarios for executives, investors and planners.

 Customizable Excel Spreadsheet
Visually segmented by PESTLE categories for ST Engineering, this concise analysis enables quick interpretation of regulatory, technological and geopolitical risks at a glance to speed decision-making in meetings and presentations.
Economic factors

Global GDP and air travel cycles
Commercial MRO demand closely tracks passenger traffic and fleet utilization; global air passengers numbered about 4.5 billion in 2019 (IATA), so downturns compress flight hours and defer heavy checks while recoveries spike engine and component shop visits. Cargo strength drives freighter conversions and incremental MRO work. ST Engineering’s diversification into defence and smart-city solutions provides multi-year contract buffers against MRO cyclicality.
FX, inflation, and cost pressures
ST Engineering’s multi-currency revenues versus USD-linked inputs leave margins sensitive to FX; group revenue was about S$6.5bn in FY2024, amplifying exchange impacts as USD strengthened ~6% vs SGD in 2024.
Wage inflation and skilled-labor shortages pushed delivery costs higher, with Singapore wage growth around 4–5% in 2024 and sector hiring tightness raising subcontract rates.
Long-term contracts with escalation clauses and active hedging are critical to manage volatility, while supplier repricing and component cost inflation have compressed program-level margins in 2024–25.

Capital intensity and interest rates
ST Engineering faces substantial capex for R&D, hangar expansion and digital-platform builds, increasing near-term funding needs. With global policy rates elevated (US Fed funds 5.25–5.50% in 2025, 10‑yr UST ~4.5%), WACC and hurdle rates for new programmes and M&A materially rise. Customers increasingly prefer service-based, pay-per-use models to conserve cash, shifting revenue to recurring streams. Asset-light partnerships and JV structures help optimise balance-sheet use and lower upfront capex.

Public spending and stimulus
Public spending fuels ST Engineering demand as infrastructure and smart‑city programs expand—US Bipartisan Infrastructure Law ($1.2 trillion) and APAC urban projects lift mobility, connectivity and public‑safety contracts; defence modernization stays relatively protected (global defence spending was $2.24 trillion in 2023, SIPRI) but faces sequestration risks; MDBs and climate finance (MDB urban/infra allocations top $100 billion annually) catalyze emerging‑market opportunities; procurement pace tracks fiscal cycles.
- Infrastructure bills: $1.2T US
- Global defence: $2.24T (2023 SIPRI)
- MDB/urban finance: ~$100B+/yr
- Procurement speed varies with fiscal health
Supply chain resilience
Supply chain resilience for ST Engineering is strained by semiconductor shortages, aerospace parts scarcity and logistics bottlenecks that extend delivery timelines; the global semiconductor market reached roughly $600 billion in 2024 (WSTS estimate), keeping lead times elevated. Dual-sourcing and inventory strategies are now strategic differentiators; nearshoring and vendor financing help stabilize critical components. Customers in constrained markets prioritize reliable lead times over lowest price.
- Chip market ~ $600B (2024)
- Dual-sourcing, safety stock = competitive edge
- Nearshoring + vendor finance reduce disruption risk
- Customers value lead time reliability > price
Government procurement, export controls and localisation shape defence order visibility
ST Engineering’s MRO cycles mirror air travel recovery; group revenue ~S$6.5bn (FY2024) while passenger volumes (pre‑COVID 4.5bn) drive shop visits. FX, with USD ~6% stronger vs SGD in 2024, and wage inflation (~4–5% in Singapore 2024) pressured margins. Higher rates (Fed 5.25–5.50% 2025; 10‑yr ~4.5%) raise WACC and capex costs; chip market ~ $600B (2024) keeps supply risk elevated.
| Metric | Value |
|---|---|
| Revenue | S$6.5bn (FY2024) |
| USD vs SGD | USD +~6% (2024) |
| Wage growth SG | 4–5% (2024) |
| Fed funds | 5.25–5.50% (2025) |
| Chip market | ~$600B (2024) |
Preview the Actual Deliverable
ST Engineering PESTLE Analysis
The preview shown here is the exact ST Engineering PESTLE Analysis you’ll receive after purchase—fully formatted, professionally structured, and ready to use. This screenshot reflects the final document with no placeholders or edits required. After payment you’ll instantly download the same file as displayed.

Make Smarter Strategic Decisions with a Complete PESTEL View
Discover how geopolitical shifts, economic cycles, and accelerating tech trends are reshaping ST Engineering's strategic landscape in our concise PESTLE overview. This snapshot highlights key risks and opportunities—perfect for investors and strategists. Buy the full PESTLE analysis to access the complete, actionable intelligence and ready-to-use supporting files.
Political factors
Defence procurement cycles
Government budget priorities and multi-year procurement plans—with global military spending at about $2.24 trillion in 2023 (SIPRI) and the US FY2024 defence budget near $858 billion—directly drive order visibility and backlog for defence platforms and services.
Shifts in administrations can reallocate spending between aerospace, land systems and public security, altering ST Engineering’s segment mix and contract pipelines.
Long sales cycles require sustained stakeholder engagement and offset/industrial participation commitments; delays or cancellations can depress capacity utilization and slow R&D amortization.
Geopolitical tensions and export controls
Regional flashpoints and great-power competition lift demand for defence and cyber solutions as global military expenditure reached $2,443 billion in 2023 (SIPRI), while tightened US export controls on advanced semiconductors in 2023 and expanding sanctions regimes restrict markets and technologies. Compliance costs and licensing delays rise, forcing ST Engineering to vet partners and design supply networks to mitigate end-use and re-export risks.
Home-market policy support
As a Singapore-linked group, ST Engineering benefits from national defence priorities and Smart Nation initiatives that underpin baseline demand; Singapore's defence outlay was about S$20 billion in 2024, sustaining procurement pipelines. Public-private partnerships have enabled urban solutions and digital infrastructure pilots, accelerating commercialisation. Policy stability reduces cash-flow volatility and supports capital investment, while strong domestic references help unlock overseas tenders.
Offsets and localization mandates
Many defence and aerospace customers require technology transfer, local content and co-production, with localization mandates commonly set at 10–30% of contract value in several markets; these conditions affect pricing, margin structure and IP protection strategies and increase programme costs and lead times.
- Local content: 10–30%
- Impact: higher CAPEX and lower gross margins
- Mitigation: JVs, clusters improve win rates and reduce political risk
International standards and alliances
Alignment with NATO STANAGs (NATO 32 members) and ICAO (193 contracting states) expands ST Engineering’s addressable markets and interoperability in civil and defense programs; regional trade pacts like CPTPP (11 members) and ASEAN (10) ease market entry and skilled labor movement. Diplomatic ties shape access to joint programs and funding amid global military spending of about 2.24 trillion USD (SIPRI 2023); non-alignment can both open niche markets and restrict some alliances.
- Market reach: NATO 32, ICAO 193
- Trade blocs: CPTPP 11, ASEAN 10
- Funding context: $2.24T global military spend (2023)
- Risk: non-alignment creates selective access
Government procurement, export controls and localisation shape defence order visibility
Government procurement and multi-year defence budgets (global military spend ~$2.24T in 2023; US FY2024 ~$858B) drive ST Engineering’s order visibility and backlog.
Export controls, sanctions and localisation mandates (commonly 10–30%) raise compliance costs, CAPEX and programme lead times.
Singapore’s defence outlay (~S$20B in 2024) and alignment with NATO/ICAO/CPTPP/ASEAN expand credibility and market access.
| Metric | Value |
|---|---|
| Global military spend (2023) | $2.24T |
| US defence FY2024 | $858B |
| Singapore defence (2024) | S$20B |
| Local content mandates | 10–30% |
What is included in the product
Detailed Word Document
Explores how Political, Economic, Social, Technological, Environmental and Legal forces uniquely affect ST Engineering, combining data-driven trends and region-specific regulatory context to identify risks, opportunities and strategic scenarios for executives, investors and planners.
Customizable Excel Spreadsheet
Visually segmented by PESTLE categories for ST Engineering, this concise analysis enables quick interpretation of regulatory, technological and geopolitical risks at a glance to speed decision-making in meetings and presentations.
Economic factors
Global GDP and air travel cycles
Commercial MRO demand closely tracks passenger traffic and fleet utilization; global air passengers numbered about 4.5 billion in 2019 (IATA), so downturns compress flight hours and defer heavy checks while recoveries spike engine and component shop visits. Cargo strength drives freighter conversions and incremental MRO work. ST Engineering’s diversification into defence and smart-city solutions provides multi-year contract buffers against MRO cyclicality.
FX, inflation, and cost pressures
ST Engineering’s multi-currency revenues versus USD-linked inputs leave margins sensitive to FX; group revenue was about S$6.5bn in FY2024, amplifying exchange impacts as USD strengthened ~6% vs SGD in 2024.
Wage inflation and skilled-labor shortages pushed delivery costs higher, with Singapore wage growth around 4–5% in 2024 and sector hiring tightness raising subcontract rates.
Long-term contracts with escalation clauses and active hedging are critical to manage volatility, while supplier repricing and component cost inflation have compressed program-level margins in 2024–25.
Capital intensity and interest rates
ST Engineering faces substantial capex for R&D, hangar expansion and digital-platform builds, increasing near-term funding needs. With global policy rates elevated (US Fed funds 5.25–5.50% in 2025, 10‑yr UST ~4.5%), WACC and hurdle rates for new programmes and M&A materially rise. Customers increasingly prefer service-based, pay-per-use models to conserve cash, shifting revenue to recurring streams. Asset-light partnerships and JV structures help optimise balance-sheet use and lower upfront capex.
Public spending and stimulus
Public spending fuels ST Engineering demand as infrastructure and smart‑city programs expand—US Bipartisan Infrastructure Law ($1.2 trillion) and APAC urban projects lift mobility, connectivity and public‑safety contracts; defence modernization stays relatively protected (global defence spending was $2.24 trillion in 2023, SIPRI) but faces sequestration risks; MDBs and climate finance (MDB urban/infra allocations top $100 billion annually) catalyze emerging‑market opportunities; procurement pace tracks fiscal cycles.
- Infrastructure bills: $1.2T US
- Global defence: $2.24T (2023 SIPRI)
- MDB/urban finance: ~$100B+/yr
- Procurement speed varies with fiscal health
Supply chain resilience
Supply chain resilience for ST Engineering is strained by semiconductor shortages, aerospace parts scarcity and logistics bottlenecks that extend delivery timelines; the global semiconductor market reached roughly $600 billion in 2024 (WSTS estimate), keeping lead times elevated. Dual-sourcing and inventory strategies are now strategic differentiators; nearshoring and vendor financing help stabilize critical components. Customers in constrained markets prioritize reliable lead times over lowest price.
- Chip market ~ $600B (2024)
- Dual-sourcing, safety stock = competitive edge
- Nearshoring + vendor finance reduce disruption risk
- Customers value lead time reliability > price
Government procurement, export controls and localisation shape defence order visibility
ST Engineering’s MRO cycles mirror air travel recovery; group revenue ~S$6.5bn (FY2024) while passenger volumes (pre‑COVID 4.5bn) drive shop visits. FX, with USD ~6% stronger vs SGD in 2024, and wage inflation (~4–5% in Singapore 2024) pressured margins. Higher rates (Fed 5.25–5.50% 2025; 10‑yr ~4.5%) raise WACC and capex costs; chip market ~ $600B (2024) keeps supply risk elevated.
| Metric | Value |
|---|---|
| Revenue | S$6.5bn (FY2024) |
| USD vs SGD | USD +~6% (2024) |
| Wage growth SG | 4–5% (2024) |
| Fed funds | 5.25–5.50% (2025) |
| Chip market | ~$600B (2024) |
Preview the Actual Deliverable
ST Engineering PESTLE Analysis
The preview shown here is the exact ST Engineering PESTLE Analysis you’ll receive after purchase—fully formatted, professionally structured, and ready to use. This screenshot reflects the final document with no placeholders or edits required. After payment you’ll instantly download the same file as displayed.
Original: $10.00
-65%$10.00
$3.50Description
Make Smarter Strategic Decisions with a Complete PESTEL View
Discover how geopolitical shifts, economic cycles, and accelerating tech trends are reshaping ST Engineering's strategic landscape in our concise PESTLE overview. This snapshot highlights key risks and opportunities—perfect for investors and strategists. Buy the full PESTLE analysis to access the complete, actionable intelligence and ready-to-use supporting files.
Political factors
Defence procurement cycles
Government budget priorities and multi-year procurement plans—with global military spending at about $2.24 trillion in 2023 (SIPRI) and the US FY2024 defence budget near $858 billion—directly drive order visibility and backlog for defence platforms and services.
Shifts in administrations can reallocate spending between aerospace, land systems and public security, altering ST Engineering’s segment mix and contract pipelines.
Long sales cycles require sustained stakeholder engagement and offset/industrial participation commitments; delays or cancellations can depress capacity utilization and slow R&D amortization.
Geopolitical tensions and export controls
Regional flashpoints and great-power competition lift demand for defence and cyber solutions as global military expenditure reached $2,443 billion in 2023 (SIPRI), while tightened US export controls on advanced semiconductors in 2023 and expanding sanctions regimes restrict markets and technologies. Compliance costs and licensing delays rise, forcing ST Engineering to vet partners and design supply networks to mitigate end-use and re-export risks.
Home-market policy support
As a Singapore-linked group, ST Engineering benefits from national defence priorities and Smart Nation initiatives that underpin baseline demand; Singapore's defence outlay was about S$20 billion in 2024, sustaining procurement pipelines. Public-private partnerships have enabled urban solutions and digital infrastructure pilots, accelerating commercialisation. Policy stability reduces cash-flow volatility and supports capital investment, while strong domestic references help unlock overseas tenders.
Offsets and localization mandates
Many defence and aerospace customers require technology transfer, local content and co-production, with localization mandates commonly set at 10–30% of contract value in several markets; these conditions affect pricing, margin structure and IP protection strategies and increase programme costs and lead times.
- Local content: 10–30%
- Impact: higher CAPEX and lower gross margins
- Mitigation: JVs, clusters improve win rates and reduce political risk
International standards and alliances
Alignment with NATO STANAGs (NATO 32 members) and ICAO (193 contracting states) expands ST Engineering’s addressable markets and interoperability in civil and defense programs; regional trade pacts like CPTPP (11 members) and ASEAN (10) ease market entry and skilled labor movement. Diplomatic ties shape access to joint programs and funding amid global military spending of about 2.24 trillion USD (SIPRI 2023); non-alignment can both open niche markets and restrict some alliances.
- Market reach: NATO 32, ICAO 193
- Trade blocs: CPTPP 11, ASEAN 10
- Funding context: $2.24T global military spend (2023)
- Risk: non-alignment creates selective access
Government procurement, export controls and localisation shape defence order visibility
Government procurement and multi-year defence budgets (global military spend ~$2.24T in 2023; US FY2024 ~$858B) drive ST Engineering’s order visibility and backlog.
Export controls, sanctions and localisation mandates (commonly 10–30%) raise compliance costs, CAPEX and programme lead times.
Singapore’s defence outlay (~S$20B in 2024) and alignment with NATO/ICAO/CPTPP/ASEAN expand credibility and market access.
| Metric | Value |
|---|---|
| Global military spend (2023) | $2.24T |
| US defence FY2024 | $858B |
| Singapore defence (2024) | S$20B |
| Local content mandates | 10–30% |
What is included in the product
Detailed Word Document
Explores how Political, Economic, Social, Technological, Environmental and Legal forces uniquely affect ST Engineering, combining data-driven trends and region-specific regulatory context to identify risks, opportunities and strategic scenarios for executives, investors and planners.
Customizable Excel Spreadsheet
Visually segmented by PESTLE categories for ST Engineering, this concise analysis enables quick interpretation of regulatory, technological and geopolitical risks at a glance to speed decision-making in meetings and presentations.
Economic factors
Global GDP and air travel cycles
Commercial MRO demand closely tracks passenger traffic and fleet utilization; global air passengers numbered about 4.5 billion in 2019 (IATA), so downturns compress flight hours and defer heavy checks while recoveries spike engine and component shop visits. Cargo strength drives freighter conversions and incremental MRO work. ST Engineering’s diversification into defence and smart-city solutions provides multi-year contract buffers against MRO cyclicality.
FX, inflation, and cost pressures
ST Engineering’s multi-currency revenues versus USD-linked inputs leave margins sensitive to FX; group revenue was about S$6.5bn in FY2024, amplifying exchange impacts as USD strengthened ~6% vs SGD in 2024.
Wage inflation and skilled-labor shortages pushed delivery costs higher, with Singapore wage growth around 4–5% in 2024 and sector hiring tightness raising subcontract rates.
Long-term contracts with escalation clauses and active hedging are critical to manage volatility, while supplier repricing and component cost inflation have compressed program-level margins in 2024–25.
Capital intensity and interest rates
ST Engineering faces substantial capex for R&D, hangar expansion and digital-platform builds, increasing near-term funding needs. With global policy rates elevated (US Fed funds 5.25–5.50% in 2025, 10‑yr UST ~4.5%), WACC and hurdle rates for new programmes and M&A materially rise. Customers increasingly prefer service-based, pay-per-use models to conserve cash, shifting revenue to recurring streams. Asset-light partnerships and JV structures help optimise balance-sheet use and lower upfront capex.
Public spending and stimulus
Public spending fuels ST Engineering demand as infrastructure and smart‑city programs expand—US Bipartisan Infrastructure Law ($1.2 trillion) and APAC urban projects lift mobility, connectivity and public‑safety contracts; defence modernization stays relatively protected (global defence spending was $2.24 trillion in 2023, SIPRI) but faces sequestration risks; MDBs and climate finance (MDB urban/infra allocations top $100 billion annually) catalyze emerging‑market opportunities; procurement pace tracks fiscal cycles.
- Infrastructure bills: $1.2T US
- Global defence: $2.24T (2023 SIPRI)
- MDB/urban finance: ~$100B+/yr
- Procurement speed varies with fiscal health
Supply chain resilience
Supply chain resilience for ST Engineering is strained by semiconductor shortages, aerospace parts scarcity and logistics bottlenecks that extend delivery timelines; the global semiconductor market reached roughly $600 billion in 2024 (WSTS estimate), keeping lead times elevated. Dual-sourcing and inventory strategies are now strategic differentiators; nearshoring and vendor financing help stabilize critical components. Customers in constrained markets prioritize reliable lead times over lowest price.
- Chip market ~ $600B (2024)
- Dual-sourcing, safety stock = competitive edge
- Nearshoring + vendor finance reduce disruption risk
- Customers value lead time reliability > price
Government procurement, export controls and localisation shape defence order visibility
ST Engineering’s MRO cycles mirror air travel recovery; group revenue ~S$6.5bn (FY2024) while passenger volumes (pre‑COVID 4.5bn) drive shop visits. FX, with USD ~6% stronger vs SGD in 2024, and wage inflation (~4–5% in Singapore 2024) pressured margins. Higher rates (Fed 5.25–5.50% 2025; 10‑yr ~4.5%) raise WACC and capex costs; chip market ~ $600B (2024) keeps supply risk elevated.
| Metric | Value |
|---|---|
| Revenue | S$6.5bn (FY2024) |
| USD vs SGD | USD +~6% (2024) |
| Wage growth SG | 4–5% (2024) |
| Fed funds | 5.25–5.50% (2025) |
| Chip market | ~$600B (2024) |
Preview the Actual Deliverable
ST Engineering PESTLE Analysis
The preview shown here is the exact ST Engineering PESTLE Analysis you’ll receive after purchase—fully formatted, professionally structured, and ready to use. This screenshot reflects the final document with no placeholders or edits required. After payment you’ll instantly download the same file as displayed.











