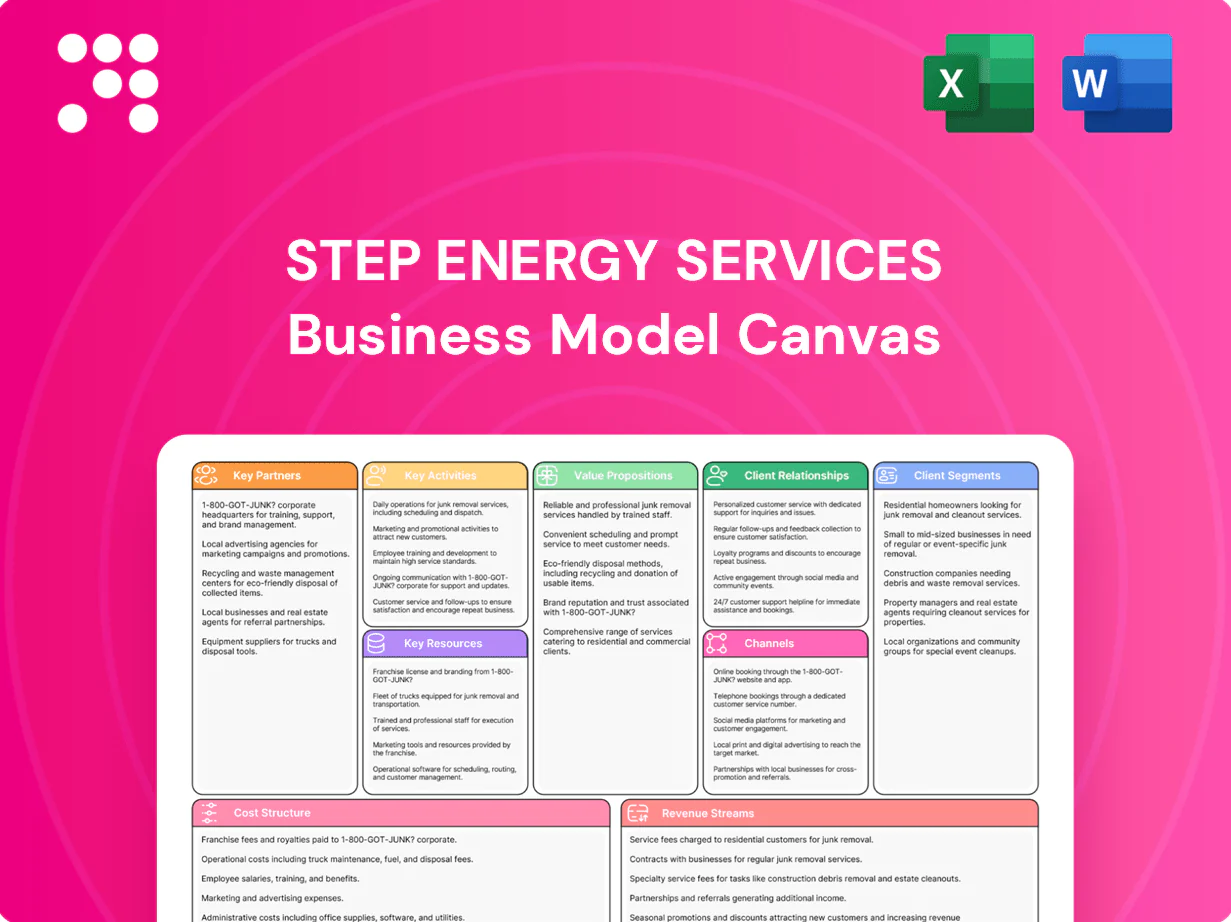
STEP Energy Services Business Model Canvas

Business Model Canvas: Actionable Strategy & Revenue Insights for Energy Service Investors
Unlock the full strategic blueprint behind STEP Energy Services with our Business Model Canvas—three‑to‑five pages of company‑specific insights that reveal value propositions, key partners, and revenue levers. Ideal for investors, consultants, and executives seeking actionable strategy. Download the editable Word and Excel files to benchmark, adapt, and accelerate your decisions.
Partnerships

Upstream E&P operators
Strategic relationships with upstream E&P operators secure steady project flow and early visibility to completion schedules, supporting STEP's planning and revenue predictability; 2024 North American oilfield service utilization averaged about 70%. Joint planning optimizes frac, coiled tubing, and wireline sequencing for faster cycle times and lower nonproductive time. Preferred vendor status raises asset utilization and pricing stability, while long-term MSAs cut bid friction and standardize service quality.
Equipment OEMs and technology providers
Equipment OEMs and technology providers supply high-horsepower pumps (typically 1,500–3,000 HP), CT strings (up to ~20,000 ft), wireline tools and digital control systems that enable STEP’s completions fleet. Co-development programs concentrate on improving reliability, higher pressure ratings and richer data capture for unconventional plays. Priority parts access shortens peak-season downtime, while joint technology roadmaps align field needs with next-gen completions capabilities.

Chemical, sand, and logistics suppliers
Aligned supply chains with chemical, sand, and fuel suppliers secure on-time delivery of proppant, chemistry, and fuel amid volatile demand, reducing completion delays. Rail, trucking, and last-mile partners cut non-productive time and demurrage through synchronized scheduling. Coordinated staging lowers pad congestion and total completion costs. Volume agreements hedge price swings and protect allocation during spikes.

Safety, training, and compliance partners
Third-party safety trainers and auditors reinforce STEP Energy Services HSE culture, ensuring certifications and site-specific programs meet client and regulatory requirements and enabling compliant crew mobilization often within 72 hours. Data-sharing with partners in 2024 improved leading indicators and helped prevent incidents through proactive interventions.
- Third-party audits
- Site-specific certifications
- 72-hour mobilization
- Leading-indicator data-sharing
Digital data and analytics integrators
Integration partners stream live frac data, CT telemetry and wireline logs into client platforms, enabling real-time decisioning and analytics that sharpen pump schedules, stage designs and post-job diagnostics; in 2024 adopters reported measurable reductions in cycle time and improved stage success rates. Cloud-based reporting increases transparency and post-well learnings while interoperability lowers friction across multi-vendor sites.
- 2024 adopters: faster diagnostics
- Real-time telemetry: continuous data feed
- Analytics: optimized pump/stage designs
- Cloud reporting: enhanced transparency
E&P MSAs: ~70% utilization; 1,500-3,000 HP pumps; 72-hr mobilization
Strategic E&P MSAs deliver ~70% 2024 utilization and steadier revenue; OEMs supply 1,500–3,000 HP pumps and CT up to 20,000 ft; suppliers secure proppant/fuel via volume contracts reducing delays; safety partners enable 72-hour mobilization and data-sharing that cut incidents.
| Metric | 2024 |
|---|---|
| Utilization | 70% |
| Pumps HP | 1,500–3,000 |
| CT length | ~20,000 ft |
| Mobilization | 72 hrs |
What is included in the product
 Detailed Word Document
A concise, pre-written Business Model Canvas for STEP Energy Services, detailing customer segments, channels, value propositions, revenue streams, and key resources across the 9 BMC blocks. Reflects real-world operations, competitive advantages and linked SWOT insights—ideal for presentations, funding discussions, and strategic decision-making.

 Customizable Excel Spreadsheet
High-level, editable one-page snapshot that clarifies STEP Energy Services’ service lines, cost drivers and customer segments, saving hours of setup and aligning teams for faster strategic decisions.
Activities

Hydraulic fracturing execution
Designing and mobilizing high-rate, high-pressure stages to unlock unconventional reservoirs—typically on laterals averaging ~2,500 m—requires pump fleets delivering ~60–120 bpm and proppant programs of hundreds of tonnes per stage. Managing fluid systems, proppant logistics, and pump reliability targets cycle times often below 60 minutes per stage to minimize downtime. Continuous optimization has cut cost per stage by double-digit percentages across the sector, and post-job analysis drives iterative design improvements.
Coiled tubing interventions
Performing mill-outs, cleanouts and stimulations in long laterals and high-pressure wells supports sustained flow in wells with lateral lengths commonly 8,000–10,000 ft (2024 shale averages). Deploying deep-capacity coiled tubing units and downhole tools enables precision interventions and access to distal laterals. Real-time monitoring and contingency planning have driven NPT reductions reported up to 20% in field programs. These activities enhance wellbore access and increase production uptime and recovery.

Wireline and perforating services
Executing plug-and-perf operations with high reliability and tight stage timing, STEP emphasizes repeatable run schedules and real-time stage tracking to meet 2024 operational targets. Running logging and diagnostic tools provides completion quality assurance and immediate data for remediation. Coordination with frac crews compresses pad time and improves capital efficiency. Strict explosive handling protocols and regulatory compliance underpin all activities.

Asset maintenance and fleet optimization
Preventive maintenance and rapid repair cycles maximize fleet availability, with 2024 industry benchmarks showing availability gains of 8–12% and repair-cycle cuts reducing downtime by ~25%. Data-driven parts planning cuts failure rates in harsh duty cycles by ~20% while fleet right-sizing across basins trims idle time ~15%. Upgrading to higher-pressure, more efficient units can boost operational efficiency ~10% and day rates ~5%.
- 2024 benchmarks: +8–12% availability
- ~25% faster repair cycles
- ~20% fewer parts failures
- ~15% less idle time via right-sizing
- ~10% efficiency, ~5% day-rate lift from upgrades
Engineering, design, and job planning
Engineering, design and job planning at STEP focus on collaborative stage design, fluid systems and tool selection with clients, using simulations and risk reviews to anticipate operational challenges and reduce non-productive time by ~20% (industry 2024); pre-job logistics planning de-bottlenecks pads to lift throughput and cycle efficiency by ~15%; lessons learned are captured to standardize best practices and improve repeatability.
- Collaborative design
- Simulations & risk reviews
- Pre-job logistics (de-bottlenecking)
- Lessons learned → standardization
Fracturing: 60 min stages, +15% throughput
STEP focuses on high-rate, high-pressure fracturing and precision interventions on laterals ~2,500 m, targeting cycle times <60 min per stage and double-digit cost reductions versus legacy designs (2024). Preventive maintenance and parts planning boost fleet availability +8–12% and cut repair cycles ~25%, reducing NPT ~20%. Collaborative engineering, pre-job logistics and standardization lift pad throughput ~15% and lower idle time ~15%.
| Metric | 2024 Benchmark |
|---|---|
| Fleet availability | +8–12% |
| Repair cycle time | −25% |
| Parts failure rate | −20% |
| Pad throughput / idle time | +15% / −15% |
| Stage cycle time | <60 min |
Full Version Awaits
Business Model Canvas
The document previewed here is the actual STEP Energy Services Business Model Canvas, not a mockup; it’s a direct snapshot of the final deliverable. When you purchase, you’ll receive this exact file—complete, editable, and formatted for immediate use in Word and Excel. No surprises, just the full canvas ready for presentation and execution.

Business Model Canvas: Actionable Strategy & Revenue Insights for Energy Service Investors
Unlock the full strategic blueprint behind STEP Energy Services with our Business Model Canvas—three‑to‑five pages of company‑specific insights that reveal value propositions, key partners, and revenue levers. Ideal for investors, consultants, and executives seeking actionable strategy. Download the editable Word and Excel files to benchmark, adapt, and accelerate your decisions.
Partnerships
Upstream E&P operators
Strategic relationships with upstream E&P operators secure steady project flow and early visibility to completion schedules, supporting STEP's planning and revenue predictability; 2024 North American oilfield service utilization averaged about 70%. Joint planning optimizes frac, coiled tubing, and wireline sequencing for faster cycle times and lower nonproductive time. Preferred vendor status raises asset utilization and pricing stability, while long-term MSAs cut bid friction and standardize service quality.
Equipment OEMs and technology providers
Equipment OEMs and technology providers supply high-horsepower pumps (typically 1,500–3,000 HP), CT strings (up to ~20,000 ft), wireline tools and digital control systems that enable STEP’s completions fleet. Co-development programs concentrate on improving reliability, higher pressure ratings and richer data capture for unconventional plays. Priority parts access shortens peak-season downtime, while joint technology roadmaps align field needs with next-gen completions capabilities.
Chemical, sand, and logistics suppliers
Aligned supply chains with chemical, sand, and fuel suppliers secure on-time delivery of proppant, chemistry, and fuel amid volatile demand, reducing completion delays. Rail, trucking, and last-mile partners cut non-productive time and demurrage through synchronized scheduling. Coordinated staging lowers pad congestion and total completion costs. Volume agreements hedge price swings and protect allocation during spikes.
Safety, training, and compliance partners
Third-party safety trainers and auditors reinforce STEP Energy Services HSE culture, ensuring certifications and site-specific programs meet client and regulatory requirements and enabling compliant crew mobilization often within 72 hours. Data-sharing with partners in 2024 improved leading indicators and helped prevent incidents through proactive interventions.
- Third-party audits
- Site-specific certifications
- 72-hour mobilization
- Leading-indicator data-sharing
Digital data and analytics integrators
Integration partners stream live frac data, CT telemetry and wireline logs into client platforms, enabling real-time decisioning and analytics that sharpen pump schedules, stage designs and post-job diagnostics; in 2024 adopters reported measurable reductions in cycle time and improved stage success rates. Cloud-based reporting increases transparency and post-well learnings while interoperability lowers friction across multi-vendor sites.
- 2024 adopters: faster diagnostics
- Real-time telemetry: continuous data feed
- Analytics: optimized pump/stage designs
- Cloud reporting: enhanced transparency
E&P MSAs: ~70% utilization; 1,500-3,000 HP pumps; 72-hr mobilization
Strategic E&P MSAs deliver ~70% 2024 utilization and steadier revenue; OEMs supply 1,500–3,000 HP pumps and CT up to 20,000 ft; suppliers secure proppant/fuel via volume contracts reducing delays; safety partners enable 72-hour mobilization and data-sharing that cut incidents.
| Metric | 2024 |
|---|---|
| Utilization | 70% |
| Pumps HP | 1,500–3,000 |
| CT length | ~20,000 ft |
| Mobilization | 72 hrs |
What is included in the product
Detailed Word Document
A concise, pre-written Business Model Canvas for STEP Energy Services, detailing customer segments, channels, value propositions, revenue streams, and key resources across the 9 BMC blocks. Reflects real-world operations, competitive advantages and linked SWOT insights—ideal for presentations, funding discussions, and strategic decision-making.
Customizable Excel Spreadsheet
High-level, editable one-page snapshot that clarifies STEP Energy Services’ service lines, cost drivers and customer segments, saving hours of setup and aligning teams for faster strategic decisions.
Activities
Hydraulic fracturing execution
Designing and mobilizing high-rate, high-pressure stages to unlock unconventional reservoirs—typically on laterals averaging ~2,500 m—requires pump fleets delivering ~60–120 bpm and proppant programs of hundreds of tonnes per stage. Managing fluid systems, proppant logistics, and pump reliability targets cycle times often below 60 minutes per stage to minimize downtime. Continuous optimization has cut cost per stage by double-digit percentages across the sector, and post-job analysis drives iterative design improvements.
Coiled tubing interventions
Performing mill-outs, cleanouts and stimulations in long laterals and high-pressure wells supports sustained flow in wells with lateral lengths commonly 8,000–10,000 ft (2024 shale averages). Deploying deep-capacity coiled tubing units and downhole tools enables precision interventions and access to distal laterals. Real-time monitoring and contingency planning have driven NPT reductions reported up to 20% in field programs. These activities enhance wellbore access and increase production uptime and recovery.
Wireline and perforating services
Executing plug-and-perf operations with high reliability and tight stage timing, STEP emphasizes repeatable run schedules and real-time stage tracking to meet 2024 operational targets. Running logging and diagnostic tools provides completion quality assurance and immediate data for remediation. Coordination with frac crews compresses pad time and improves capital efficiency. Strict explosive handling protocols and regulatory compliance underpin all activities.
Asset maintenance and fleet optimization
Preventive maintenance and rapid repair cycles maximize fleet availability, with 2024 industry benchmarks showing availability gains of 8–12% and repair-cycle cuts reducing downtime by ~25%. Data-driven parts planning cuts failure rates in harsh duty cycles by ~20% while fleet right-sizing across basins trims idle time ~15%. Upgrading to higher-pressure, more efficient units can boost operational efficiency ~10% and day rates ~5%.
- 2024 benchmarks: +8–12% availability
- ~25% faster repair cycles
- ~20% fewer parts failures
- ~15% less idle time via right-sizing
- ~10% efficiency, ~5% day-rate lift from upgrades
Engineering, design, and job planning
Engineering, design and job planning at STEP focus on collaborative stage design, fluid systems and tool selection with clients, using simulations and risk reviews to anticipate operational challenges and reduce non-productive time by ~20% (industry 2024); pre-job logistics planning de-bottlenecks pads to lift throughput and cycle efficiency by ~15%; lessons learned are captured to standardize best practices and improve repeatability.
- Collaborative design
- Simulations & risk reviews
- Pre-job logistics (de-bottlenecking)
- Lessons learned → standardization
Fracturing: 60 min stages, +15% throughput
STEP focuses on high-rate, high-pressure fracturing and precision interventions on laterals ~2,500 m, targeting cycle times <60 min per stage and double-digit cost reductions versus legacy designs (2024). Preventive maintenance and parts planning boost fleet availability +8–12% and cut repair cycles ~25%, reducing NPT ~20%. Collaborative engineering, pre-job logistics and standardization lift pad throughput ~15% and lower idle time ~15%.
| Metric | 2024 Benchmark |
|---|---|
| Fleet availability | +8–12% |
| Repair cycle time | −25% |
| Parts failure rate | −20% |
| Pad throughput / idle time | +15% / −15% |
| Stage cycle time | <60 min |
Full Version Awaits
Business Model Canvas
The document previewed here is the actual STEP Energy Services Business Model Canvas, not a mockup; it’s a direct snapshot of the final deliverable. When you purchase, you’ll receive this exact file—complete, editable, and formatted for immediate use in Word and Excel. No surprises, just the full canvas ready for presentation and execution.
Original: $10.00
-65%$10.00
$3.50Description
Business Model Canvas: Actionable Strategy & Revenue Insights for Energy Service Investors
Unlock the full strategic blueprint behind STEP Energy Services with our Business Model Canvas—three‑to‑five pages of company‑specific insights that reveal value propositions, key partners, and revenue levers. Ideal for investors, consultants, and executives seeking actionable strategy. Download the editable Word and Excel files to benchmark, adapt, and accelerate your decisions.
Partnerships
Upstream E&P operators
Strategic relationships with upstream E&P operators secure steady project flow and early visibility to completion schedules, supporting STEP's planning and revenue predictability; 2024 North American oilfield service utilization averaged about 70%. Joint planning optimizes frac, coiled tubing, and wireline sequencing for faster cycle times and lower nonproductive time. Preferred vendor status raises asset utilization and pricing stability, while long-term MSAs cut bid friction and standardize service quality.
Equipment OEMs and technology providers
Equipment OEMs and technology providers supply high-horsepower pumps (typically 1,500–3,000 HP), CT strings (up to ~20,000 ft), wireline tools and digital control systems that enable STEP’s completions fleet. Co-development programs concentrate on improving reliability, higher pressure ratings and richer data capture for unconventional plays. Priority parts access shortens peak-season downtime, while joint technology roadmaps align field needs with next-gen completions capabilities.
Chemical, sand, and logistics suppliers
Aligned supply chains with chemical, sand, and fuel suppliers secure on-time delivery of proppant, chemistry, and fuel amid volatile demand, reducing completion delays. Rail, trucking, and last-mile partners cut non-productive time and demurrage through synchronized scheduling. Coordinated staging lowers pad congestion and total completion costs. Volume agreements hedge price swings and protect allocation during spikes.
Safety, training, and compliance partners
Third-party safety trainers and auditors reinforce STEP Energy Services HSE culture, ensuring certifications and site-specific programs meet client and regulatory requirements and enabling compliant crew mobilization often within 72 hours. Data-sharing with partners in 2024 improved leading indicators and helped prevent incidents through proactive interventions.
- Third-party audits
- Site-specific certifications
- 72-hour mobilization
- Leading-indicator data-sharing
Digital data and analytics integrators
Integration partners stream live frac data, CT telemetry and wireline logs into client platforms, enabling real-time decisioning and analytics that sharpen pump schedules, stage designs and post-job diagnostics; in 2024 adopters reported measurable reductions in cycle time and improved stage success rates. Cloud-based reporting increases transparency and post-well learnings while interoperability lowers friction across multi-vendor sites.
- 2024 adopters: faster diagnostics
- Real-time telemetry: continuous data feed
- Analytics: optimized pump/stage designs
- Cloud reporting: enhanced transparency
E&P MSAs: ~70% utilization; 1,500-3,000 HP pumps; 72-hr mobilization
Strategic E&P MSAs deliver ~70% 2024 utilization and steadier revenue; OEMs supply 1,500–3,000 HP pumps and CT up to 20,000 ft; suppliers secure proppant/fuel via volume contracts reducing delays; safety partners enable 72-hour mobilization and data-sharing that cut incidents.
| Metric | 2024 |
|---|---|
| Utilization | 70% |
| Pumps HP | 1,500–3,000 |
| CT length | ~20,000 ft |
| Mobilization | 72 hrs |
What is included in the product
Detailed Word Document
A concise, pre-written Business Model Canvas for STEP Energy Services, detailing customer segments, channels, value propositions, revenue streams, and key resources across the 9 BMC blocks. Reflects real-world operations, competitive advantages and linked SWOT insights—ideal for presentations, funding discussions, and strategic decision-making.
Customizable Excel Spreadsheet
High-level, editable one-page snapshot that clarifies STEP Energy Services’ service lines, cost drivers and customer segments, saving hours of setup and aligning teams for faster strategic decisions.
Activities
Hydraulic fracturing execution
Designing and mobilizing high-rate, high-pressure stages to unlock unconventional reservoirs—typically on laterals averaging ~2,500 m—requires pump fleets delivering ~60–120 bpm and proppant programs of hundreds of tonnes per stage. Managing fluid systems, proppant logistics, and pump reliability targets cycle times often below 60 minutes per stage to minimize downtime. Continuous optimization has cut cost per stage by double-digit percentages across the sector, and post-job analysis drives iterative design improvements.
Coiled tubing interventions
Performing mill-outs, cleanouts and stimulations in long laterals and high-pressure wells supports sustained flow in wells with lateral lengths commonly 8,000–10,000 ft (2024 shale averages). Deploying deep-capacity coiled tubing units and downhole tools enables precision interventions and access to distal laterals. Real-time monitoring and contingency planning have driven NPT reductions reported up to 20% in field programs. These activities enhance wellbore access and increase production uptime and recovery.
Wireline and perforating services
Executing plug-and-perf operations with high reliability and tight stage timing, STEP emphasizes repeatable run schedules and real-time stage tracking to meet 2024 operational targets. Running logging and diagnostic tools provides completion quality assurance and immediate data for remediation. Coordination with frac crews compresses pad time and improves capital efficiency. Strict explosive handling protocols and regulatory compliance underpin all activities.
Asset maintenance and fleet optimization
Preventive maintenance and rapid repair cycles maximize fleet availability, with 2024 industry benchmarks showing availability gains of 8–12% and repair-cycle cuts reducing downtime by ~25%. Data-driven parts planning cuts failure rates in harsh duty cycles by ~20% while fleet right-sizing across basins trims idle time ~15%. Upgrading to higher-pressure, more efficient units can boost operational efficiency ~10% and day rates ~5%.
- 2024 benchmarks: +8–12% availability
- ~25% faster repair cycles
- ~20% fewer parts failures
- ~15% less idle time via right-sizing
- ~10% efficiency, ~5% day-rate lift from upgrades
Engineering, design, and job planning
Engineering, design and job planning at STEP focus on collaborative stage design, fluid systems and tool selection with clients, using simulations and risk reviews to anticipate operational challenges and reduce non-productive time by ~20% (industry 2024); pre-job logistics planning de-bottlenecks pads to lift throughput and cycle efficiency by ~15%; lessons learned are captured to standardize best practices and improve repeatability.
- Collaborative design
- Simulations & risk reviews
- Pre-job logistics (de-bottlenecking)
- Lessons learned → standardization
Fracturing: 60 min stages, +15% throughput
STEP focuses on high-rate, high-pressure fracturing and precision interventions on laterals ~2,500 m, targeting cycle times <60 min per stage and double-digit cost reductions versus legacy designs (2024). Preventive maintenance and parts planning boost fleet availability +8–12% and cut repair cycles ~25%, reducing NPT ~20%. Collaborative engineering, pre-job logistics and standardization lift pad throughput ~15% and lower idle time ~15%.
| Metric | 2024 Benchmark |
|---|---|
| Fleet availability | +8–12% |
| Repair cycle time | −25% |
| Parts failure rate | −20% |
| Pad throughput / idle time | +15% / −15% |
| Stage cycle time | <60 min |
Full Version Awaits
Business Model Canvas
The document previewed here is the actual STEP Energy Services Business Model Canvas, not a mockup; it’s a direct snapshot of the final deliverable. When you purchase, you’ll receive this exact file—complete, editable, and formatted for immediate use in Word and Excel. No surprises, just the full canvas ready for presentation and execution.











