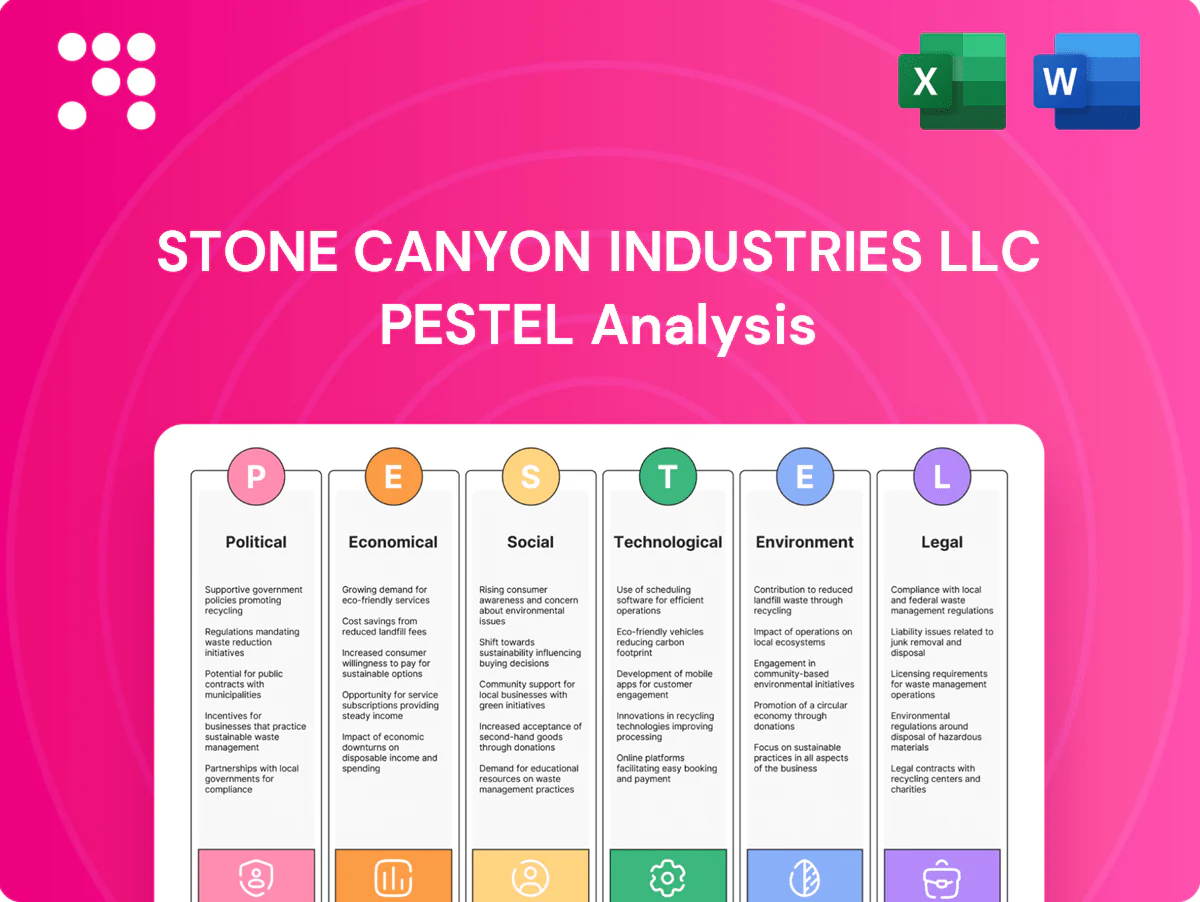
Stone Canyon Industries LLC PESTLE Analysis

Skip the Research. Get the Strategy.
Gain a decisive edge with our concise PESTLE analysis of Stone Canyon Industries LLC—revealing how political, economic, social, technological, legal, and environmental forces will shape its trajectory. Ideal for investors and strategists, this report turns external trends into actionable moves. Purchase the full analysis to access detailed insights and ready-to-use charts.
Political factors

Trade policy and tariffs
SCI’s cross-border portfolio is vulnerable to shifting tariff regimes, exemplified by US Section 301 duties affecting roughly $360 billion of Chinese goods since 2018. Changes in US-China/EU trade ties can raise input costs and restrict market access. Active supply‑chain routing and tariff engineering reduce volatility while ongoing monitoring enables timely pricing and sourcing adjustments.
Geopolitical risk and sanctions
Heightened geopolitical tensions increase risks of sanctions, export controls and asset freezes; by 2024 major sanctions lists contained over 10,000 designated entities, raising compliance stakes for global operators.
Transportation and industrial corridors face sudden route or market closures—for example, Black Sea and Baltic trade disruptions since 2022 cut some regional cargo volumes by double digits.
SCI needs scenario plans and alternative markets to preserve continuity, plus dedicated compliance oversight to mitigate secondary-sanction exposure and counterparty risk.

Industrial policy and infrastructure spending
Government incentives such as the CHIPS Act ($52 billion), the Bipartisan Infrastructure Law ($1.2 trillion, $550 billion new spending) and the Inflation Reduction Act (roughly $369 billion in clean energy incentives) create demand tailwinds across reshoring, semiconductors, rail, ports and energy transition. These bills can boost order books for logistics and industrial services, and SCI can target capital plans to eligible projects and tax credits. Policy reversals remain a material risk, so diversified exposure is required.

Public procurement and local content
Winning government contracts for Stone Canyon Industries often requires local content, union rules, and supplier certifications; US federal procurement ran near $700B in 2023, making compliance strategically critical. Portfolio companies must localize production to meet Buy America-type provisions, which can raise unit costs but build political goodwill and bid competitiveness. Structured JVs and supplier development programs are commonly used to ensure compliance and scale local capacity.
- Priority: localize manufacturing to access large public-sector spend
- Action: form JVs and supplier programs to de-risk compliance
- Trade-off: higher short-term costs vs. stronger political relationships
Tax regimes and incentives
Global minimum tax (OECD Pillar Two 15% adopted by 140+ jurisdictions by 2024) plus rising transfer pricing scrutiny compress after-tax returns and make incentive zones pivotal to effective rates; jurisdiction choice alters cash repatriation timing and investment pacing. SCI can optimize holding structures to preserve flexibility; sensitivity analyses should model tax-policy shifts (eg +/-300 basis points).
- Global minimum tax: 15% adoption (140+ jurisdictions)
- Transfer pricing: increased audit risk
- Incentive zones: affect effective rate
- Holding structures: preserve repatriation flexibility
- Sensitivity: model +/-300 bps
Tariffs $360B, sanctions > 10,000, CHIPS $52B boost reshoring
SCI faces tariff exposure (US Section 301 covered ~$360B of imports), growing sanction lists (>10,000 entities by 2024) and route disruptions (Black Sea/Baltic volumes down double digits). Major US bills (CHIPS $52B, Infrastructure $1.2T, IRA ~$369B) create demand tailwinds while US federal procurement (~$700B in 2023) favors localized supply. OECD Pillar Two (15%) adopted in 140+ jurisdictions raises effective tax floors.
| Risk/Opportunity | 2023–24 Data |
|---|---|
| Tariffs | $360B Section 301 coverage |
| Sanctions | >10,000 listed entities (2024) |
| US policy $ | CHIPS $52B; Infra $1.2T; IRA $369B |
| Procurement | ~$700B (2023) |
| Global tax | Pillar Two 15% (140+ juris.) |
What is included in the product
 Detailed Word Document
Explores how Political, Economic, Social, Technological, Environmental and Legal forces uniquely impact Stone Canyon Industries LLC, with data-driven sections reflecting current market and regulatory dynamics; designed to help executives, advisors and investors identify risks, opportunities and forward-looking strategic actions.

 Customizable Excel Spreadsheet
A streamlined PESTLE snapshot for Stone Canyon Industries LLC that distills external threats and opportunities into an easily shareable, editable format—ideal for fast alignment in meetings, risk discussions, and slide-ready summaries.
Economic factors

Interest rates and credit conditions
Higher policy rates (Fed funds ~5.25–5.50% mid-2025) elevate acquisition financing costs and raise internal hurdle rates, compressing deal IRRs. Tight credit makes refinancing windows and covenant headroom critical across operating units. SCI benefits from staggered maturities and a strong fixed-rate mix that limits immediate rollover exposure. As leveraged peers delever, opportunistic buys and distressed assets become more available.
Industrial cycle and demand elasticity
Industrial, transportation, and infrastructure end-markets are cyclical: ISM Manufacturing PMI hovered around 50 in 2024, freight volumes showed pronounced volatility and business capex growth slowed in 2024. SCI’s diversified portfolio smooths earnings but cannot eliminate swings in order intake and backlog tied to PMI and capex cycles. Flexible cost structures and variable staffing provide measurable cushioning during downturns.

Inflation and input costs
Volatile commodity, energy and freight costs—Brent averaged about $82/bbl in 2024 and global freight rates remained elevated versus pre‑pandemic norms—continue to pressure margins. Pass‑through clauses and index‑linked pricing have preserved cash flow, reducing input cost exposure. Procurement scale enables effective hedging and vendor consolidation, lowering purchase volatility. Continuous SIOP planning limits inventory valuation risk and working capital swings.

FX volatility and global exposures
Multi-currency revenues and costs expose Stone Canyon Industries to translation and transaction risk across major pairs; global FX turnover averaged 7.5 trillion USD/day in the BIS 2022 survey, underscoring market depth and volatility. Active hedging programs and natural operational offsets have historically stabilized EBITDA variability. FX swings can open cross-border M&A value gaps while centralized treasury improves visibility and execution.
- translation risk
- hedging reduces EBITDA volatility
- M&A value gaps from FX
- treasury centralization = better execution
Labor markets and productivity
Tight skilled-labor markets—with U.S. unemployment near 3.6% in mid-2024—raise wage bills and constrain capacity for Stone Canyon, prompting capital investment in automation and lean programs that boost throughput and lower unit costs. Apprenticeships secure pipelines while incentive pay tied to OEE drives measurable performance gains.
- Skilled labor scarcity: higher wage pressure
- Automation/lean: improved throughput, lower unit cost
- Apprenticeships: future talent pipeline
- OEE-linked pay: aligns incentives with productivity
Tariffs $360B, sanctions > 10,000, CHIPS $52B boost reshoring
Higher policy rates (Fed funds ~5.25–5.50% mid-2025) raise financing costs and compress deal IRRs; tight credit increases refinancing and covenant risk. Cyclical end‑markets (ISM ~50 in 2024) and volatile freight/energy (Brent ~$82/bbl 2024) pressure margins despite pass‑throughs and hedging. Skilled‑labor tightness (U.S. unemployment ~3.6% mid‑2024) drives automation capex and OEE incentives.
| Metric | Value |
|---|---|
| Fed funds | 5.25–5.50% (mid‑2025) |
| Brent (2024) | $82/bbl |
| ISM Mfg (2024) | ~50 |
| US unemployment | 3.6% (mid‑2024) |
| BIS FX turnover | $7.5T/day (2022) |
Preview the Actual Deliverable
Stone Canyon Industries LLC PESTLE Analysis
The preview shown here is the exact Stone Canyon Industries LLC PESTLE Analysis you’ll receive after purchase—fully formatted and ready to use. This is a real snapshot of the final document, delivered exactly as shown with no placeholders or teasers. The layout, content, and structure visible here are what you’ll download instantly after payment.

Skip the Research. Get the Strategy.
Gain a decisive edge with our concise PESTLE analysis of Stone Canyon Industries LLC—revealing how political, economic, social, technological, legal, and environmental forces will shape its trajectory. Ideal for investors and strategists, this report turns external trends into actionable moves. Purchase the full analysis to access detailed insights and ready-to-use charts.
Political factors
Trade policy and tariffs
SCI’s cross-border portfolio is vulnerable to shifting tariff regimes, exemplified by US Section 301 duties affecting roughly $360 billion of Chinese goods since 2018. Changes in US-China/EU trade ties can raise input costs and restrict market access. Active supply‑chain routing and tariff engineering reduce volatility while ongoing monitoring enables timely pricing and sourcing adjustments.
Geopolitical risk and sanctions
Heightened geopolitical tensions increase risks of sanctions, export controls and asset freezes; by 2024 major sanctions lists contained over 10,000 designated entities, raising compliance stakes for global operators.
Transportation and industrial corridors face sudden route or market closures—for example, Black Sea and Baltic trade disruptions since 2022 cut some regional cargo volumes by double digits.
SCI needs scenario plans and alternative markets to preserve continuity, plus dedicated compliance oversight to mitigate secondary-sanction exposure and counterparty risk.
Industrial policy and infrastructure spending
Government incentives such as the CHIPS Act ($52 billion), the Bipartisan Infrastructure Law ($1.2 trillion, $550 billion new spending) and the Inflation Reduction Act (roughly $369 billion in clean energy incentives) create demand tailwinds across reshoring, semiconductors, rail, ports and energy transition. These bills can boost order books for logistics and industrial services, and SCI can target capital plans to eligible projects and tax credits. Policy reversals remain a material risk, so diversified exposure is required.
Public procurement and local content
Winning government contracts for Stone Canyon Industries often requires local content, union rules, and supplier certifications; US federal procurement ran near $700B in 2023, making compliance strategically critical. Portfolio companies must localize production to meet Buy America-type provisions, which can raise unit costs but build political goodwill and bid competitiveness. Structured JVs and supplier development programs are commonly used to ensure compliance and scale local capacity.
- Priority: localize manufacturing to access large public-sector spend
- Action: form JVs and supplier programs to de-risk compliance
- Trade-off: higher short-term costs vs. stronger political relationships
Tax regimes and incentives
Global minimum tax (OECD Pillar Two 15% adopted by 140+ jurisdictions by 2024) plus rising transfer pricing scrutiny compress after-tax returns and make incentive zones pivotal to effective rates; jurisdiction choice alters cash repatriation timing and investment pacing. SCI can optimize holding structures to preserve flexibility; sensitivity analyses should model tax-policy shifts (eg +/-300 basis points).
- Global minimum tax: 15% adoption (140+ jurisdictions)
- Transfer pricing: increased audit risk
- Incentive zones: affect effective rate
- Holding structures: preserve repatriation flexibility
- Sensitivity: model +/-300 bps
Tariffs $360B, sanctions > 10,000, CHIPS $52B boost reshoring
SCI faces tariff exposure (US Section 301 covered ~$360B of imports), growing sanction lists (>10,000 entities by 2024) and route disruptions (Black Sea/Baltic volumes down double digits). Major US bills (CHIPS $52B, Infrastructure $1.2T, IRA ~$369B) create demand tailwinds while US federal procurement (~$700B in 2023) favors localized supply. OECD Pillar Two (15%) adopted in 140+ jurisdictions raises effective tax floors.
| Risk/Opportunity | 2023–24 Data |
|---|---|
| Tariffs | $360B Section 301 coverage |
| Sanctions | >10,000 listed entities (2024) |
| US policy $ | CHIPS $52B; Infra $1.2T; IRA $369B |
| Procurement | ~$700B (2023) |
| Global tax | Pillar Two 15% (140+ juris.) |
What is included in the product
Detailed Word Document
Explores how Political, Economic, Social, Technological, Environmental and Legal forces uniquely impact Stone Canyon Industries LLC, with data-driven sections reflecting current market and regulatory dynamics; designed to help executives, advisors and investors identify risks, opportunities and forward-looking strategic actions.
Customizable Excel Spreadsheet
A streamlined PESTLE snapshot for Stone Canyon Industries LLC that distills external threats and opportunities into an easily shareable, editable format—ideal for fast alignment in meetings, risk discussions, and slide-ready summaries.
Economic factors
Interest rates and credit conditions
Higher policy rates (Fed funds ~5.25–5.50% mid-2025) elevate acquisition financing costs and raise internal hurdle rates, compressing deal IRRs. Tight credit makes refinancing windows and covenant headroom critical across operating units. SCI benefits from staggered maturities and a strong fixed-rate mix that limits immediate rollover exposure. As leveraged peers delever, opportunistic buys and distressed assets become more available.
Industrial cycle and demand elasticity
Industrial, transportation, and infrastructure end-markets are cyclical: ISM Manufacturing PMI hovered around 50 in 2024, freight volumes showed pronounced volatility and business capex growth slowed in 2024. SCI’s diversified portfolio smooths earnings but cannot eliminate swings in order intake and backlog tied to PMI and capex cycles. Flexible cost structures and variable staffing provide measurable cushioning during downturns.
Inflation and input costs
Volatile commodity, energy and freight costs—Brent averaged about $82/bbl in 2024 and global freight rates remained elevated versus pre‑pandemic norms—continue to pressure margins. Pass‑through clauses and index‑linked pricing have preserved cash flow, reducing input cost exposure. Procurement scale enables effective hedging and vendor consolidation, lowering purchase volatility. Continuous SIOP planning limits inventory valuation risk and working capital swings.
FX volatility and global exposures
Multi-currency revenues and costs expose Stone Canyon Industries to translation and transaction risk across major pairs; global FX turnover averaged 7.5 trillion USD/day in the BIS 2022 survey, underscoring market depth and volatility. Active hedging programs and natural operational offsets have historically stabilized EBITDA variability. FX swings can open cross-border M&A value gaps while centralized treasury improves visibility and execution.
- translation risk
- hedging reduces EBITDA volatility
- M&A value gaps from FX
- treasury centralization = better execution
Labor markets and productivity
Tight skilled-labor markets—with U.S. unemployment near 3.6% in mid-2024—raise wage bills and constrain capacity for Stone Canyon, prompting capital investment in automation and lean programs that boost throughput and lower unit costs. Apprenticeships secure pipelines while incentive pay tied to OEE drives measurable performance gains.
- Skilled labor scarcity: higher wage pressure
- Automation/lean: improved throughput, lower unit cost
- Apprenticeships: future talent pipeline
- OEE-linked pay: aligns incentives with productivity
Tariffs $360B, sanctions > 10,000, CHIPS $52B boost reshoring
Higher policy rates (Fed funds ~5.25–5.50% mid-2025) raise financing costs and compress deal IRRs; tight credit increases refinancing and covenant risk. Cyclical end‑markets (ISM ~50 in 2024) and volatile freight/energy (Brent ~$82/bbl 2024) pressure margins despite pass‑throughs and hedging. Skilled‑labor tightness (U.S. unemployment ~3.6% mid‑2024) drives automation capex and OEE incentives.
| Metric | Value |
|---|---|
| Fed funds | 5.25–5.50% (mid‑2025) |
| Brent (2024) | $82/bbl |
| ISM Mfg (2024) | ~50 |
| US unemployment | 3.6% (mid‑2024) |
| BIS FX turnover | $7.5T/day (2022) |
Preview the Actual Deliverable
Stone Canyon Industries LLC PESTLE Analysis
The preview shown here is the exact Stone Canyon Industries LLC PESTLE Analysis you’ll receive after purchase—fully formatted and ready to use. This is a real snapshot of the final document, delivered exactly as shown with no placeholders or teasers. The layout, content, and structure visible here are what you’ll download instantly after payment.
Description
Skip the Research. Get the Strategy.
Gain a decisive edge with our concise PESTLE analysis of Stone Canyon Industries LLC—revealing how political, economic, social, technological, legal, and environmental forces will shape its trajectory. Ideal for investors and strategists, this report turns external trends into actionable moves. Purchase the full analysis to access detailed insights and ready-to-use charts.
Political factors
Trade policy and tariffs
SCI’s cross-border portfolio is vulnerable to shifting tariff regimes, exemplified by US Section 301 duties affecting roughly $360 billion of Chinese goods since 2018. Changes in US-China/EU trade ties can raise input costs and restrict market access. Active supply‑chain routing and tariff engineering reduce volatility while ongoing monitoring enables timely pricing and sourcing adjustments.
Geopolitical risk and sanctions
Heightened geopolitical tensions increase risks of sanctions, export controls and asset freezes; by 2024 major sanctions lists contained over 10,000 designated entities, raising compliance stakes for global operators.
Transportation and industrial corridors face sudden route or market closures—for example, Black Sea and Baltic trade disruptions since 2022 cut some regional cargo volumes by double digits.
SCI needs scenario plans and alternative markets to preserve continuity, plus dedicated compliance oversight to mitigate secondary-sanction exposure and counterparty risk.
Industrial policy and infrastructure spending
Government incentives such as the CHIPS Act ($52 billion), the Bipartisan Infrastructure Law ($1.2 trillion, $550 billion new spending) and the Inflation Reduction Act (roughly $369 billion in clean energy incentives) create demand tailwinds across reshoring, semiconductors, rail, ports and energy transition. These bills can boost order books for logistics and industrial services, and SCI can target capital plans to eligible projects and tax credits. Policy reversals remain a material risk, so diversified exposure is required.
Public procurement and local content
Winning government contracts for Stone Canyon Industries often requires local content, union rules, and supplier certifications; US federal procurement ran near $700B in 2023, making compliance strategically critical. Portfolio companies must localize production to meet Buy America-type provisions, which can raise unit costs but build political goodwill and bid competitiveness. Structured JVs and supplier development programs are commonly used to ensure compliance and scale local capacity.
- Priority: localize manufacturing to access large public-sector spend
- Action: form JVs and supplier programs to de-risk compliance
- Trade-off: higher short-term costs vs. stronger political relationships
Tax regimes and incentives
Global minimum tax (OECD Pillar Two 15% adopted by 140+ jurisdictions by 2024) plus rising transfer pricing scrutiny compress after-tax returns and make incentive zones pivotal to effective rates; jurisdiction choice alters cash repatriation timing and investment pacing. SCI can optimize holding structures to preserve flexibility; sensitivity analyses should model tax-policy shifts (eg +/-300 basis points).
- Global minimum tax: 15% adoption (140+ jurisdictions)
- Transfer pricing: increased audit risk
- Incentive zones: affect effective rate
- Holding structures: preserve repatriation flexibility
- Sensitivity: model +/-300 bps
Tariffs $360B, sanctions > 10,000, CHIPS $52B boost reshoring
SCI faces tariff exposure (US Section 301 covered ~$360B of imports), growing sanction lists (>10,000 entities by 2024) and route disruptions (Black Sea/Baltic volumes down double digits). Major US bills (CHIPS $52B, Infrastructure $1.2T, IRA ~$369B) create demand tailwinds while US federal procurement (~$700B in 2023) favors localized supply. OECD Pillar Two (15%) adopted in 140+ jurisdictions raises effective tax floors.
| Risk/Opportunity | 2023–24 Data |
|---|---|
| Tariffs | $360B Section 301 coverage |
| Sanctions | >10,000 listed entities (2024) |
| US policy $ | CHIPS $52B; Infra $1.2T; IRA $369B |
| Procurement | ~$700B (2023) |
| Global tax | Pillar Two 15% (140+ juris.) |
What is included in the product
Detailed Word Document
Explores how Political, Economic, Social, Technological, Environmental and Legal forces uniquely impact Stone Canyon Industries LLC, with data-driven sections reflecting current market and regulatory dynamics; designed to help executives, advisors and investors identify risks, opportunities and forward-looking strategic actions.
Customizable Excel Spreadsheet
A streamlined PESTLE snapshot for Stone Canyon Industries LLC that distills external threats and opportunities into an easily shareable, editable format—ideal for fast alignment in meetings, risk discussions, and slide-ready summaries.
Economic factors
Interest rates and credit conditions
Higher policy rates (Fed funds ~5.25–5.50% mid-2025) elevate acquisition financing costs and raise internal hurdle rates, compressing deal IRRs. Tight credit makes refinancing windows and covenant headroom critical across operating units. SCI benefits from staggered maturities and a strong fixed-rate mix that limits immediate rollover exposure. As leveraged peers delever, opportunistic buys and distressed assets become more available.
Industrial cycle and demand elasticity
Industrial, transportation, and infrastructure end-markets are cyclical: ISM Manufacturing PMI hovered around 50 in 2024, freight volumes showed pronounced volatility and business capex growth slowed in 2024. SCI’s diversified portfolio smooths earnings but cannot eliminate swings in order intake and backlog tied to PMI and capex cycles. Flexible cost structures and variable staffing provide measurable cushioning during downturns.
Inflation and input costs
Volatile commodity, energy and freight costs—Brent averaged about $82/bbl in 2024 and global freight rates remained elevated versus pre‑pandemic norms—continue to pressure margins. Pass‑through clauses and index‑linked pricing have preserved cash flow, reducing input cost exposure. Procurement scale enables effective hedging and vendor consolidation, lowering purchase volatility. Continuous SIOP planning limits inventory valuation risk and working capital swings.
FX volatility and global exposures
Multi-currency revenues and costs expose Stone Canyon Industries to translation and transaction risk across major pairs; global FX turnover averaged 7.5 trillion USD/day in the BIS 2022 survey, underscoring market depth and volatility. Active hedging programs and natural operational offsets have historically stabilized EBITDA variability. FX swings can open cross-border M&A value gaps while centralized treasury improves visibility and execution.
- translation risk
- hedging reduces EBITDA volatility
- M&A value gaps from FX
- treasury centralization = better execution
Labor markets and productivity
Tight skilled-labor markets—with U.S. unemployment near 3.6% in mid-2024—raise wage bills and constrain capacity for Stone Canyon, prompting capital investment in automation and lean programs that boost throughput and lower unit costs. Apprenticeships secure pipelines while incentive pay tied to OEE drives measurable performance gains.
- Skilled labor scarcity: higher wage pressure
- Automation/lean: improved throughput, lower unit cost
- Apprenticeships: future talent pipeline
- OEE-linked pay: aligns incentives with productivity
Tariffs $360B, sanctions > 10,000, CHIPS $52B boost reshoring
Higher policy rates (Fed funds ~5.25–5.50% mid-2025) raise financing costs and compress deal IRRs; tight credit increases refinancing and covenant risk. Cyclical end‑markets (ISM ~50 in 2024) and volatile freight/energy (Brent ~$82/bbl 2024) pressure margins despite pass‑throughs and hedging. Skilled‑labor tightness (U.S. unemployment ~3.6% mid‑2024) drives automation capex and OEE incentives.
| Metric | Value |
|---|---|
| Fed funds | 5.25–5.50% (mid‑2025) |
| Brent (2024) | $82/bbl |
| ISM Mfg (2024) | ~50 |
| US unemployment | 3.6% (mid‑2024) |
| BIS FX turnover | $7.5T/day (2022) |
Preview the Actual Deliverable
Stone Canyon Industries LLC PESTLE Analysis
The preview shown here is the exact Stone Canyon Industries LLC PESTLE Analysis you’ll receive after purchase—fully formatted and ready to use. This is a real snapshot of the final document, delivered exactly as shown with no placeholders or teasers. The layout, content, and structure visible here are what you’ll download instantly after payment.











