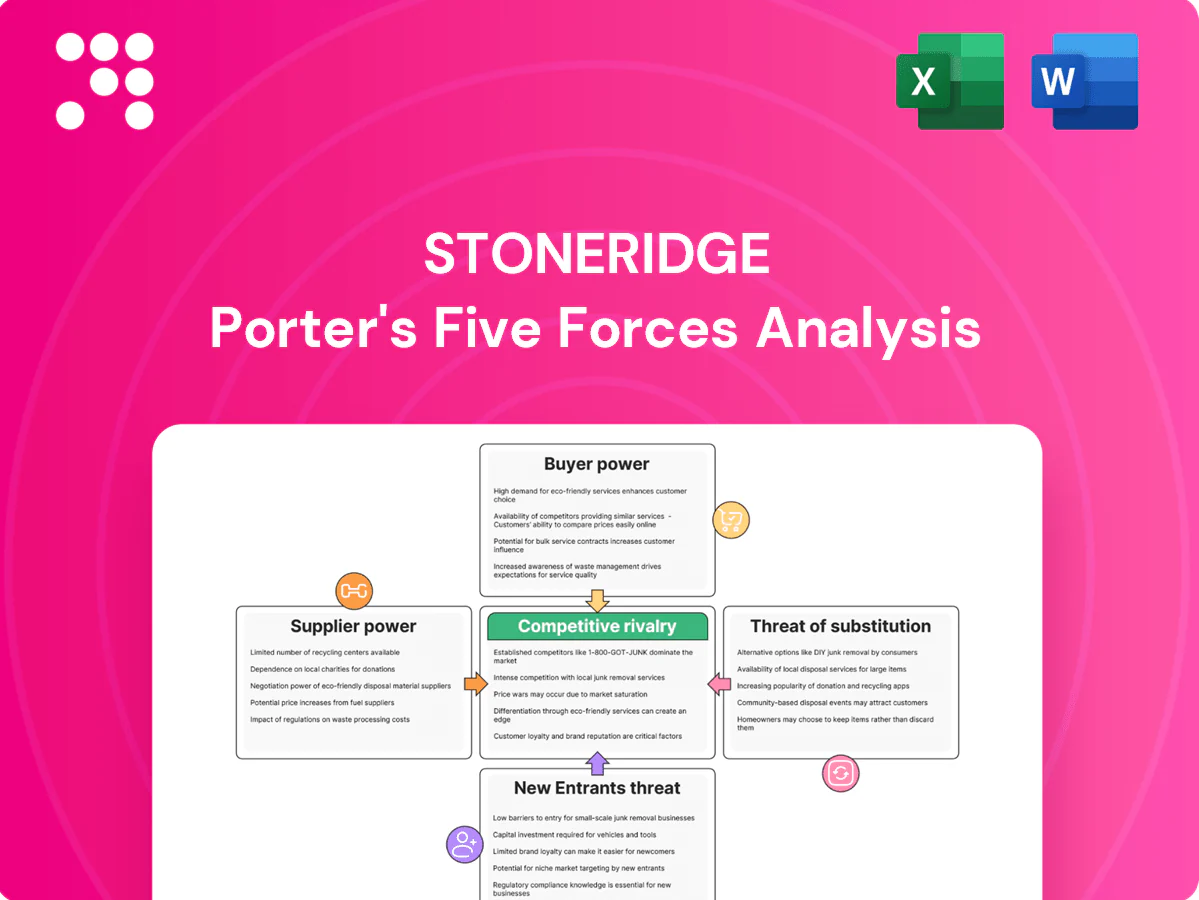
Stoneridge Porter's Five Forces Analysis

A Must-Have Tool for Decision-Makers
Stoneridge’s Porter's Five Forces snapshot highlights key pressures—from supplier leverage to competitive rivalry—and how they shape margins and growth potential. This brief view teases strategic risks and opportunities but omits force-by-force detail. Unlock the full Porter's Five Forces Analysis for a consultant-grade breakdown, visuals, and actionable recommendations tailored to Stoneridge.
Suppliers Bargaining Power

Chip and component concentration
Advanced semiconductors, sensors and displays are concentrated among a few vendors, with TSMC holding roughly 54% of global foundry share in 2024 and Samsung Display and LG Display dominant in automotive panels, concentrating supplier power.
Design-in lifecycles and PPAP approvals typically take 3–6 months, making supplier switches costly and time-consuming.
Lead-time volatility, averaging around 20 weeks in 2023, lets suppliers push price and allocation terms.
Long-term supply agreements mitigate but rarely eliminate dependence, often covering just over 50% of volumes.
Quality and compliance requirements
Automotive-grade standards (AEC-Q, ISO 26262, IATF 16949) sharply limit qualified suppliers, concentrating leverage among certified Tier‑1s. Requalification of alternates typically adds 6–12 months and commonly $1–3M in testing and validation, raising switching costs. Suppliers meeting these specs often command 2–5% premium on pricing and stricter payment terms. A single quality deviation can trigger line‑stop penalties often ranging tens to hundreds of thousands of dollars per hour, amplifying supplier power.

Raw material volatility
Prices for copper (around US$9,000/tonne in 2024), resins and specialty glass—which experienced 10–20% swings in 2024—plus scarce rare earths materially drive Stoneridge input costs. Suppliers typically pass surcharges through faster than OEMs can reprice contracts, compressing margins. Hedging and cost-recovery clauses in 2024 reduced volatility impact but did not eliminate exposure. Periods of scarcity decisively strengthen supplier bargaining power.

Geopolitical and capacity risks
Semiconductor geopolitics and capacity cycles amplify supplier power during shortages: Taiwan holds ≈60% of advanced foundry capacity and export controls plus policies (US CHIPS Act $52.7B; EU Chips Act €43B) force regionalization and complicate multi-sourcing. Dual- and near-shoring reduce concentration risk but raise capex and unit costs. Suppliers with diversified fabs and logistics networks gain leverage.
- Geographic concentration: Taiwan ≈60% advanced foundry share
- Policy spend: US CHIPS $52.7B; EU Chips Act €43B
- Strategic impact: regionalization eases risk but increases cost
EMS and tooling dependencies
Reliance on contract manufacturers and bespoke tooling locks Stoneridge into specific EMS supply paths, with the global EMS market exceeding USD 600 billion in 2024 and large CM partners wielding scale advantages. Tool move costs and validation commonly require 8–16 weeks and significant capital, deterring switching; volume commitments and take‑or‑pay terms shift inventory and demand risk to OEMs. Co‑development of processes with CMs deepens operational interdependence and raises exit costs.
- EMS market 2024: >USD 600 billion
- Tooling validation: 8–16 weeks
- Take‑or‑pay and volume commitments transfer demand risk
- Co‑development increases supplier lock‑in
Concentrated supply (≈54%), long lead times squeeze OEMs
Supplier power is high: advanced semiconductors and displays are concentrated (TSMC ≈54% foundry share 2024), raising switch costs.
Long lead times (~20 weeks 2023), PPAP cycles (3–6 months) and OEM requalification (6–12 months, $1–3M) lock in suppliers.
Commodity swings (copper ≈US$9,000/t 2024) and EMS scale (>US$600bn 2024) further amplify supplier leverage.
| Metric | 2024 value |
|---|---|
| TSMC foundry share | ≈54% |
| Copper | ≈US$9,000/t |
| EMS market | >US$600bn |
What is included in the product
 Detailed Word Document
Concise Porter's Five Forces analysis for Stoneridge, assessing competitive rivalry, supplier and buyer power, threat of new entrants and substitutes, and identifying strategic levers to protect margins and market share.

 Customizable Excel Spreadsheet
A concise one-sheet Porter's Five Forces for Stoneridge that turns complex competitive pressures into an editable spider/radar chart—easy to customize, copy into decks, integrate with Excel dashboards, and quickly relieve analysis bottlenecks for faster strategic decisions.
Customers Bargaining Power

Concentrated OEM customers
Large global OEMs and Tier 1s like Ford, GM and Stellantis exert strong negotiating leverage over Stoneridge, pressing for price-downs, open-book costing and extended warranty coverage. Platform awards are decided on cost, quality and delivery metrics, so losing a platform can materially reduce volumes and margins. Concentrated OEM exposure increases revenue volatility and compresses supplier pricing power.
High switching costs but multi-sourcing
Integration into vehicle platforms raises switching costs because validation and software integration typically add 12–24 months and multimillion-dollar engineering programs, locking suppliers into OEM architectures.
Yet OEMs commonly mandate dual sourcing to retain leverage and continuity of supply, so incumbency helps but does not guarantee renewal.
Significant performance shortfalls or 5–15% cost gaps frequently trigger competitive resourcing and requalification efforts.

Aftermarket price sensitivity
Aftermarket customers prioritize price and availability over bespoke features, driving intense online competition as e-commerce channels captured roughly 20% of parts sales by 2024. Brand and reliability still influence fleet and OEM-replacement purchases, but margins face headwinds from online marketplaces and discounting. Growth of private-label and generic alternatives further compresses pricing power. Differentiated features and superior service can partly temper customer bargaining strength.

Specification control and design authority
Buyers control specifications and push custom requirements that limit part reuse, driving engineering change orders that suppliers often must absorb; OEM value-engineering programs in 2024 commonly targeted roughly 3–5% annual cost reductions, squeezing margins and making early design influence critical to protect profitability.
- Specification control: OEMs dictate designs limiting reuse
- Change orders: ECRs/ECOs shift cost to suppliers
- Value engineering: 3–5% annual targets in 2024
- Early influence: design-in protects margins
Service level and penalty regimes
Strict delivery, quality and PPAP metrics at Stoneridge tie penalties and scorecards to supplier performance; OEMs commonly demand OTIF ≥95% and PPM <100, with failure to meet targets triggering chargebacks. Field failure liabilities such as warranty and recall responsibilities shift risk to suppliers under standard contracts, while extended payment terms of 90–120 days strain supplier working capital.
- OTIF target: ≥95%
- PPM benchmark: <100
- Payment terms: 90–120 days
- Penalties: scorecard-linked chargebacks
OEM/Tier‑1 leverage forces price‑downs; e‑commerce ~20%, VE 3–5%
OEMs and large Tier‑1s hold strong leverage over Stoneridge, driving price-downs, dual‑sourcing and platform awards that can cut volumes/margins materially. Aftermarket price sensitivity and ~20% e‑commerce share in 2024 compress margins; value‑engineering targets ~3–5% annually. Specs, ECRs and long payment terms (90–120 days) shift costs and working capital burden to suppliers; OTIF ≥95% and PPM <100 enforce penalties.
| Metric | 2024 |
|---|---|
| e‑commerce share | ~20% |
| Value‑engineering | 3–5% pa |
| OTIF | ≥95% |
| PPM | <100 |
| Payment terms | 90–120 days |
Full Version Awaits
Stoneridge Porter's Five Forces Analysis
This preview shows the exact Stoneridge Porter's Five Forces Analysis you'll receive after purchase—no placeholders or mockups. The full document is professionally formatted, ready for download and immediate use. What you see here is the final deliverable, complete and unchanged.

A Must-Have Tool for Decision-Makers
Stoneridge’s Porter's Five Forces snapshot highlights key pressures—from supplier leverage to competitive rivalry—and how they shape margins and growth potential. This brief view teases strategic risks and opportunities but omits force-by-force detail. Unlock the full Porter's Five Forces Analysis for a consultant-grade breakdown, visuals, and actionable recommendations tailored to Stoneridge.
Suppliers Bargaining Power
Chip and component concentration
Advanced semiconductors, sensors and displays are concentrated among a few vendors, with TSMC holding roughly 54% of global foundry share in 2024 and Samsung Display and LG Display dominant in automotive panels, concentrating supplier power.
Design-in lifecycles and PPAP approvals typically take 3–6 months, making supplier switches costly and time-consuming.
Lead-time volatility, averaging around 20 weeks in 2023, lets suppliers push price and allocation terms.
Long-term supply agreements mitigate but rarely eliminate dependence, often covering just over 50% of volumes.
Quality and compliance requirements
Automotive-grade standards (AEC-Q, ISO 26262, IATF 16949) sharply limit qualified suppliers, concentrating leverage among certified Tier‑1s. Requalification of alternates typically adds 6–12 months and commonly $1–3M in testing and validation, raising switching costs. Suppliers meeting these specs often command 2–5% premium on pricing and stricter payment terms. A single quality deviation can trigger line‑stop penalties often ranging tens to hundreds of thousands of dollars per hour, amplifying supplier power.
Raw material volatility
Prices for copper (around US$9,000/tonne in 2024), resins and specialty glass—which experienced 10–20% swings in 2024—plus scarce rare earths materially drive Stoneridge input costs. Suppliers typically pass surcharges through faster than OEMs can reprice contracts, compressing margins. Hedging and cost-recovery clauses in 2024 reduced volatility impact but did not eliminate exposure. Periods of scarcity decisively strengthen supplier bargaining power.
Geopolitical and capacity risks
Semiconductor geopolitics and capacity cycles amplify supplier power during shortages: Taiwan holds ≈60% of advanced foundry capacity and export controls plus policies (US CHIPS Act $52.7B; EU Chips Act €43B) force regionalization and complicate multi-sourcing. Dual- and near-shoring reduce concentration risk but raise capex and unit costs. Suppliers with diversified fabs and logistics networks gain leverage.
- Geographic concentration: Taiwan ≈60% advanced foundry share
- Policy spend: US CHIPS $52.7B; EU Chips Act €43B
- Strategic impact: regionalization eases risk but increases cost
EMS and tooling dependencies
Reliance on contract manufacturers and bespoke tooling locks Stoneridge into specific EMS supply paths, with the global EMS market exceeding USD 600 billion in 2024 and large CM partners wielding scale advantages. Tool move costs and validation commonly require 8–16 weeks and significant capital, deterring switching; volume commitments and take‑or‑pay terms shift inventory and demand risk to OEMs. Co‑development of processes with CMs deepens operational interdependence and raises exit costs.
- EMS market 2024: >USD 600 billion
- Tooling validation: 8–16 weeks
- Take‑or‑pay and volume commitments transfer demand risk
- Co‑development increases supplier lock‑in
Concentrated supply (≈54%), long lead times squeeze OEMs
Supplier power is high: advanced semiconductors and displays are concentrated (TSMC ≈54% foundry share 2024), raising switch costs.
Long lead times (~20 weeks 2023), PPAP cycles (3–6 months) and OEM requalification (6–12 months, $1–3M) lock in suppliers.
Commodity swings (copper ≈US$9,000/t 2024) and EMS scale (>US$600bn 2024) further amplify supplier leverage.
| Metric | 2024 value |
|---|---|
| TSMC foundry share | ≈54% |
| Copper | ≈US$9,000/t |
| EMS market | >US$600bn |
What is included in the product
Detailed Word Document
Concise Porter's Five Forces analysis for Stoneridge, assessing competitive rivalry, supplier and buyer power, threat of new entrants and substitutes, and identifying strategic levers to protect margins and market share.
Customizable Excel Spreadsheet
A concise one-sheet Porter's Five Forces for Stoneridge that turns complex competitive pressures into an editable spider/radar chart—easy to customize, copy into decks, integrate with Excel dashboards, and quickly relieve analysis bottlenecks for faster strategic decisions.
Customers Bargaining Power
Concentrated OEM customers
Large global OEMs and Tier 1s like Ford, GM and Stellantis exert strong negotiating leverage over Stoneridge, pressing for price-downs, open-book costing and extended warranty coverage. Platform awards are decided on cost, quality and delivery metrics, so losing a platform can materially reduce volumes and margins. Concentrated OEM exposure increases revenue volatility and compresses supplier pricing power.
High switching costs but multi-sourcing
Integration into vehicle platforms raises switching costs because validation and software integration typically add 12–24 months and multimillion-dollar engineering programs, locking suppliers into OEM architectures.
Yet OEMs commonly mandate dual sourcing to retain leverage and continuity of supply, so incumbency helps but does not guarantee renewal.
Significant performance shortfalls or 5–15% cost gaps frequently trigger competitive resourcing and requalification efforts.
Aftermarket price sensitivity
Aftermarket customers prioritize price and availability over bespoke features, driving intense online competition as e-commerce channels captured roughly 20% of parts sales by 2024. Brand and reliability still influence fleet and OEM-replacement purchases, but margins face headwinds from online marketplaces and discounting. Growth of private-label and generic alternatives further compresses pricing power. Differentiated features and superior service can partly temper customer bargaining strength.
Specification control and design authority
Buyers control specifications and push custom requirements that limit part reuse, driving engineering change orders that suppliers often must absorb; OEM value-engineering programs in 2024 commonly targeted roughly 3–5% annual cost reductions, squeezing margins and making early design influence critical to protect profitability.
- Specification control: OEMs dictate designs limiting reuse
- Change orders: ECRs/ECOs shift cost to suppliers
- Value engineering: 3–5% annual targets in 2024
- Early influence: design-in protects margins
Service level and penalty regimes
Strict delivery, quality and PPAP metrics at Stoneridge tie penalties and scorecards to supplier performance; OEMs commonly demand OTIF ≥95% and PPM <100, with failure to meet targets triggering chargebacks. Field failure liabilities such as warranty and recall responsibilities shift risk to suppliers under standard contracts, while extended payment terms of 90–120 days strain supplier working capital.
- OTIF target: ≥95%
- PPM benchmark: <100
- Payment terms: 90–120 days
- Penalties: scorecard-linked chargebacks
OEM/Tier‑1 leverage forces price‑downs; e‑commerce ~20%, VE 3–5%
OEMs and large Tier‑1s hold strong leverage over Stoneridge, driving price-downs, dual‑sourcing and platform awards that can cut volumes/margins materially. Aftermarket price sensitivity and ~20% e‑commerce share in 2024 compress margins; value‑engineering targets ~3–5% annually. Specs, ECRs and long payment terms (90–120 days) shift costs and working capital burden to suppliers; OTIF ≥95% and PPM <100 enforce penalties.
| Metric | 2024 |
|---|---|
| e‑commerce share | ~20% |
| Value‑engineering | 3–5% pa |
| OTIF | ≥95% |
| PPM | <100 |
| Payment terms | 90–120 days |
Full Version Awaits
Stoneridge Porter's Five Forces Analysis
This preview shows the exact Stoneridge Porter's Five Forces Analysis you'll receive after purchase—no placeholders or mockups. The full document is professionally formatted, ready for download and immediate use. What you see here is the final deliverable, complete and unchanged.
Description
A Must-Have Tool for Decision-Makers
Stoneridge’s Porter's Five Forces snapshot highlights key pressures—from supplier leverage to competitive rivalry—and how they shape margins and growth potential. This brief view teases strategic risks and opportunities but omits force-by-force detail. Unlock the full Porter's Five Forces Analysis for a consultant-grade breakdown, visuals, and actionable recommendations tailored to Stoneridge.
Suppliers Bargaining Power
Chip and component concentration
Advanced semiconductors, sensors and displays are concentrated among a few vendors, with TSMC holding roughly 54% of global foundry share in 2024 and Samsung Display and LG Display dominant in automotive panels, concentrating supplier power.
Design-in lifecycles and PPAP approvals typically take 3–6 months, making supplier switches costly and time-consuming.
Lead-time volatility, averaging around 20 weeks in 2023, lets suppliers push price and allocation terms.
Long-term supply agreements mitigate but rarely eliminate dependence, often covering just over 50% of volumes.
Quality and compliance requirements
Automotive-grade standards (AEC-Q, ISO 26262, IATF 16949) sharply limit qualified suppliers, concentrating leverage among certified Tier‑1s. Requalification of alternates typically adds 6–12 months and commonly $1–3M in testing and validation, raising switching costs. Suppliers meeting these specs often command 2–5% premium on pricing and stricter payment terms. A single quality deviation can trigger line‑stop penalties often ranging tens to hundreds of thousands of dollars per hour, amplifying supplier power.
Raw material volatility
Prices for copper (around US$9,000/tonne in 2024), resins and specialty glass—which experienced 10–20% swings in 2024—plus scarce rare earths materially drive Stoneridge input costs. Suppliers typically pass surcharges through faster than OEMs can reprice contracts, compressing margins. Hedging and cost-recovery clauses in 2024 reduced volatility impact but did not eliminate exposure. Periods of scarcity decisively strengthen supplier bargaining power.
Geopolitical and capacity risks
Semiconductor geopolitics and capacity cycles amplify supplier power during shortages: Taiwan holds ≈60% of advanced foundry capacity and export controls plus policies (US CHIPS Act $52.7B; EU Chips Act €43B) force regionalization and complicate multi-sourcing. Dual- and near-shoring reduce concentration risk but raise capex and unit costs. Suppliers with diversified fabs and logistics networks gain leverage.
- Geographic concentration: Taiwan ≈60% advanced foundry share
- Policy spend: US CHIPS $52.7B; EU Chips Act €43B
- Strategic impact: regionalization eases risk but increases cost
EMS and tooling dependencies
Reliance on contract manufacturers and bespoke tooling locks Stoneridge into specific EMS supply paths, with the global EMS market exceeding USD 600 billion in 2024 and large CM partners wielding scale advantages. Tool move costs and validation commonly require 8–16 weeks and significant capital, deterring switching; volume commitments and take‑or‑pay terms shift inventory and demand risk to OEMs. Co‑development of processes with CMs deepens operational interdependence and raises exit costs.
- EMS market 2024: >USD 600 billion
- Tooling validation: 8–16 weeks
- Take‑or‑pay and volume commitments transfer demand risk
- Co‑development increases supplier lock‑in
Concentrated supply (≈54%), long lead times squeeze OEMs
Supplier power is high: advanced semiconductors and displays are concentrated (TSMC ≈54% foundry share 2024), raising switch costs.
Long lead times (~20 weeks 2023), PPAP cycles (3–6 months) and OEM requalification (6–12 months, $1–3M) lock in suppliers.
Commodity swings (copper ≈US$9,000/t 2024) and EMS scale (>US$600bn 2024) further amplify supplier leverage.
| Metric | 2024 value |
|---|---|
| TSMC foundry share | ≈54% |
| Copper | ≈US$9,000/t |
| EMS market | >US$600bn |
What is included in the product
Detailed Word Document
Concise Porter's Five Forces analysis for Stoneridge, assessing competitive rivalry, supplier and buyer power, threat of new entrants and substitutes, and identifying strategic levers to protect margins and market share.
Customizable Excel Spreadsheet
A concise one-sheet Porter's Five Forces for Stoneridge that turns complex competitive pressures into an editable spider/radar chart—easy to customize, copy into decks, integrate with Excel dashboards, and quickly relieve analysis bottlenecks for faster strategic decisions.
Customers Bargaining Power
Concentrated OEM customers
Large global OEMs and Tier 1s like Ford, GM and Stellantis exert strong negotiating leverage over Stoneridge, pressing for price-downs, open-book costing and extended warranty coverage. Platform awards are decided on cost, quality and delivery metrics, so losing a platform can materially reduce volumes and margins. Concentrated OEM exposure increases revenue volatility and compresses supplier pricing power.
High switching costs but multi-sourcing
Integration into vehicle platforms raises switching costs because validation and software integration typically add 12–24 months and multimillion-dollar engineering programs, locking suppliers into OEM architectures.
Yet OEMs commonly mandate dual sourcing to retain leverage and continuity of supply, so incumbency helps but does not guarantee renewal.
Significant performance shortfalls or 5–15% cost gaps frequently trigger competitive resourcing and requalification efforts.
Aftermarket price sensitivity
Aftermarket customers prioritize price and availability over bespoke features, driving intense online competition as e-commerce channels captured roughly 20% of parts sales by 2024. Brand and reliability still influence fleet and OEM-replacement purchases, but margins face headwinds from online marketplaces and discounting. Growth of private-label and generic alternatives further compresses pricing power. Differentiated features and superior service can partly temper customer bargaining strength.
Specification control and design authority
Buyers control specifications and push custom requirements that limit part reuse, driving engineering change orders that suppliers often must absorb; OEM value-engineering programs in 2024 commonly targeted roughly 3–5% annual cost reductions, squeezing margins and making early design influence critical to protect profitability.
- Specification control: OEMs dictate designs limiting reuse
- Change orders: ECRs/ECOs shift cost to suppliers
- Value engineering: 3–5% annual targets in 2024
- Early influence: design-in protects margins
Service level and penalty regimes
Strict delivery, quality and PPAP metrics at Stoneridge tie penalties and scorecards to supplier performance; OEMs commonly demand OTIF ≥95% and PPM <100, with failure to meet targets triggering chargebacks. Field failure liabilities such as warranty and recall responsibilities shift risk to suppliers under standard contracts, while extended payment terms of 90–120 days strain supplier working capital.
- OTIF target: ≥95%
- PPM benchmark: <100
- Payment terms: 90–120 days
- Penalties: scorecard-linked chargebacks
OEM/Tier‑1 leverage forces price‑downs; e‑commerce ~20%, VE 3–5%
OEMs and large Tier‑1s hold strong leverage over Stoneridge, driving price-downs, dual‑sourcing and platform awards that can cut volumes/margins materially. Aftermarket price sensitivity and ~20% e‑commerce share in 2024 compress margins; value‑engineering targets ~3–5% annually. Specs, ECRs and long payment terms (90–120 days) shift costs and working capital burden to suppliers; OTIF ≥95% and PPM <100 enforce penalties.
| Metric | 2024 |
|---|---|
| e‑commerce share | ~20% |
| Value‑engineering | 3–5% pa |
| OTIF | ≥95% |
| PPM | <100 |
| Payment terms | 90–120 days |
Full Version Awaits
Stoneridge Porter's Five Forces Analysis
This preview shows the exact Stoneridge Porter's Five Forces Analysis you'll receive after purchase—no placeholders or mockups. The full document is professionally formatted, ready for download and immediate use. What you see here is the final deliverable, complete and unchanged.











