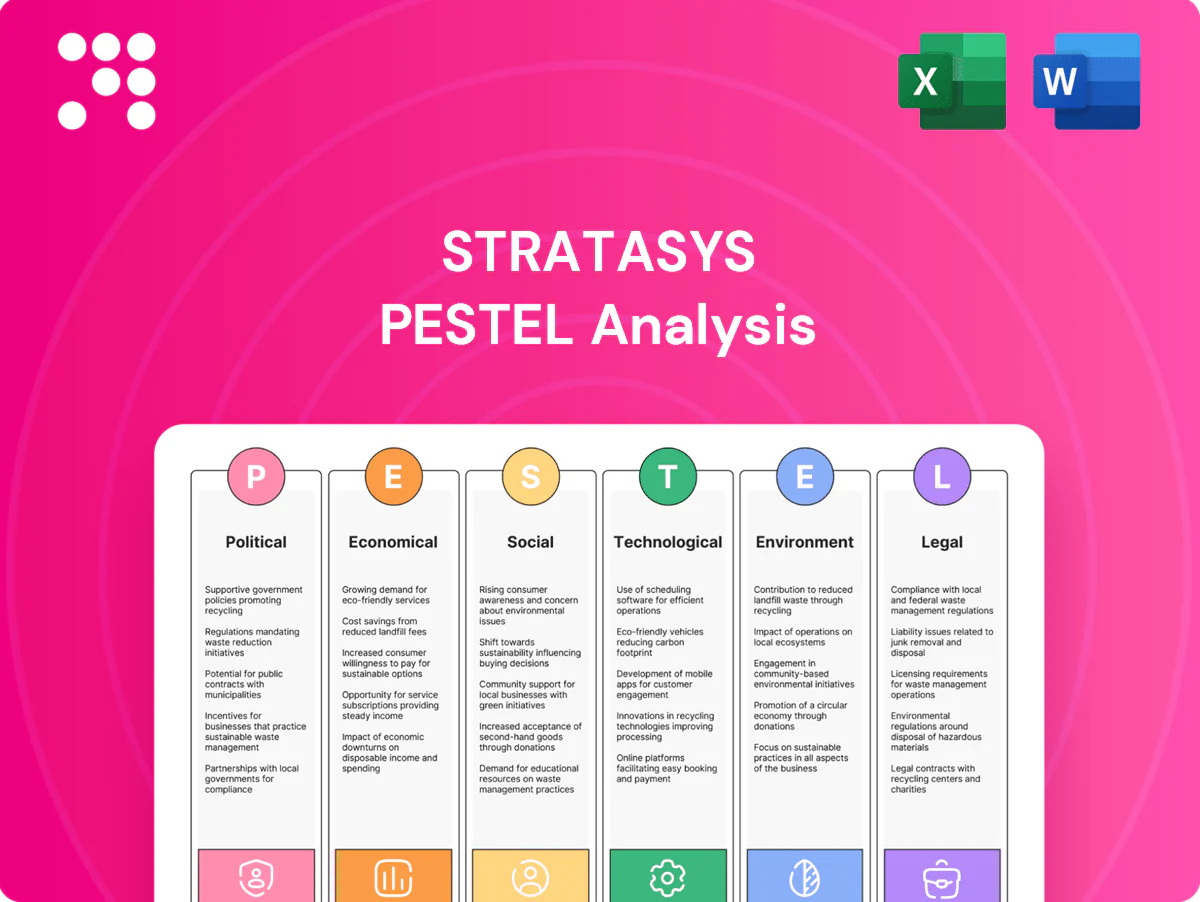
Stratasys PESTLE Analysis

Plan Smarter. Present Sharper. Compete Stronger.
Discover how political shifts, supply-chain economics, and rapid additive-manufacturing innovation are reshaping Stratasys’s strategic outlook in our concise PESTLE snapshot. This analysis highlights regulatory, environmental, and market risks alongside growth levers. Purchase the full PESTLE to access detailed, actionable insights and ready-to-use slides for investor briefings or strategy planning.
Political factors

Export controls and sanctions exposure
Additive manufacturing tools and high‑performance materials are subject to ITAR/EAR controls and OFAC sanctions, and Stratasys — which reported roughly $665m revenue in 2024 — must maintain rigorous screening and licensing to avoid multi‑million dollar penalties. Geopolitical tensions can abruptly close markets and delay deliveries, disrupting supply chains and service SLAs. Diversifying compliant channels, local service hubs and subscription models reduces exposure and shortens recovery times.
Government procurement and industrial policy
Defense, aerospace and public R&D draw on large budgets—US defense spending reached about $858 billion in 2024 and the CHIPS Act authorized $52 billion for domestic manufacturing—boosting 3D printing adoption. Winning framework agreements anchors demand and validates Stratasys technology. National reshoring and advanced manufacturing incentives steer plant locations and partnerships, while alignment with policy priorities raises visibility and access.

Tariffs and cross‑border trade frictions
Tariffs on electronics, polymers and machinery—often reaching up to 25% under measures like US Section 301—inflate Stratasys’ bill of materials and unit pricing. Customs delays, frequently adding 5–15 days to lead times, disrupt printer and material shipments and strain service SLAs. Localizing assembly or using US Foreign-Trade Zones can defer or reduce duties to effectively 0% until goods enter commerce. Strategic multi‑region sourcing and regional buffer inventories hedge trade‑policy shocks.

Standards and certification regimes
- ISO/ASTM 52900-series
- Procurement eligibility: aerospace/defence
- Standards body participation
Subsidies, grants, and tax credits
Public incentives such as the US Inflation Reduction Act (IRAs $369 billion climate package) and EU green industrial funds lower customer TCO for low‑carbon, digitalized manufacturing, making Stratasys systems more competitive; co‑selling with integrators lets Stratasys capture subsidized projects while tracking jurisdictional programs enables targeted campaigns and transparent benefit realization drives adoption in cost‑sensitive sectors.
- Global additive manufacturing market ~USD 20.1B (2024)
- IRAs $369B enables subsidized clean manufacturing
- Co‑sell with integrators to access grant-funded deals
- Track programs by jurisdiction for targeted campaigns
3D-printing leader hit by ITAR/EAR and OFAC export risks; noncompliance risks multi-million fines
Stratasys faces export controls (ITAR/EAR) and OFAC risks requiring strict licensing—noncompliance can mean multi‑million penalties; 2024 revenue ~USD 665M increases stakes. Geopolitical tensions and tariffs (up to ~25%) lengthen lead times and raise costs. Defense/aerospace budgets and reshoring incentives boost demand, while standards (ISO/ASTM 52900) determine procurement eligibility.
| Metric | Value (2024) |
|---|---|
| Stratasys revenue | ~USD 665M |
| US defense spend | ~USD 858B |
| Global AM market | ~USD 20.1B |
| IRA climate package | USD 369B |
What is included in the product
 Detailed Word Document
Explores how Political, Economic, Social, Technological, Environmental and Legal forces specifically shape Stratasys, combining data-driven trends and regulatory context to identify risks and opportunities. Designed for executives and investors, it offers forward-looking insights and ready-to-use findings for strategy, funding and scenario planning.

 Customizable Excel Spreadsheet
Provides a concise, visually segmented PESTLE summary of Stratasys to streamline strategy meetings and client reports, easily dropped into presentations or shared across teams.
Economic factors

Capital spending cycles and macro demand
Printer purchases track industrial capex and S&P Global Manufacturing PMI—with the PMI averaging about 49.8 in 2024, capex softness delayed system orders while service and consumables provided a recurring-revenue buffer for Stratasys. Sector mix—heavy exposure to aerospace, medical and automotive—boosts resilience against single-industry downturns. Flexible financing and subscription offers smooth demand swings by converting lump-sum sales into predictable cash flows.
Materials and input cost volatility
Engineering polymers and resins remain exposed to petrochemical price swings—Brent averaged about $86/bbl in 2024 and feedstock prices moved more than ±25% in 2023–24, raising input cost volatility. FX moves and elevated logistics rates have compressed margins on proprietary consumables, at times shaving several hundred basis points. Indexed pricing and hedging strategies have stabilized gross profit. Design-for-material-efficiency preserves customer ROI.

Recurring revenue from consumables and services
Installed base growth drives predictable materials and services, with Stratasys reporting roughly $1.2B revenue in FY2024 and recurring consumables/services comprising about 40% of sales, enhancing visibility. Service contracts, warranties and software subscriptions raise lifetime value and renewal rates. Uptime and SLAs directly affect reorder cadence and spare-part demand. Portfolio tiering pairs lower entry printers with high‑margin annuities to boost ARR.

Currency fluctuations and global footprint
Stratasys reports in USD but sells globally, so multi-currency sales make results sensitive to USD moves; the company mitigates this through natural hedges where local production costs and local invoicing offset currency swings. Pricing discipline and formal surcharge frameworks have been used to protect contribution margins during FX volatility. Scenario planning drives inventory positioning and cash repatriation timing.
- FX exposure: USD reporting vs global sales
- Natural hedges: local costs & invoicing
- Margins: pricing discipline + surcharges
- Liquidity: scenario-led inventory and repatriation
Industry consolidation and competitive pricing
Industry consolidation in additive manufacturing, with the global AM market at roughly 22 billion in 2024, intensifies discounting and expands channel reach as larger rivals and new entrants pressure average selling prices. Stratasys offsets ASP erosion by charging premiums for application engineering, validated materials and certified workflows that drive higher lifetime value. Selective M&A remains a tactical lever to fill technology or regional gaps and defend margin.
- Market size: ~22B (2024)
- Pressure: larger rivals/new entrants compress ASPs
- Defense: application engineering + validated materials = premium
- M&A: targeted to close tech/regional gaps
3D-printing leader hit by ITAR/EAR and OFAC export risks; noncompliance risks multi-million fines
Industrial capex weakness (S&P Global PMI ~49.8 in 2024) slowed system orders while recurring consumables/services (~40% of FY2024 revenue of ~$1.2B) stabilized cash flow. Brent averaged ~$86/bbl in 2024, creating feedstock cost volatility; pricing surcharges and hedges limited margin erosion. Global AM market ~ $22B (2024) raises ASP pressure; Stratasys offsets with premium materials, service and selective M&A.
| Metric | 2024 |
|---|---|
| Revenue (FY) | $1.2B |
| Consumables/Services | ~40% |
| Brent | $86/bbl avg |
| Global AM market | $22B |
Full Version Awaits
Stratasys PESTLE Analysis
This Stratasys PESTLE Analysis examines political, economic, social, technological, legal, and environmental factors affecting the company and offers concise, actionable insights for investors and strategists. The content is fully formatted with charts and summaries for immediate use. The preview shown here is the exact document you’ll receive after purchase—no surprises.

Plan Smarter. Present Sharper. Compete Stronger.
Discover how political shifts, supply-chain economics, and rapid additive-manufacturing innovation are reshaping Stratasys’s strategic outlook in our concise PESTLE snapshot. This analysis highlights regulatory, environmental, and market risks alongside growth levers. Purchase the full PESTLE to access detailed, actionable insights and ready-to-use slides for investor briefings or strategy planning.
Political factors
Export controls and sanctions exposure
Additive manufacturing tools and high‑performance materials are subject to ITAR/EAR controls and OFAC sanctions, and Stratasys — which reported roughly $665m revenue in 2024 — must maintain rigorous screening and licensing to avoid multi‑million dollar penalties. Geopolitical tensions can abruptly close markets and delay deliveries, disrupting supply chains and service SLAs. Diversifying compliant channels, local service hubs and subscription models reduces exposure and shortens recovery times.
Government procurement and industrial policy
Defense, aerospace and public R&D draw on large budgets—US defense spending reached about $858 billion in 2024 and the CHIPS Act authorized $52 billion for domestic manufacturing—boosting 3D printing adoption. Winning framework agreements anchors demand and validates Stratasys technology. National reshoring and advanced manufacturing incentives steer plant locations and partnerships, while alignment with policy priorities raises visibility and access.
Tariffs and cross‑border trade frictions
Tariffs on electronics, polymers and machinery—often reaching up to 25% under measures like US Section 301—inflate Stratasys’ bill of materials and unit pricing. Customs delays, frequently adding 5–15 days to lead times, disrupt printer and material shipments and strain service SLAs. Localizing assembly or using US Foreign-Trade Zones can defer or reduce duties to effectively 0% until goods enter commerce. Strategic multi‑region sourcing and regional buffer inventories hedge trade‑policy shocks.
Standards and certification regimes
- ISO/ASTM 52900-series
- Procurement eligibility: aerospace/defence
- Standards body participation
Subsidies, grants, and tax credits
Public incentives such as the US Inflation Reduction Act (IRAs $369 billion climate package) and EU green industrial funds lower customer TCO for low‑carbon, digitalized manufacturing, making Stratasys systems more competitive; co‑selling with integrators lets Stratasys capture subsidized projects while tracking jurisdictional programs enables targeted campaigns and transparent benefit realization drives adoption in cost‑sensitive sectors.
- Global additive manufacturing market ~USD 20.1B (2024)
- IRAs $369B enables subsidized clean manufacturing
- Co‑sell with integrators to access grant-funded deals
- Track programs by jurisdiction for targeted campaigns
3D-printing leader hit by ITAR/EAR and OFAC export risks; noncompliance risks multi-million fines
Stratasys faces export controls (ITAR/EAR) and OFAC risks requiring strict licensing—noncompliance can mean multi‑million penalties; 2024 revenue ~USD 665M increases stakes. Geopolitical tensions and tariffs (up to ~25%) lengthen lead times and raise costs. Defense/aerospace budgets and reshoring incentives boost demand, while standards (ISO/ASTM 52900) determine procurement eligibility.
| Metric | Value (2024) |
|---|---|
| Stratasys revenue | ~USD 665M |
| US defense spend | ~USD 858B |
| Global AM market | ~USD 20.1B |
| IRA climate package | USD 369B |
What is included in the product
Detailed Word Document
Explores how Political, Economic, Social, Technological, Environmental and Legal forces specifically shape Stratasys, combining data-driven trends and regulatory context to identify risks and opportunities. Designed for executives and investors, it offers forward-looking insights and ready-to-use findings for strategy, funding and scenario planning.
Customizable Excel Spreadsheet
Provides a concise, visually segmented PESTLE summary of Stratasys to streamline strategy meetings and client reports, easily dropped into presentations or shared across teams.
Economic factors
Capital spending cycles and macro demand
Printer purchases track industrial capex and S&P Global Manufacturing PMI—with the PMI averaging about 49.8 in 2024, capex softness delayed system orders while service and consumables provided a recurring-revenue buffer for Stratasys. Sector mix—heavy exposure to aerospace, medical and automotive—boosts resilience against single-industry downturns. Flexible financing and subscription offers smooth demand swings by converting lump-sum sales into predictable cash flows.
Materials and input cost volatility
Engineering polymers and resins remain exposed to petrochemical price swings—Brent averaged about $86/bbl in 2024 and feedstock prices moved more than ±25% in 2023–24, raising input cost volatility. FX moves and elevated logistics rates have compressed margins on proprietary consumables, at times shaving several hundred basis points. Indexed pricing and hedging strategies have stabilized gross profit. Design-for-material-efficiency preserves customer ROI.
Recurring revenue from consumables and services
Installed base growth drives predictable materials and services, with Stratasys reporting roughly $1.2B revenue in FY2024 and recurring consumables/services comprising about 40% of sales, enhancing visibility. Service contracts, warranties and software subscriptions raise lifetime value and renewal rates. Uptime and SLAs directly affect reorder cadence and spare-part demand. Portfolio tiering pairs lower entry printers with high‑margin annuities to boost ARR.
Currency fluctuations and global footprint
Stratasys reports in USD but sells globally, so multi-currency sales make results sensitive to USD moves; the company mitigates this through natural hedges where local production costs and local invoicing offset currency swings. Pricing discipline and formal surcharge frameworks have been used to protect contribution margins during FX volatility. Scenario planning drives inventory positioning and cash repatriation timing.
- FX exposure: USD reporting vs global sales
- Natural hedges: local costs & invoicing
- Margins: pricing discipline + surcharges
- Liquidity: scenario-led inventory and repatriation
Industry consolidation and competitive pricing
Industry consolidation in additive manufacturing, with the global AM market at roughly 22 billion in 2024, intensifies discounting and expands channel reach as larger rivals and new entrants pressure average selling prices. Stratasys offsets ASP erosion by charging premiums for application engineering, validated materials and certified workflows that drive higher lifetime value. Selective M&A remains a tactical lever to fill technology or regional gaps and defend margin.
- Market size: ~22B (2024)
- Pressure: larger rivals/new entrants compress ASPs
- Defense: application engineering + validated materials = premium
- M&A: targeted to close tech/regional gaps
3D-printing leader hit by ITAR/EAR and OFAC export risks; noncompliance risks multi-million fines
Industrial capex weakness (S&P Global PMI ~49.8 in 2024) slowed system orders while recurring consumables/services (~40% of FY2024 revenue of ~$1.2B) stabilized cash flow. Brent averaged ~$86/bbl in 2024, creating feedstock cost volatility; pricing surcharges and hedges limited margin erosion. Global AM market ~ $22B (2024) raises ASP pressure; Stratasys offsets with premium materials, service and selective M&A.
| Metric | 2024 |
|---|---|
| Revenue (FY) | $1.2B |
| Consumables/Services | ~40% |
| Brent | $86/bbl avg |
| Global AM market | $22B |
Full Version Awaits
Stratasys PESTLE Analysis
This Stratasys PESTLE Analysis examines political, economic, social, technological, legal, and environmental factors affecting the company and offers concise, actionable insights for investors and strategists. The content is fully formatted with charts and summaries for immediate use. The preview shown here is the exact document you’ll receive after purchase—no surprises.
Original: $10.00
-65%$10.00
$3.50Description
Plan Smarter. Present Sharper. Compete Stronger.
Discover how political shifts, supply-chain economics, and rapid additive-manufacturing innovation are reshaping Stratasys’s strategic outlook in our concise PESTLE snapshot. This analysis highlights regulatory, environmental, and market risks alongside growth levers. Purchase the full PESTLE to access detailed, actionable insights and ready-to-use slides for investor briefings or strategy planning.
Political factors
Export controls and sanctions exposure
Additive manufacturing tools and high‑performance materials are subject to ITAR/EAR controls and OFAC sanctions, and Stratasys — which reported roughly $665m revenue in 2024 — must maintain rigorous screening and licensing to avoid multi‑million dollar penalties. Geopolitical tensions can abruptly close markets and delay deliveries, disrupting supply chains and service SLAs. Diversifying compliant channels, local service hubs and subscription models reduces exposure and shortens recovery times.
Government procurement and industrial policy
Defense, aerospace and public R&D draw on large budgets—US defense spending reached about $858 billion in 2024 and the CHIPS Act authorized $52 billion for domestic manufacturing—boosting 3D printing adoption. Winning framework agreements anchors demand and validates Stratasys technology. National reshoring and advanced manufacturing incentives steer plant locations and partnerships, while alignment with policy priorities raises visibility and access.
Tariffs and cross‑border trade frictions
Tariffs on electronics, polymers and machinery—often reaching up to 25% under measures like US Section 301—inflate Stratasys’ bill of materials and unit pricing. Customs delays, frequently adding 5–15 days to lead times, disrupt printer and material shipments and strain service SLAs. Localizing assembly or using US Foreign-Trade Zones can defer or reduce duties to effectively 0% until goods enter commerce. Strategic multi‑region sourcing and regional buffer inventories hedge trade‑policy shocks.
Standards and certification regimes
- ISO/ASTM 52900-series
- Procurement eligibility: aerospace/defence
- Standards body participation
Subsidies, grants, and tax credits
Public incentives such as the US Inflation Reduction Act (IRAs $369 billion climate package) and EU green industrial funds lower customer TCO for low‑carbon, digitalized manufacturing, making Stratasys systems more competitive; co‑selling with integrators lets Stratasys capture subsidized projects while tracking jurisdictional programs enables targeted campaigns and transparent benefit realization drives adoption in cost‑sensitive sectors.
- Global additive manufacturing market ~USD 20.1B (2024)
- IRAs $369B enables subsidized clean manufacturing
- Co‑sell with integrators to access grant-funded deals
- Track programs by jurisdiction for targeted campaigns
3D-printing leader hit by ITAR/EAR and OFAC export risks; noncompliance risks multi-million fines
Stratasys faces export controls (ITAR/EAR) and OFAC risks requiring strict licensing—noncompliance can mean multi‑million penalties; 2024 revenue ~USD 665M increases stakes. Geopolitical tensions and tariffs (up to ~25%) lengthen lead times and raise costs. Defense/aerospace budgets and reshoring incentives boost demand, while standards (ISO/ASTM 52900) determine procurement eligibility.
| Metric | Value (2024) |
|---|---|
| Stratasys revenue | ~USD 665M |
| US defense spend | ~USD 858B |
| Global AM market | ~USD 20.1B |
| IRA climate package | USD 369B |
What is included in the product
Detailed Word Document
Explores how Political, Economic, Social, Technological, Environmental and Legal forces specifically shape Stratasys, combining data-driven trends and regulatory context to identify risks and opportunities. Designed for executives and investors, it offers forward-looking insights and ready-to-use findings for strategy, funding and scenario planning.
Customizable Excel Spreadsheet
Provides a concise, visually segmented PESTLE summary of Stratasys to streamline strategy meetings and client reports, easily dropped into presentations or shared across teams.
Economic factors
Capital spending cycles and macro demand
Printer purchases track industrial capex and S&P Global Manufacturing PMI—with the PMI averaging about 49.8 in 2024, capex softness delayed system orders while service and consumables provided a recurring-revenue buffer for Stratasys. Sector mix—heavy exposure to aerospace, medical and automotive—boosts resilience against single-industry downturns. Flexible financing and subscription offers smooth demand swings by converting lump-sum sales into predictable cash flows.
Materials and input cost volatility
Engineering polymers and resins remain exposed to petrochemical price swings—Brent averaged about $86/bbl in 2024 and feedstock prices moved more than ±25% in 2023–24, raising input cost volatility. FX moves and elevated logistics rates have compressed margins on proprietary consumables, at times shaving several hundred basis points. Indexed pricing and hedging strategies have stabilized gross profit. Design-for-material-efficiency preserves customer ROI.
Recurring revenue from consumables and services
Installed base growth drives predictable materials and services, with Stratasys reporting roughly $1.2B revenue in FY2024 and recurring consumables/services comprising about 40% of sales, enhancing visibility. Service contracts, warranties and software subscriptions raise lifetime value and renewal rates. Uptime and SLAs directly affect reorder cadence and spare-part demand. Portfolio tiering pairs lower entry printers with high‑margin annuities to boost ARR.
Currency fluctuations and global footprint
Stratasys reports in USD but sells globally, so multi-currency sales make results sensitive to USD moves; the company mitigates this through natural hedges where local production costs and local invoicing offset currency swings. Pricing discipline and formal surcharge frameworks have been used to protect contribution margins during FX volatility. Scenario planning drives inventory positioning and cash repatriation timing.
- FX exposure: USD reporting vs global sales
- Natural hedges: local costs & invoicing
- Margins: pricing discipline + surcharges
- Liquidity: scenario-led inventory and repatriation
Industry consolidation and competitive pricing
Industry consolidation in additive manufacturing, with the global AM market at roughly 22 billion in 2024, intensifies discounting and expands channel reach as larger rivals and new entrants pressure average selling prices. Stratasys offsets ASP erosion by charging premiums for application engineering, validated materials and certified workflows that drive higher lifetime value. Selective M&A remains a tactical lever to fill technology or regional gaps and defend margin.
- Market size: ~22B (2024)
- Pressure: larger rivals/new entrants compress ASPs
- Defense: application engineering + validated materials = premium
- M&A: targeted to close tech/regional gaps
3D-printing leader hit by ITAR/EAR and OFAC export risks; noncompliance risks multi-million fines
Industrial capex weakness (S&P Global PMI ~49.8 in 2024) slowed system orders while recurring consumables/services (~40% of FY2024 revenue of ~$1.2B) stabilized cash flow. Brent averaged ~$86/bbl in 2024, creating feedstock cost volatility; pricing surcharges and hedges limited margin erosion. Global AM market ~ $22B (2024) raises ASP pressure; Stratasys offsets with premium materials, service and selective M&A.
| Metric | 2024 |
|---|---|
| Revenue (FY) | $1.2B |
| Consumables/Services | ~40% |
| Brent | $86/bbl avg |
| Global AM market | $22B |
Full Version Awaits
Stratasys PESTLE Analysis
This Stratasys PESTLE Analysis examines political, economic, social, technological, legal, and environmental factors affecting the company and offers concise, actionable insights for investors and strategists. The content is fully formatted with charts and summaries for immediate use. The preview shown here is the exact document you’ll receive after purchase—no surprises.











