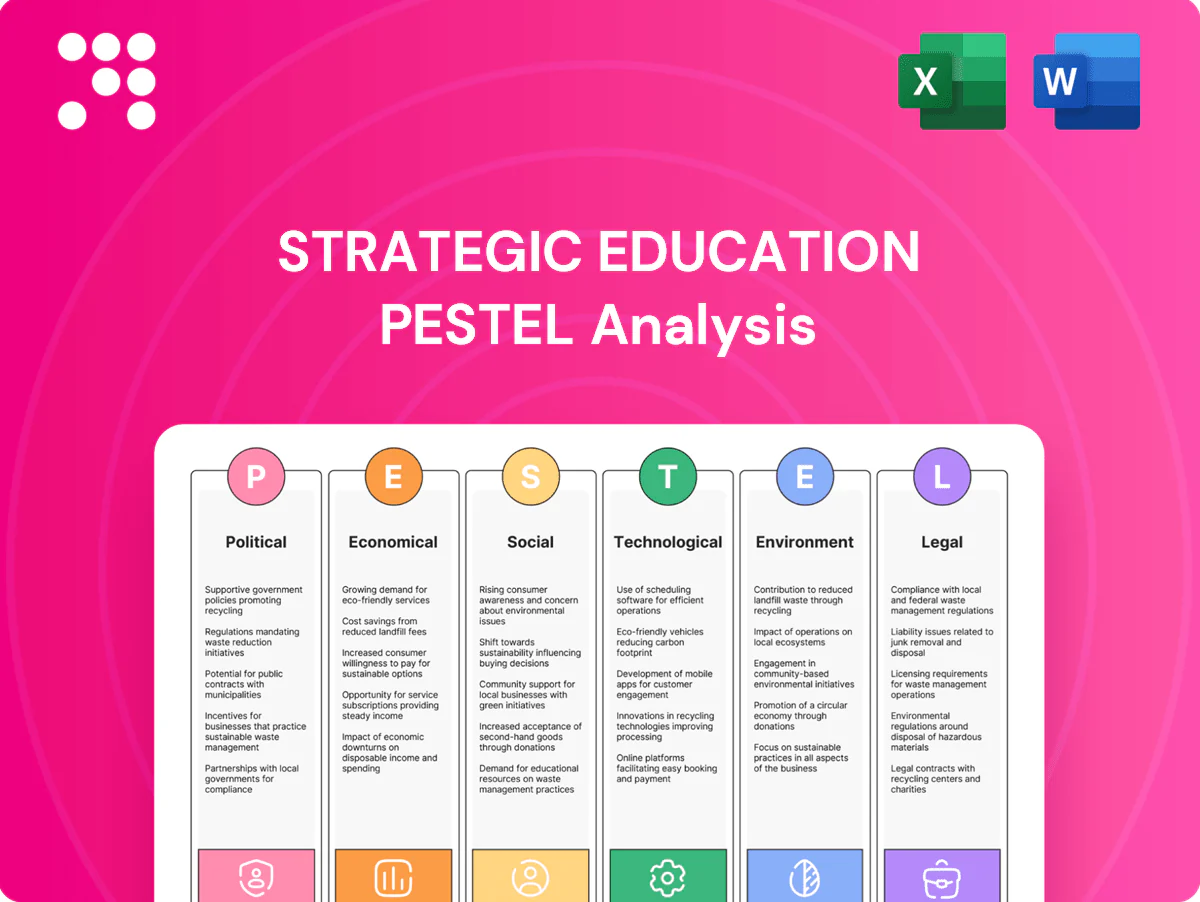
Strategic Education PESTLE Analysis

Skip the Research. Get the Strategy.
Unlock how political shifts, economic trends, and tech disruption shape Strategic Education’s outlook with our concise PESTLE briefing—ideal for investors and strategists seeking edge. Purchase the full PESTLE now for a complete, actionable breakdown and ready-to-use insights.
Political factors

Federal funding dynamics
Changes to Pell (maximum $7,395 for 2023–24) and Title IV rule edits directly affect affordability for roughly 5.8 million Pell recipients and reshape demand for workforce grants and partner programs. Congressional shifts—especially in FY2024–25 appropriations and continuing resolutions—can expand or restrict aid eligibility for online and short-cycle credentials. Strategic Education must align curricula to funding-eligible pathways to sustain enrollment volume and model multiple appropriations scenarios.
Regulatory stance on OPMs
Policy scrutiny of OPM contracts is pressuring revenue-share models (commonly 30–60% of tuition) and marketing limits, with the OPM market ~6 billion USD in 2024. U.S. Department of Education guidance and possible bans on incentive compensation can materially reshape program economics, forcing transparent disclosures and pivots to fee-for-service. Close monitoring of 2024–25 negotiated rulemaking reduces compliance risk.

Australia/NZ higher-ed policy
Commonwealth-supported places subsidise the majority of Australian domestic undergrad enrolments and fee caps constrain tuition pricing, while federal skills initiatives (AU$1.7bn pledged for vocational/micro‑credential growth in 2023) are driving demand for accredited short courses; New Zealand’s international education exports (~NZ$4.9bn in 2023) and tightened post‑pandemic immigration settings are reshaping learner flows; Strategic Education must localize offerings to policy priorities and engage government skills agendas to unlock partnerships.

State authorization and interstate compacts
Variations in U.S. state oversight of distance education create uneven market access for institutions; NC-SARA participation (2,000+ institutions, ~2.5M students) eases multi-state delivery but remains subject to policy debates that could alter scope. Maintaining state compliance preserves uninterrupted enrollment pipelines, and targeted advocacy can protect interstate reciprocity benefits.
- Market access: state-by-state rules
- NC-SARA: 2,000+ institutions, ~2.5M students
- Priority: compliance + advocacy to retain reciprocity
Workforce and employer policy incentives
Tax credits and public-private upskilling initiatives are increasing corporate demand for non-degree training, while bipartisan momentum around apprenticeships and short-term Pell pilots has elevated policy support for stackable credentials.
Strategic Education can partner with workforce boards and employer-funded programs to capture employer-paid tuition pathways and contract training revenue, hedging against cyclical declines in traditional academic enrollment.
- policy-aligned partnerships
- employer-funded programs
- apprenticeships & short-term Pell
- revenue diversification
Pell changes reshape workforce demand; OPM margins squeeze — localize for NC-SARA and AU funding
Federal Pell changes (max $7,395 for 2023–24) affect ~5.8M recipients and reshape demand for workforce grants. OPM market ~6bn USD (2024) and scrutiny of revenue-share (30–60%) threaten margins and push fee-for-service pivots. NC-SARA (2,000+ institutions, ~2.5M students) and AU skills funding (AU$1.7bn, 2023) require localized, compliance-aligned offerings.
| Item | Metric | Implication |
|---|---|---|
| Pell | $7,395; 5.8M students | Align to aid-eligible pathways |
| OPM | ~$6bn; 30–60% rev-share | Model fee-for-service |
| NC-SARA | 2,000+ inst; ~2.5M | Maintain state compliance |
| AU/NZ | AU$1.7bn; NZ$4.9bn | Localize offerings |
What is included in the product
 Detailed Word Document
Explores how macro-environmental forces uniquely affect Strategic Education across Political, Economic, Social, Technological, Environmental, and Legal dimensions, with data-backed trends and sector-specific subpoints. Designed to equip executives and investors with forward-looking insights for risk mitigation and opportunity capture.

 Customizable Excel Spreadsheet
A concise, visually segmented PESTLE summary for Strategic Education that’s editable and shareable—ideal for quick inclusion in presentations, team alignment, and consultants’ client reports to streamline risk discussions and strategic planning.
Economic factors

Enrollment sensitivity to cycles
Enrollment is cyclical: labor-market tightness (unemployment near 3.7% in 2024) suppresses traditional degree enrollments while downturns spike reskilling demand, as seen in 2020–21 nondegree growth. Elasticity varies by program length and price, with short, low-cost credentials showing higher responsiveness. Offering flexible, job-aligned programs smooths cyclicality and diversifying across degree and nondegree lines reduces revenue volatility.
Tuition pricing and value
Price-to-outcome pressure intensifies amid rising student debt concerns—U.S. outstanding student loan debt reached about $1.7 trillion in 2024. Clear ROI, employer recognition and placement outcomes drive willingness to pay, especially for industry-aligned credentials. Bundling support services and stackable credentials enhances perceived value and completion. Transparent pricing improves conversion and retention.

Cost structure and scale
As of 2024, digital delivery gives Strategic Education clear operating leverage as cohorts scale, lowering incremental cost per learner. Content development and learner support remain major fixed and semi-variable expenses. Automation and shared U.S./ANZ services have lifted margins in recent reports. Vigilant CAC control in competitive channels preserves unit economics.

FX and cross-border exposure
Australia/NZ revenues introduce AUD/NZD translation risk — AUD moved ~8% vs USD and NZD ~6% in the 12 months to July 2025, creating measurable P&L swings; disciplined hedging programs (commonly 60–80% of forecast cashflows) and local cost matching materially reduce volatility. Pricing corridors must be adjusted for currency shifts and local inflation (Australia ~4.0%, New Zealand ~4.4% in 2024). Clear FX reporting helps investors isolate true operating trends.
- FX exposure: AUD ±8% (12m to Jul 2025), NZD ±6%
- Hedge coverage: 60–80% typical
- Inflation: AUS 4.0% (2024), NZ 4.4% (2024)
- Action: transparent FX reporting, dynamic pricing corridors
Capital access and interest rates
Higher rates raise hurdle returns and depress valuation multiples; US federal funds were 5.25–5.50% in July 2025, tightening cost of capital and pressuring students using private financing while federal loans remain comparatively cheaper. Strong cash generation and low leverage preserve strategic flexibility, and selective M&A can be attractive as competitors retrench.
- Higher hurdle: valuation multiples compress
- Student pressure: private financing costs increase
- Balance-sheet: cash-rich, low-leverage firms gain optionality
- M&A: opportunistic deals as rivals pull back
Pell changes reshape workforce demand; OPM margins squeeze — localize for NC-SARA and AU funding
Economic factors: enrollment cycles track labor markets (U.S. unemployment ~3.7% in 2024) while downturns boost reskilling; price-to-outcome pressure is high with U.S. student debt ~1.7T (2024). Digital scale lowers incremental costs but fixed content/support remain material; FX and inflation (AUD ±8% 12m to Jul 2025; NZD ±6%; AUS inf 4.0%, NZ 4.4% 2024) add P&L volatility; higher rates (fed funds 5.25–5.50% Jul 2025) compress multiples.
| Metric | Value |
|---|---|
| U.S. unemployment | 3.7% (2024) |
| Student debt | $1.7T (2024) |
| Fed funds | 5.25–5.50% (Jul 2025) |
| AUD/NZD moves | AUD ±8%, NZD ±6% (12m to Jul 2025) |
| Inflation AUS/NZ | 4.0% / 4.4% (2024) |
| Hedge coverage | 60–80% typical |
Preview the Actual Deliverable
Strategic Education PESTLE Analysis
The preview shown here is the exact document you’ll receive after purchase—fully formatted and ready to use. It presents a comprehensive PESTLE analysis of Strategic Education covering political, economic, social, technological, legal, and environmental factors to inform strategic decisions. No placeholders or teasers—what you see is the final file you’ll download immediately after buying.

Skip the Research. Get the Strategy.
Unlock how political shifts, economic trends, and tech disruption shape Strategic Education’s outlook with our concise PESTLE briefing—ideal for investors and strategists seeking edge. Purchase the full PESTLE now for a complete, actionable breakdown and ready-to-use insights.
Political factors
Federal funding dynamics
Changes to Pell (maximum $7,395 for 2023–24) and Title IV rule edits directly affect affordability for roughly 5.8 million Pell recipients and reshape demand for workforce grants and partner programs. Congressional shifts—especially in FY2024–25 appropriations and continuing resolutions—can expand or restrict aid eligibility for online and short-cycle credentials. Strategic Education must align curricula to funding-eligible pathways to sustain enrollment volume and model multiple appropriations scenarios.
Regulatory stance on OPMs
Policy scrutiny of OPM contracts is pressuring revenue-share models (commonly 30–60% of tuition) and marketing limits, with the OPM market ~6 billion USD in 2024. U.S. Department of Education guidance and possible bans on incentive compensation can materially reshape program economics, forcing transparent disclosures and pivots to fee-for-service. Close monitoring of 2024–25 negotiated rulemaking reduces compliance risk.
Australia/NZ higher-ed policy
Commonwealth-supported places subsidise the majority of Australian domestic undergrad enrolments and fee caps constrain tuition pricing, while federal skills initiatives (AU$1.7bn pledged for vocational/micro‑credential growth in 2023) are driving demand for accredited short courses; New Zealand’s international education exports (~NZ$4.9bn in 2023) and tightened post‑pandemic immigration settings are reshaping learner flows; Strategic Education must localize offerings to policy priorities and engage government skills agendas to unlock partnerships.
State authorization and interstate compacts
Variations in U.S. state oversight of distance education create uneven market access for institutions; NC-SARA participation (2,000+ institutions, ~2.5M students) eases multi-state delivery but remains subject to policy debates that could alter scope. Maintaining state compliance preserves uninterrupted enrollment pipelines, and targeted advocacy can protect interstate reciprocity benefits.
- Market access: state-by-state rules
- NC-SARA: 2,000+ institutions, ~2.5M students
- Priority: compliance + advocacy to retain reciprocity
Workforce and employer policy incentives
Tax credits and public-private upskilling initiatives are increasing corporate demand for non-degree training, while bipartisan momentum around apprenticeships and short-term Pell pilots has elevated policy support for stackable credentials.
Strategic Education can partner with workforce boards and employer-funded programs to capture employer-paid tuition pathways and contract training revenue, hedging against cyclical declines in traditional academic enrollment.
- policy-aligned partnerships
- employer-funded programs
- apprenticeships & short-term Pell
- revenue diversification
Pell changes reshape workforce demand; OPM margins squeeze — localize for NC-SARA and AU funding
Federal Pell changes (max $7,395 for 2023–24) affect ~5.8M recipients and reshape demand for workforce grants. OPM market ~6bn USD (2024) and scrutiny of revenue-share (30–60%) threaten margins and push fee-for-service pivots. NC-SARA (2,000+ institutions, ~2.5M students) and AU skills funding (AU$1.7bn, 2023) require localized, compliance-aligned offerings.
| Item | Metric | Implication |
|---|---|---|
| Pell | $7,395; 5.8M students | Align to aid-eligible pathways |
| OPM | ~$6bn; 30–60% rev-share | Model fee-for-service |
| NC-SARA | 2,000+ inst; ~2.5M | Maintain state compliance |
| AU/NZ | AU$1.7bn; NZ$4.9bn | Localize offerings |
What is included in the product
Detailed Word Document
Explores how macro-environmental forces uniquely affect Strategic Education across Political, Economic, Social, Technological, Environmental, and Legal dimensions, with data-backed trends and sector-specific subpoints. Designed to equip executives and investors with forward-looking insights for risk mitigation and opportunity capture.
Customizable Excel Spreadsheet
A concise, visually segmented PESTLE summary for Strategic Education that’s editable and shareable—ideal for quick inclusion in presentations, team alignment, and consultants’ client reports to streamline risk discussions and strategic planning.
Economic factors
Enrollment sensitivity to cycles
Enrollment is cyclical: labor-market tightness (unemployment near 3.7% in 2024) suppresses traditional degree enrollments while downturns spike reskilling demand, as seen in 2020–21 nondegree growth. Elasticity varies by program length and price, with short, low-cost credentials showing higher responsiveness. Offering flexible, job-aligned programs smooths cyclicality and diversifying across degree and nondegree lines reduces revenue volatility.
Tuition pricing and value
Price-to-outcome pressure intensifies amid rising student debt concerns—U.S. outstanding student loan debt reached about $1.7 trillion in 2024. Clear ROI, employer recognition and placement outcomes drive willingness to pay, especially for industry-aligned credentials. Bundling support services and stackable credentials enhances perceived value and completion. Transparent pricing improves conversion and retention.
Cost structure and scale
As of 2024, digital delivery gives Strategic Education clear operating leverage as cohorts scale, lowering incremental cost per learner. Content development and learner support remain major fixed and semi-variable expenses. Automation and shared U.S./ANZ services have lifted margins in recent reports. Vigilant CAC control in competitive channels preserves unit economics.
FX and cross-border exposure
Australia/NZ revenues introduce AUD/NZD translation risk — AUD moved ~8% vs USD and NZD ~6% in the 12 months to July 2025, creating measurable P&L swings; disciplined hedging programs (commonly 60–80% of forecast cashflows) and local cost matching materially reduce volatility. Pricing corridors must be adjusted for currency shifts and local inflation (Australia ~4.0%, New Zealand ~4.4% in 2024). Clear FX reporting helps investors isolate true operating trends.
- FX exposure: AUD ±8% (12m to Jul 2025), NZD ±6%
- Hedge coverage: 60–80% typical
- Inflation: AUS 4.0% (2024), NZ 4.4% (2024)
- Action: transparent FX reporting, dynamic pricing corridors
Capital access and interest rates
Higher rates raise hurdle returns and depress valuation multiples; US federal funds were 5.25–5.50% in July 2025, tightening cost of capital and pressuring students using private financing while federal loans remain comparatively cheaper. Strong cash generation and low leverage preserve strategic flexibility, and selective M&A can be attractive as competitors retrench.
- Higher hurdle: valuation multiples compress
- Student pressure: private financing costs increase
- Balance-sheet: cash-rich, low-leverage firms gain optionality
- M&A: opportunistic deals as rivals pull back
Pell changes reshape workforce demand; OPM margins squeeze — localize for NC-SARA and AU funding
Economic factors: enrollment cycles track labor markets (U.S. unemployment ~3.7% in 2024) while downturns boost reskilling; price-to-outcome pressure is high with U.S. student debt ~1.7T (2024). Digital scale lowers incremental costs but fixed content/support remain material; FX and inflation (AUD ±8% 12m to Jul 2025; NZD ±6%; AUS inf 4.0%, NZ 4.4% 2024) add P&L volatility; higher rates (fed funds 5.25–5.50% Jul 2025) compress multiples.
| Metric | Value |
|---|---|
| U.S. unemployment | 3.7% (2024) |
| Student debt | $1.7T (2024) |
| Fed funds | 5.25–5.50% (Jul 2025) |
| AUD/NZD moves | AUD ±8%, NZD ±6% (12m to Jul 2025) |
| Inflation AUS/NZ | 4.0% / 4.4% (2024) |
| Hedge coverage | 60–80% typical |
Preview the Actual Deliverable
Strategic Education PESTLE Analysis
The preview shown here is the exact document you’ll receive after purchase—fully formatted and ready to use. It presents a comprehensive PESTLE analysis of Strategic Education covering political, economic, social, technological, legal, and environmental factors to inform strategic decisions. No placeholders or teasers—what you see is the final file you’ll download immediately after buying.
Description
Skip the Research. Get the Strategy.
Unlock how political shifts, economic trends, and tech disruption shape Strategic Education’s outlook with our concise PESTLE briefing—ideal for investors and strategists seeking edge. Purchase the full PESTLE now for a complete, actionable breakdown and ready-to-use insights.
Political factors
Federal funding dynamics
Changes to Pell (maximum $7,395 for 2023–24) and Title IV rule edits directly affect affordability for roughly 5.8 million Pell recipients and reshape demand for workforce grants and partner programs. Congressional shifts—especially in FY2024–25 appropriations and continuing resolutions—can expand or restrict aid eligibility for online and short-cycle credentials. Strategic Education must align curricula to funding-eligible pathways to sustain enrollment volume and model multiple appropriations scenarios.
Regulatory stance on OPMs
Policy scrutiny of OPM contracts is pressuring revenue-share models (commonly 30–60% of tuition) and marketing limits, with the OPM market ~6 billion USD in 2024. U.S. Department of Education guidance and possible bans on incentive compensation can materially reshape program economics, forcing transparent disclosures and pivots to fee-for-service. Close monitoring of 2024–25 negotiated rulemaking reduces compliance risk.
Australia/NZ higher-ed policy
Commonwealth-supported places subsidise the majority of Australian domestic undergrad enrolments and fee caps constrain tuition pricing, while federal skills initiatives (AU$1.7bn pledged for vocational/micro‑credential growth in 2023) are driving demand for accredited short courses; New Zealand’s international education exports (~NZ$4.9bn in 2023) and tightened post‑pandemic immigration settings are reshaping learner flows; Strategic Education must localize offerings to policy priorities and engage government skills agendas to unlock partnerships.
State authorization and interstate compacts
Variations in U.S. state oversight of distance education create uneven market access for institutions; NC-SARA participation (2,000+ institutions, ~2.5M students) eases multi-state delivery but remains subject to policy debates that could alter scope. Maintaining state compliance preserves uninterrupted enrollment pipelines, and targeted advocacy can protect interstate reciprocity benefits.
- Market access: state-by-state rules
- NC-SARA: 2,000+ institutions, ~2.5M students
- Priority: compliance + advocacy to retain reciprocity
Workforce and employer policy incentives
Tax credits and public-private upskilling initiatives are increasing corporate demand for non-degree training, while bipartisan momentum around apprenticeships and short-term Pell pilots has elevated policy support for stackable credentials.
Strategic Education can partner with workforce boards and employer-funded programs to capture employer-paid tuition pathways and contract training revenue, hedging against cyclical declines in traditional academic enrollment.
- policy-aligned partnerships
- employer-funded programs
- apprenticeships & short-term Pell
- revenue diversification
Pell changes reshape workforce demand; OPM margins squeeze — localize for NC-SARA and AU funding
Federal Pell changes (max $7,395 for 2023–24) affect ~5.8M recipients and reshape demand for workforce grants. OPM market ~6bn USD (2024) and scrutiny of revenue-share (30–60%) threaten margins and push fee-for-service pivots. NC-SARA (2,000+ institutions, ~2.5M students) and AU skills funding (AU$1.7bn, 2023) require localized, compliance-aligned offerings.
| Item | Metric | Implication |
|---|---|---|
| Pell | $7,395; 5.8M students | Align to aid-eligible pathways |
| OPM | ~$6bn; 30–60% rev-share | Model fee-for-service |
| NC-SARA | 2,000+ inst; ~2.5M | Maintain state compliance |
| AU/NZ | AU$1.7bn; NZ$4.9bn | Localize offerings |
What is included in the product
Detailed Word Document
Explores how macro-environmental forces uniquely affect Strategic Education across Political, Economic, Social, Technological, Environmental, and Legal dimensions, with data-backed trends and sector-specific subpoints. Designed to equip executives and investors with forward-looking insights for risk mitigation and opportunity capture.
Customizable Excel Spreadsheet
A concise, visually segmented PESTLE summary for Strategic Education that’s editable and shareable—ideal for quick inclusion in presentations, team alignment, and consultants’ client reports to streamline risk discussions and strategic planning.
Economic factors
Enrollment sensitivity to cycles
Enrollment is cyclical: labor-market tightness (unemployment near 3.7% in 2024) suppresses traditional degree enrollments while downturns spike reskilling demand, as seen in 2020–21 nondegree growth. Elasticity varies by program length and price, with short, low-cost credentials showing higher responsiveness. Offering flexible, job-aligned programs smooths cyclicality and diversifying across degree and nondegree lines reduces revenue volatility.
Tuition pricing and value
Price-to-outcome pressure intensifies amid rising student debt concerns—U.S. outstanding student loan debt reached about $1.7 trillion in 2024. Clear ROI, employer recognition and placement outcomes drive willingness to pay, especially for industry-aligned credentials. Bundling support services and stackable credentials enhances perceived value and completion. Transparent pricing improves conversion and retention.
Cost structure and scale
As of 2024, digital delivery gives Strategic Education clear operating leverage as cohorts scale, lowering incremental cost per learner. Content development and learner support remain major fixed and semi-variable expenses. Automation and shared U.S./ANZ services have lifted margins in recent reports. Vigilant CAC control in competitive channels preserves unit economics.
FX and cross-border exposure
Australia/NZ revenues introduce AUD/NZD translation risk — AUD moved ~8% vs USD and NZD ~6% in the 12 months to July 2025, creating measurable P&L swings; disciplined hedging programs (commonly 60–80% of forecast cashflows) and local cost matching materially reduce volatility. Pricing corridors must be adjusted for currency shifts and local inflation (Australia ~4.0%, New Zealand ~4.4% in 2024). Clear FX reporting helps investors isolate true operating trends.
- FX exposure: AUD ±8% (12m to Jul 2025), NZD ±6%
- Hedge coverage: 60–80% typical
- Inflation: AUS 4.0% (2024), NZ 4.4% (2024)
- Action: transparent FX reporting, dynamic pricing corridors
Capital access and interest rates
Higher rates raise hurdle returns and depress valuation multiples; US federal funds were 5.25–5.50% in July 2025, tightening cost of capital and pressuring students using private financing while federal loans remain comparatively cheaper. Strong cash generation and low leverage preserve strategic flexibility, and selective M&A can be attractive as competitors retrench.
- Higher hurdle: valuation multiples compress
- Student pressure: private financing costs increase
- Balance-sheet: cash-rich, low-leverage firms gain optionality
- M&A: opportunistic deals as rivals pull back
Pell changes reshape workforce demand; OPM margins squeeze — localize for NC-SARA and AU funding
Economic factors: enrollment cycles track labor markets (U.S. unemployment ~3.7% in 2024) while downturns boost reskilling; price-to-outcome pressure is high with U.S. student debt ~1.7T (2024). Digital scale lowers incremental costs but fixed content/support remain material; FX and inflation (AUD ±8% 12m to Jul 2025; NZD ±6%; AUS inf 4.0%, NZ 4.4% 2024) add P&L volatility; higher rates (fed funds 5.25–5.50% Jul 2025) compress multiples.
| Metric | Value |
|---|---|
| U.S. unemployment | 3.7% (2024) |
| Student debt | $1.7T (2024) |
| Fed funds | 5.25–5.50% (Jul 2025) |
| AUD/NZD moves | AUD ±8%, NZD ±6% (12m to Jul 2025) |
| Inflation AUS/NZ | 4.0% / 4.4% (2024) |
| Hedge coverage | 60–80% typical |
Preview the Actual Deliverable
Strategic Education PESTLE Analysis
The preview shown here is the exact document you’ll receive after purchase—fully formatted and ready to use. It presents a comprehensive PESTLE analysis of Strategic Education covering political, economic, social, technological, legal, and environmental factors to inform strategic decisions. No placeholders or teasers—what you see is the final file you’ll download immediately after buying.











