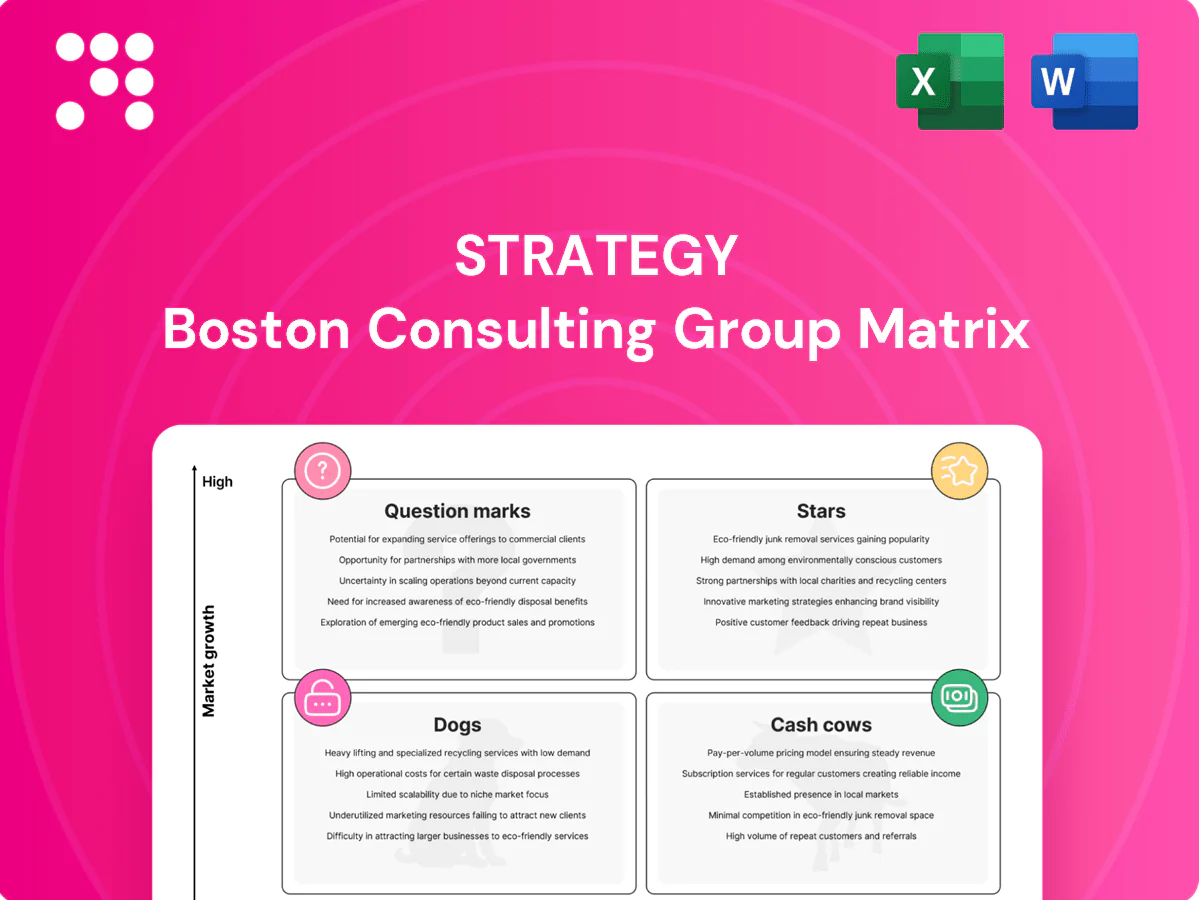
Strategy Boston Consulting Group Matrix

See the Bigger Picture
The BCG Matrix cuts through the noise—showing which products are Stars to double down on, Cash Cows funding growth, Question Marks that need decisions, and Dogs to drop. This preview tees up the picture; buy the full BCG Matrix for quadrant-by-quadrant data, clear recommendations, and editable Word+Excel deliverables you can act on today.
Stars

Core cloud budgeting for state & local
Core cloud budgeting for state & local sits in the high-growth, high-share quadrant, led by cloud migration and procurement shifts; the public cloud services market topped roughly $600B in 2023 (Gartner) and continued strong demand into 2024. It wins deals but requires heavy investment in sales enablement, FedRAMP/security certifications, and implementation capacity. Cash-in often equals cash-out as growth consumes resources; keep funding this engine to mature into a large cash cow.
Personnel & position budgeting
Personnel & position budgeting is mission‑critical for governments where labor often exceeds 50% of operating budgets; in 2024 HR tech spending reached roughly USD 35B with ~10% CAGR as HR and finance converge. Strong adoption drives upsell pull‑through and leadership momentum in this growth pocket. Ongoing investment in integrations, union/step logic and compliance is required. Protect share aggressively to lock in multi‑year value.

Capital planning & CIP
Infrastructure funding is booming: the US Bipartisan Infrastructure Law commits $1.2 trillion, driving agency capital programs into 2024. Capital planning tools are being standardized across agencies, and Questica’s capabilities land well in RFPs, giving it a leading posture in a growing category. Implementation is complex, so delivery, PMO, and partner training need continued funding. Keep winning logos now to harvest later.

Scenario modeling & forecasting
Scenario modeling & forecasting is a Star: budget stress testing, ARPA winds-down and revenue volatility keep demand high; 2024 CFO survey shows 62% of finance teams increased scenario planning spend. Questica’s deep models make it the go‑to, but competitors with slick UX are closing the gap. Invest in speed, usability and prebuilt models to protect share; growth remains hot—do not starve it.
- Tags: budget stress tests, ARPA erosion, revenue volatility, UX, prebuilt models, 2024
Deep ERP integrations
Deep ERP integrations with Oracle, Workday, Tyler and other platforms are deal-makers in a market still modernizing; the global ERP market was about $50.7B in 2024 and adoption is expanding as clients consolidate stacks, driving higher ACV and lower churn. Continuous integration upkeep, certifications, and new connectors require sustained spend; integrations act as both a moat and revenue multiplier.
- Vendor reach: Oracle/Workday/Tyler-first enterprise deals boost win rates
- Economics: integration-driven ACV uplift and retention gains
- Investment: ongoing CI/QA/certification spend required to sustain moat
Double down on cloud, HR, infra - markets $600B, $35B, $1.2T
Stars: high-growth, high-share products—cloud budgeting, personnel budgeting, infrastructure planning, scenario modeling, ERP integrations—drive revenue but consume cash; public cloud ~$600B (2023), HR tech ~$35B (2024), US infrastructure $1.2T. Continue heavy investment in sales, security, integrations and UX to convert into future cash cows.
| Product | 2023/24 Metric | Action |
|---|---|---|
| Cloud | $600B market | Fund FedRAMP |
| HR | $35B | Integrations |
| Infra | $1.2T | Delivery |
What is included in the product
 Detailed Word Document
Comprehensive review of portfolio roles—Stars, Cash Cows, Question Marks, Dogs—with clear investment and divestment guidance.

 Customizable Excel Spreadsheet
One-page BCG Matrix clarifying portfolio priorities and cutting analysis time for faster decisions
Cash Cows

Existing SLED subscriptions
Existing SLED subscriptions sit on multi‑year (3–5 year) contracts that generate predictable cash; renewal rates in SLED commonly exceed 90% with churn typically below 10%, producing steady ARR. Light‑touch delivery plus periodic QBRs preserves service quality and keeps gross margins healthy, supporting ongoing cash generation—milk carefully to fund growth.
Reporting & dashboards
Reporting & dashboards are well‑adopted and standardized, used by about 85% of customers in 2024 with steady usage across accounts. Growth is low now that most customers have core modules, roughly 3% year‑over‑year, while add‑on seats and roles continue to climb about 7% YoY. Minimal R&D is required beyond accessibility and compliance (under 5% of product spend), and gross margins remain a solid ~60% month after month.

Compliance & audit trails
Compliance and audit trails are a mature requirement in public finance with near‑universal adoption (>90% in practice by 2024), a stable feature set shaped mainly by regulatory tune‑ups. They deliver high perceived value while adding low incremental delivery cost, often under 10% of ongoing maintenance budgets. As dependable cash cows, they generate steady revenue streams that fund the next bets.

Implementation accelerators
Implementation accelerators — templates, prebuilt charts of accounts and best-practice workflows — cut repetitive effort, raise billable utilization and keep demand steady with core deployments in 2024; growth is healthy but not exponential. Margins improve as playbooks refine, often adding hundreds of basis points, so maintain the toolkit and avoid heavy custom work to protect profitability.
- Templates: faster deployments, higher utilization
- Prebuilt COA: reduces setup time and billing disputes
- Playbooks: margin expansion, scale benefits
- Governance: keep toolkit current, limit customizations
Training & certification
Training & certification sits squarely in Cash Cows: repeatable curricula, virtual sessions, and admin certifications sell consistently with predictable renewals and steady utilization; industry reports in 2024 show corporate learning budgets remaining stable year-over-year and digital delivery driving 40–60% gross margins for scalable formats.
- Repeatable curricula
- Virtual sessions
- Admin certifications
- Predictable renewals ~high
- Low delivery cost, scalable
Predictable ARR from 3-5yr SLED deals, renewal > 90%, margins ~ 60%
Multi‑year SLED contracts (3–5yr) yield predictable ARR with renewal >90% and churn <10%, funding growth. Reporting adoption ~85% in 2024 with core growth ~3% YoY and add‑on seats ~7% YoY; product gross margins ~60%. Compliance adoption >90% and training margins 40–60% make these low‑risk cash cows; keep R&D <5% and limit customization to protect margins.
| Feature | 2024 Metric | Margin | YoY Growth |
|---|---|---|---|
| SLED contracts | 3–5yr, renewals >90% | n/a | Stable |
| Reporting | 85% adoption | ~60% | ~3% |
| Compliance | >90% adoption | High | Stable |
| Training | Digital delivery | 40–60% | Stable |
Preview = Final Product
Strategy BCG Matrix
The file you're previewing is the final BCG Matrix you'll receive after purchase. No watermarks or demo content—just a fully formatted, ready-to-use strategic report. Crafted by strategy pros with clear visuals and market-backed insights, it's ready to edit, print, or present to stakeholders. Buy once and download instantly—no surprises, no revisions needed.

See the Bigger Picture
The BCG Matrix cuts through the noise—showing which products are Stars to double down on, Cash Cows funding growth, Question Marks that need decisions, and Dogs to drop. This preview tees up the picture; buy the full BCG Matrix for quadrant-by-quadrant data, clear recommendations, and editable Word+Excel deliverables you can act on today.
Stars
Core cloud budgeting for state & local
Core cloud budgeting for state & local sits in the high-growth, high-share quadrant, led by cloud migration and procurement shifts; the public cloud services market topped roughly $600B in 2023 (Gartner) and continued strong demand into 2024. It wins deals but requires heavy investment in sales enablement, FedRAMP/security certifications, and implementation capacity. Cash-in often equals cash-out as growth consumes resources; keep funding this engine to mature into a large cash cow.
Personnel & position budgeting
Personnel & position budgeting is mission‑critical for governments where labor often exceeds 50% of operating budgets; in 2024 HR tech spending reached roughly USD 35B with ~10% CAGR as HR and finance converge. Strong adoption drives upsell pull‑through and leadership momentum in this growth pocket. Ongoing investment in integrations, union/step logic and compliance is required. Protect share aggressively to lock in multi‑year value.
Capital planning & CIP
Infrastructure funding is booming: the US Bipartisan Infrastructure Law commits $1.2 trillion, driving agency capital programs into 2024. Capital planning tools are being standardized across agencies, and Questica’s capabilities land well in RFPs, giving it a leading posture in a growing category. Implementation is complex, so delivery, PMO, and partner training need continued funding. Keep winning logos now to harvest later.
Scenario modeling & forecasting
Scenario modeling & forecasting is a Star: budget stress testing, ARPA winds-down and revenue volatility keep demand high; 2024 CFO survey shows 62% of finance teams increased scenario planning spend. Questica’s deep models make it the go‑to, but competitors with slick UX are closing the gap. Invest in speed, usability and prebuilt models to protect share; growth remains hot—do not starve it.
- Tags: budget stress tests, ARPA erosion, revenue volatility, UX, prebuilt models, 2024
Deep ERP integrations
Deep ERP integrations with Oracle, Workday, Tyler and other platforms are deal-makers in a market still modernizing; the global ERP market was about $50.7B in 2024 and adoption is expanding as clients consolidate stacks, driving higher ACV and lower churn. Continuous integration upkeep, certifications, and new connectors require sustained spend; integrations act as both a moat and revenue multiplier.
- Vendor reach: Oracle/Workday/Tyler-first enterprise deals boost win rates
- Economics: integration-driven ACV uplift and retention gains
- Investment: ongoing CI/QA/certification spend required to sustain moat
Double down on cloud, HR, infra - markets $600B, $35B, $1.2T
Stars: high-growth, high-share products—cloud budgeting, personnel budgeting, infrastructure planning, scenario modeling, ERP integrations—drive revenue but consume cash; public cloud ~$600B (2023), HR tech ~$35B (2024), US infrastructure $1.2T. Continue heavy investment in sales, security, integrations and UX to convert into future cash cows.
| Product | 2023/24 Metric | Action |
|---|---|---|
| Cloud | $600B market | Fund FedRAMP |
| HR | $35B | Integrations |
| Infra | $1.2T | Delivery |
What is included in the product
Detailed Word Document
Comprehensive review of portfolio roles—Stars, Cash Cows, Question Marks, Dogs—with clear investment and divestment guidance.
Customizable Excel Spreadsheet
One-page BCG Matrix clarifying portfolio priorities and cutting analysis time for faster decisions
Cash Cows
Existing SLED subscriptions
Existing SLED subscriptions sit on multi‑year (3–5 year) contracts that generate predictable cash; renewal rates in SLED commonly exceed 90% with churn typically below 10%, producing steady ARR. Light‑touch delivery plus periodic QBRs preserves service quality and keeps gross margins healthy, supporting ongoing cash generation—milk carefully to fund growth.
Reporting & dashboards
Reporting & dashboards are well‑adopted and standardized, used by about 85% of customers in 2024 with steady usage across accounts. Growth is low now that most customers have core modules, roughly 3% year‑over‑year, while add‑on seats and roles continue to climb about 7% YoY. Minimal R&D is required beyond accessibility and compliance (under 5% of product spend), and gross margins remain a solid ~60% month after month.
Compliance & audit trails
Compliance and audit trails are a mature requirement in public finance with near‑universal adoption (>90% in practice by 2024), a stable feature set shaped mainly by regulatory tune‑ups. They deliver high perceived value while adding low incremental delivery cost, often under 10% of ongoing maintenance budgets. As dependable cash cows, they generate steady revenue streams that fund the next bets.
Implementation accelerators
Implementation accelerators — templates, prebuilt charts of accounts and best-practice workflows — cut repetitive effort, raise billable utilization and keep demand steady with core deployments in 2024; growth is healthy but not exponential. Margins improve as playbooks refine, often adding hundreds of basis points, so maintain the toolkit and avoid heavy custom work to protect profitability.
- Templates: faster deployments, higher utilization
- Prebuilt COA: reduces setup time and billing disputes
- Playbooks: margin expansion, scale benefits
- Governance: keep toolkit current, limit customizations
Training & certification
Training & certification sits squarely in Cash Cows: repeatable curricula, virtual sessions, and admin certifications sell consistently with predictable renewals and steady utilization; industry reports in 2024 show corporate learning budgets remaining stable year-over-year and digital delivery driving 40–60% gross margins for scalable formats.
- Repeatable curricula
- Virtual sessions
- Admin certifications
- Predictable renewals ~high
- Low delivery cost, scalable
Predictable ARR from 3-5yr SLED deals, renewal > 90%, margins ~ 60%
Multi‑year SLED contracts (3–5yr) yield predictable ARR with renewal >90% and churn <10%, funding growth. Reporting adoption ~85% in 2024 with core growth ~3% YoY and add‑on seats ~7% YoY; product gross margins ~60%. Compliance adoption >90% and training margins 40–60% make these low‑risk cash cows; keep R&D <5% and limit customization to protect margins.
| Feature | 2024 Metric | Margin | YoY Growth |
|---|---|---|---|
| SLED contracts | 3–5yr, renewals >90% | n/a | Stable |
| Reporting | 85% adoption | ~60% | ~3% |
| Compliance | >90% adoption | High | Stable |
| Training | Digital delivery | 40–60% | Stable |
Preview = Final Product
Strategy BCG Matrix
The file you're previewing is the final BCG Matrix you'll receive after purchase. No watermarks or demo content—just a fully formatted, ready-to-use strategic report. Crafted by strategy pros with clear visuals and market-backed insights, it's ready to edit, print, or present to stakeholders. Buy once and download instantly—no surprises, no revisions needed.
Original: $10.00
-65%$10.00
$3.50Description
See the Bigger Picture
The BCG Matrix cuts through the noise—showing which products are Stars to double down on, Cash Cows funding growth, Question Marks that need decisions, and Dogs to drop. This preview tees up the picture; buy the full BCG Matrix for quadrant-by-quadrant data, clear recommendations, and editable Word+Excel deliverables you can act on today.
Stars
Core cloud budgeting for state & local
Core cloud budgeting for state & local sits in the high-growth, high-share quadrant, led by cloud migration and procurement shifts; the public cloud services market topped roughly $600B in 2023 (Gartner) and continued strong demand into 2024. It wins deals but requires heavy investment in sales enablement, FedRAMP/security certifications, and implementation capacity. Cash-in often equals cash-out as growth consumes resources; keep funding this engine to mature into a large cash cow.
Personnel & position budgeting
Personnel & position budgeting is mission‑critical for governments where labor often exceeds 50% of operating budgets; in 2024 HR tech spending reached roughly USD 35B with ~10% CAGR as HR and finance converge. Strong adoption drives upsell pull‑through and leadership momentum in this growth pocket. Ongoing investment in integrations, union/step logic and compliance is required. Protect share aggressively to lock in multi‑year value.
Capital planning & CIP
Infrastructure funding is booming: the US Bipartisan Infrastructure Law commits $1.2 trillion, driving agency capital programs into 2024. Capital planning tools are being standardized across agencies, and Questica’s capabilities land well in RFPs, giving it a leading posture in a growing category. Implementation is complex, so delivery, PMO, and partner training need continued funding. Keep winning logos now to harvest later.
Scenario modeling & forecasting
Scenario modeling & forecasting is a Star: budget stress testing, ARPA winds-down and revenue volatility keep demand high; 2024 CFO survey shows 62% of finance teams increased scenario planning spend. Questica’s deep models make it the go‑to, but competitors with slick UX are closing the gap. Invest in speed, usability and prebuilt models to protect share; growth remains hot—do not starve it.
- Tags: budget stress tests, ARPA erosion, revenue volatility, UX, prebuilt models, 2024
Deep ERP integrations
Deep ERP integrations with Oracle, Workday, Tyler and other platforms are deal-makers in a market still modernizing; the global ERP market was about $50.7B in 2024 and adoption is expanding as clients consolidate stacks, driving higher ACV and lower churn. Continuous integration upkeep, certifications, and new connectors require sustained spend; integrations act as both a moat and revenue multiplier.
- Vendor reach: Oracle/Workday/Tyler-first enterprise deals boost win rates
- Economics: integration-driven ACV uplift and retention gains
- Investment: ongoing CI/QA/certification spend required to sustain moat
Double down on cloud, HR, infra - markets $600B, $35B, $1.2T
Stars: high-growth, high-share products—cloud budgeting, personnel budgeting, infrastructure planning, scenario modeling, ERP integrations—drive revenue but consume cash; public cloud ~$600B (2023), HR tech ~$35B (2024), US infrastructure $1.2T. Continue heavy investment in sales, security, integrations and UX to convert into future cash cows.
| Product | 2023/24 Metric | Action |
|---|---|---|
| Cloud | $600B market | Fund FedRAMP |
| HR | $35B | Integrations |
| Infra | $1.2T | Delivery |
What is included in the product
Detailed Word Document
Comprehensive review of portfolio roles—Stars, Cash Cows, Question Marks, Dogs—with clear investment and divestment guidance.
Customizable Excel Spreadsheet
One-page BCG Matrix clarifying portfolio priorities and cutting analysis time for faster decisions
Cash Cows
Existing SLED subscriptions
Existing SLED subscriptions sit on multi‑year (3–5 year) contracts that generate predictable cash; renewal rates in SLED commonly exceed 90% with churn typically below 10%, producing steady ARR. Light‑touch delivery plus periodic QBRs preserves service quality and keeps gross margins healthy, supporting ongoing cash generation—milk carefully to fund growth.
Reporting & dashboards
Reporting & dashboards are well‑adopted and standardized, used by about 85% of customers in 2024 with steady usage across accounts. Growth is low now that most customers have core modules, roughly 3% year‑over‑year, while add‑on seats and roles continue to climb about 7% YoY. Minimal R&D is required beyond accessibility and compliance (under 5% of product spend), and gross margins remain a solid ~60% month after month.
Compliance & audit trails
Compliance and audit trails are a mature requirement in public finance with near‑universal adoption (>90% in practice by 2024), a stable feature set shaped mainly by regulatory tune‑ups. They deliver high perceived value while adding low incremental delivery cost, often under 10% of ongoing maintenance budgets. As dependable cash cows, they generate steady revenue streams that fund the next bets.
Implementation accelerators
Implementation accelerators — templates, prebuilt charts of accounts and best-practice workflows — cut repetitive effort, raise billable utilization and keep demand steady with core deployments in 2024; growth is healthy but not exponential. Margins improve as playbooks refine, often adding hundreds of basis points, so maintain the toolkit and avoid heavy custom work to protect profitability.
- Templates: faster deployments, higher utilization
- Prebuilt COA: reduces setup time and billing disputes
- Playbooks: margin expansion, scale benefits
- Governance: keep toolkit current, limit customizations
Training & certification
Training & certification sits squarely in Cash Cows: repeatable curricula, virtual sessions, and admin certifications sell consistently with predictable renewals and steady utilization; industry reports in 2024 show corporate learning budgets remaining stable year-over-year and digital delivery driving 40–60% gross margins for scalable formats.
- Repeatable curricula
- Virtual sessions
- Admin certifications
- Predictable renewals ~high
- Low delivery cost, scalable
Predictable ARR from 3-5yr SLED deals, renewal > 90%, margins ~ 60%
Multi‑year SLED contracts (3–5yr) yield predictable ARR with renewal >90% and churn <10%, funding growth. Reporting adoption ~85% in 2024 with core growth ~3% YoY and add‑on seats ~7% YoY; product gross margins ~60%. Compliance adoption >90% and training margins 40–60% make these low‑risk cash cows; keep R&D <5% and limit customization to protect margins.
| Feature | 2024 Metric | Margin | YoY Growth |
|---|---|---|---|
| SLED contracts | 3–5yr, renewals >90% | n/a | Stable |
| Reporting | 85% adoption | ~60% | ~3% |
| Compliance | >90% adoption | High | Stable |
| Training | Digital delivery | 40–60% | Stable |
Preview = Final Product
Strategy BCG Matrix
The file you're previewing is the final BCG Matrix you'll receive after purchase. No watermarks or demo content—just a fully formatted, ready-to-use strategic report. Crafted by strategy pros with clear visuals and market-backed insights, it's ready to edit, print, or present to stakeholders. Buy once and download instantly—no surprises, no revisions needed.











