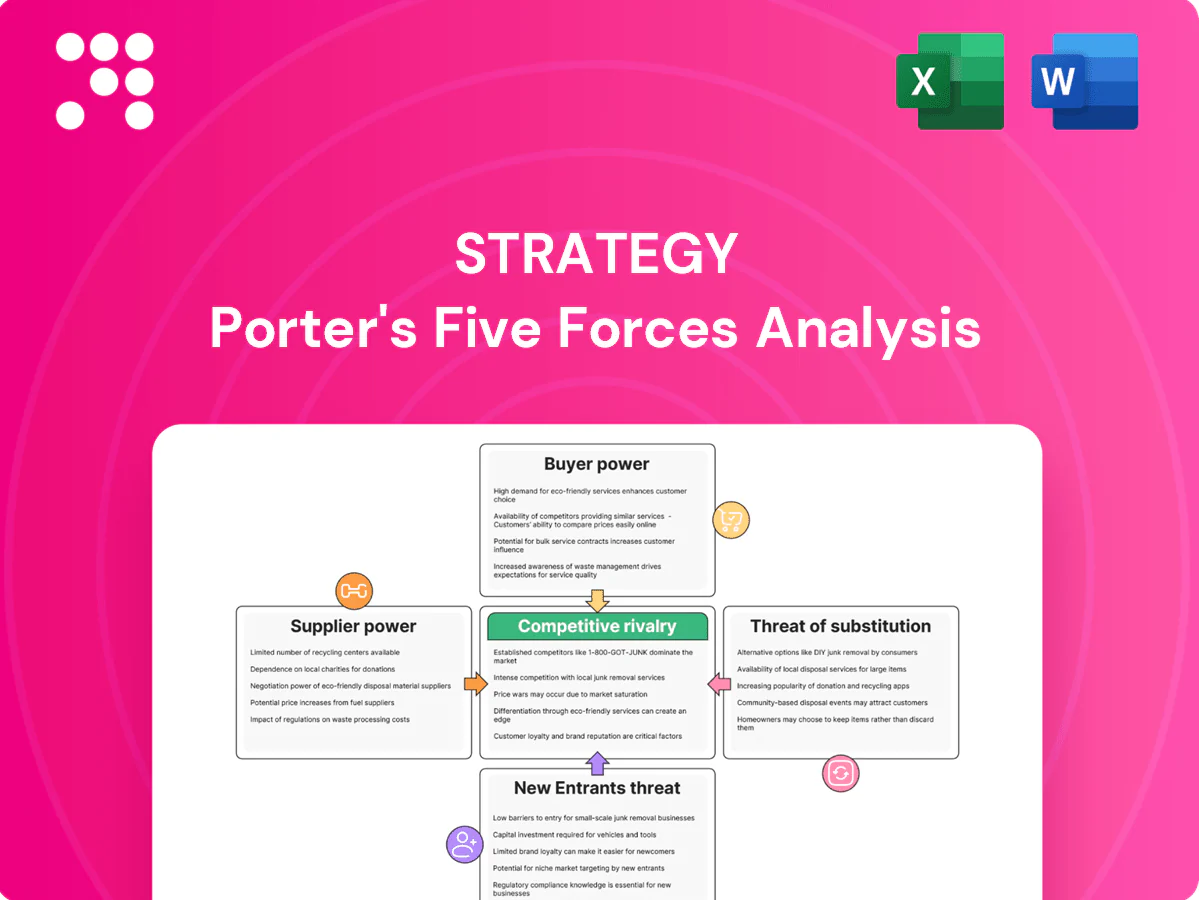
Strategy Porter's Five Forces Analysis

From Overview to Strategy Blueprint
Porter’s Five Forces analysis of Strategy reveals how supplier/buyer power, rivalry, substitutes and entry threats shape profitability and positioning. This snapshot highlights key pressures and competitive levers you must monitor. Unlock the full report for force-by-force ratings, visuals, and actionable recommendations to inform investment or strategic decisions.
Suppliers Bargaining Power

Cloud IaaS dependence
Questica depends on hyperscalers for hosting, compute and databases, concentrating supply: AWS ~32%, Azure ~23% and Google Cloud ~11% of the IaaS market in 2024, giving few providers outsized leverage. Price shifts or reserved‑instance policies can compress margins, with enterprise cloud spend still rising ~20% YoY in 2024, amplifying cost exposure. Multi‑cloud or reserved capacity can mitigate risk but switching is costly and complex, while outages and tight SLAs materially shape negotiating leverage.
Data integration and ERP connectors
Critical connectors to ERPs such as Oracle, SAP, Tyler and Workday are specialized, with SAP and Oracle dominating enterprise footprints; industry reports in 2024 show integration work can consume roughly 30–40% of ERP implementation budgets. API access terms, certification programs and partner tiers create bottlenecks and vendors may change APIs or impose fees, raising switching costs. Building and maintaining adapters demands ongoing engineering resources and recurring operating expense.

Security, compliance, and audit vendors
SOC 2 and ISO 27001 require third-party auditors and tools, typically costing $20k–$100k for SOC 2 and $10k–$50k for ISO 27001, while government attestations (eg FedRAMP) can reach $250k–$1M and add 6–18 months. These suppliers can raise costs and timelines, especially for public-sector deals; annual audit cadence locks in predictable spend (often 10–20% of security budgets), and continuous monitoring needs reduce buyer bargaining leverage.

Implementation and services partners
Regional SIs and consultancies shape peak delivery capacity; 2024 IT services market ≈$1.35T with SI-driven projects ~40%. Scarcity of public-sector specialists raised rates by ~20–50% in 2024. Strong partner ecosystems diversify risk but require MDF and 10–25% margin sharing. Losing a key partner can slow deployments by months and cut win rates.
- Dependence: regional SIs set delivery ceiling
- Cost: public-sector premiums +20–50%
- Economics: MDF and 10–25% margin sharing
- Risk: partner loss → delayed rollouts, lower wins
Specialized talent and SaaS tooling
Engineers with budgeting, forecasting, and government-domain expertise remain scarce, raising labor supplier power as larger SaaS firms outbid startups in compensation cycles; 2024 tech turnover averaged about 25%, intensifying recruitment pressure. Concentrated costs from CI/CD, observability, and data pipeline vendors—part of a global SaaS market ~197 billion in 2024—further strengthen supplier leverage. Retention programs lower churn but do not remove this bargaining power.
- Limited specialist talent increases wage pressure
- ~25% tech turnover in 2024 raises hiring costs
- $197B global SaaS market (2024) reflects vendor pricing power
- Retention helps but cannot fully negate supplier leverage
Hyperscalers, compliance costs and talent squeeze margins, raising switching costs
Suppliers hold strong leverage: hyperscaler concentration (AWS 32%, Azure 23%, GCP 11% in 2024) and ~20% YoY cloud spend growth compress margins and raise switching costs. ERP connectors, third‑party auditors (SOC 2 $20k–$100k; FedRAMP $250k–$1M) and regional SIs (IT services ~$1.35T; SI projects ~40%) create integration bottlenecks. Talent scarcity (≈25% tech turnover in 2024) and SaaS vendor pricing (~$197B market) further strengthen supplier power.
| Item | 2024 Data |
|---|---|
| Hyperscaler share | AWS 32% / Azure 23% / GCP 11% |
| Cloud spend growth | ~20% YoY |
| SOC 2 cost | $20k–$100k |
| FedRAMP cost | $250k–$1M |
| Tech turnover | ~25% |
| IT services market | $1.35T (SI ~40%) |
| Global SaaS market | $197B |
What is included in the product
 Detailed Word Document
Uncovers competitive drivers, supplier/buyer power, entry barriers and substitutes affecting Strategy, highlighting disruptive threats and market dynamics. Delivered as a fully editable Word analysis with data-backed insights for business plans, investor materials, internal strategy decks or academic use.

 Customizable Excel Spreadsheet
A one-sheet Porter's Five Forces template that translates complex competitive dynamics into clear, actionable pressure scores—ideal for quick strategic decisions, investor decks, and boardroom alignment.
Customers Bargaining Power

Public-sector procurement leverage
Government RFPs, framework agreements and multi-year contracts concentrate buyer power—public procurement represents about 12% of GDP in OECD countries (OECD, 2024) and the EU public procurement market is roughly €2 trillion annually (EC, 2024). Buyers enforce strict SLAs, data residency and security requirements, while price transparency and intense bid competition compress vendor margins; negotiations commonly include caps, MFN clauses and long payment cycles.
High switching costs but formalized exits
Data migration, process redesign and staff retraining create high switching costs that reinforce incumbency but are mitigated by public procurement rules and GDPR-driven data portability and mandated exit plans. Incumbents gain advantage in rebids yet lose absolute lock-in as reprocurements typically occur every 3-7 years and face scrutiny. Renewal pricing must anticipate council and auditor review.

Budget constraints and cyclical timing
Fiscal calendars and appropriations (US federal FY2024 began Oct 1, 2023) constrain pricing flexibility, forcing vendors to offer discounts or phased rollouts to fit funding windows. Procurement delays commonly push deals into the next fiscal year, giving buyers timing leverage. Emphasizing total cost of ownership and clear ROI is critical to accelerate approvals and capture budgeted spend.

Demand for interoperability and transparency
Buyers now demand seamless integration with ERP, HR and BI systems and expect open data, audit trails and real-time performance dashboards; by 2024 over 60% of enterprise buyers ranked interoperability and transparency among top purchasing criteria. Failure to meet these standards triggers rapid down-selection, and shifting integration/customization costs onto vendors increases buyer leverage.
- Seamless ERP/HR/BI integration required
- Open data, audit trails, dashboards non-negotiable
- Over 60% of enterprises prioritize interoperability (2024)
- Vendors absorb higher customization costs
Referenceability and peer networks
Public-sector buyers, who oversee public procurement that OECD estimates at about 12% of GDP in 2024, rely heavily on references and consortium endorsements, so strong references lower perceived risk and reduce buyer power. Negative outcomes from a single implementation can cascade across regions, increasing scrutiny and bargaining leverage. Conversely, a few poor implementations amplify buyer negotiating strength and can force tougher contract terms.
- References reduce perceived risk — lowers buyer power
- High-profile failures cascade — raise buyer leverage
- Poor implementations (even few) strengthen buyer negotiation
Buyers lead: ~12% GDP; EU €2T; >60% want interop
Buyers hold strong leverage: public procurement is ~12% of GDP (OECD 2024) and EU public market ~€2 trillion, driving strict SLAs, price pressure and MFN clauses. Switching costs (migration, retraining) create incumbency but reprocurements every 3–7 years and GDPR portability limit lock‑in. Over 60% of enterprises (2024) demand interoperability, shifting customization costs to vendors.
| Metric | Value (2024) |
|---|---|
| Public procurement share (OECD) | ~12% GDP |
| EU public market | €2 trillion |
| Reprocurement cycle | 3–7 years |
| Interoperability priority | >60% |
What You See Is What You Get
Strategy Porter's Five Forces Analysis
This preview shows the exact Strategy Porter’s Five Forces Analysis you'll receive after purchase—no placeholders or mockups. The concise report covers competitive rivalry, supplier power, buyer power, threat of substitution, and barriers to entry with clear scoring and actionable insights. It's fully formatted and ready for immediate download and use.

From Overview to Strategy Blueprint
Porter’s Five Forces analysis of Strategy reveals how supplier/buyer power, rivalry, substitutes and entry threats shape profitability and positioning. This snapshot highlights key pressures and competitive levers you must monitor. Unlock the full report for force-by-force ratings, visuals, and actionable recommendations to inform investment or strategic decisions.
Suppliers Bargaining Power
Cloud IaaS dependence
Questica depends on hyperscalers for hosting, compute and databases, concentrating supply: AWS ~32%, Azure ~23% and Google Cloud ~11% of the IaaS market in 2024, giving few providers outsized leverage. Price shifts or reserved‑instance policies can compress margins, with enterprise cloud spend still rising ~20% YoY in 2024, amplifying cost exposure. Multi‑cloud or reserved capacity can mitigate risk but switching is costly and complex, while outages and tight SLAs materially shape negotiating leverage.
Data integration and ERP connectors
Critical connectors to ERPs such as Oracle, SAP, Tyler and Workday are specialized, with SAP and Oracle dominating enterprise footprints; industry reports in 2024 show integration work can consume roughly 30–40% of ERP implementation budgets. API access terms, certification programs and partner tiers create bottlenecks and vendors may change APIs or impose fees, raising switching costs. Building and maintaining adapters demands ongoing engineering resources and recurring operating expense.
Security, compliance, and audit vendors
SOC 2 and ISO 27001 require third-party auditors and tools, typically costing $20k–$100k for SOC 2 and $10k–$50k for ISO 27001, while government attestations (eg FedRAMP) can reach $250k–$1M and add 6–18 months. These suppliers can raise costs and timelines, especially for public-sector deals; annual audit cadence locks in predictable spend (often 10–20% of security budgets), and continuous monitoring needs reduce buyer bargaining leverage.
Implementation and services partners
Regional SIs and consultancies shape peak delivery capacity; 2024 IT services market ≈$1.35T with SI-driven projects ~40%. Scarcity of public-sector specialists raised rates by ~20–50% in 2024. Strong partner ecosystems diversify risk but require MDF and 10–25% margin sharing. Losing a key partner can slow deployments by months and cut win rates.
- Dependence: regional SIs set delivery ceiling
- Cost: public-sector premiums +20–50%
- Economics: MDF and 10–25% margin sharing
- Risk: partner loss → delayed rollouts, lower wins
Specialized talent and SaaS tooling
Engineers with budgeting, forecasting, and government-domain expertise remain scarce, raising labor supplier power as larger SaaS firms outbid startups in compensation cycles; 2024 tech turnover averaged about 25%, intensifying recruitment pressure. Concentrated costs from CI/CD, observability, and data pipeline vendors—part of a global SaaS market ~197 billion in 2024—further strengthen supplier leverage. Retention programs lower churn but do not remove this bargaining power.
- Limited specialist talent increases wage pressure
- ~25% tech turnover in 2024 raises hiring costs
- $197B global SaaS market (2024) reflects vendor pricing power
- Retention helps but cannot fully negate supplier leverage
Hyperscalers, compliance costs and talent squeeze margins, raising switching costs
Suppliers hold strong leverage: hyperscaler concentration (AWS 32%, Azure 23%, GCP 11% in 2024) and ~20% YoY cloud spend growth compress margins and raise switching costs. ERP connectors, third‑party auditors (SOC 2 $20k–$100k; FedRAMP $250k–$1M) and regional SIs (IT services ~$1.35T; SI projects ~40%) create integration bottlenecks. Talent scarcity (≈25% tech turnover in 2024) and SaaS vendor pricing (~$197B market) further strengthen supplier power.
| Item | 2024 Data |
|---|---|
| Hyperscaler share | AWS 32% / Azure 23% / GCP 11% |
| Cloud spend growth | ~20% YoY |
| SOC 2 cost | $20k–$100k |
| FedRAMP cost | $250k–$1M |
| Tech turnover | ~25% |
| IT services market | $1.35T (SI ~40%) |
| Global SaaS market | $197B |
What is included in the product
Detailed Word Document
Uncovers competitive drivers, supplier/buyer power, entry barriers and substitutes affecting Strategy, highlighting disruptive threats and market dynamics. Delivered as a fully editable Word analysis with data-backed insights for business plans, investor materials, internal strategy decks or academic use.
Customizable Excel Spreadsheet
A one-sheet Porter's Five Forces template that translates complex competitive dynamics into clear, actionable pressure scores—ideal for quick strategic decisions, investor decks, and boardroom alignment.
Customers Bargaining Power
Public-sector procurement leverage
Government RFPs, framework agreements and multi-year contracts concentrate buyer power—public procurement represents about 12% of GDP in OECD countries (OECD, 2024) and the EU public procurement market is roughly €2 trillion annually (EC, 2024). Buyers enforce strict SLAs, data residency and security requirements, while price transparency and intense bid competition compress vendor margins; negotiations commonly include caps, MFN clauses and long payment cycles.
High switching costs but formalized exits
Data migration, process redesign and staff retraining create high switching costs that reinforce incumbency but are mitigated by public procurement rules and GDPR-driven data portability and mandated exit plans. Incumbents gain advantage in rebids yet lose absolute lock-in as reprocurements typically occur every 3-7 years and face scrutiny. Renewal pricing must anticipate council and auditor review.
Budget constraints and cyclical timing
Fiscal calendars and appropriations (US federal FY2024 began Oct 1, 2023) constrain pricing flexibility, forcing vendors to offer discounts or phased rollouts to fit funding windows. Procurement delays commonly push deals into the next fiscal year, giving buyers timing leverage. Emphasizing total cost of ownership and clear ROI is critical to accelerate approvals and capture budgeted spend.
Demand for interoperability and transparency
Buyers now demand seamless integration with ERP, HR and BI systems and expect open data, audit trails and real-time performance dashboards; by 2024 over 60% of enterprise buyers ranked interoperability and transparency among top purchasing criteria. Failure to meet these standards triggers rapid down-selection, and shifting integration/customization costs onto vendors increases buyer leverage.
- Seamless ERP/HR/BI integration required
- Open data, audit trails, dashboards non-negotiable
- Over 60% of enterprises prioritize interoperability (2024)
- Vendors absorb higher customization costs
Referenceability and peer networks
Public-sector buyers, who oversee public procurement that OECD estimates at about 12% of GDP in 2024, rely heavily on references and consortium endorsements, so strong references lower perceived risk and reduce buyer power. Negative outcomes from a single implementation can cascade across regions, increasing scrutiny and bargaining leverage. Conversely, a few poor implementations amplify buyer negotiating strength and can force tougher contract terms.
- References reduce perceived risk — lowers buyer power
- High-profile failures cascade — raise buyer leverage
- Poor implementations (even few) strengthen buyer negotiation
Buyers lead: ~12% GDP; EU €2T; >60% want interop
Buyers hold strong leverage: public procurement is ~12% of GDP (OECD 2024) and EU public market ~€2 trillion, driving strict SLAs, price pressure and MFN clauses. Switching costs (migration, retraining) create incumbency but reprocurements every 3–7 years and GDPR portability limit lock‑in. Over 60% of enterprises (2024) demand interoperability, shifting customization costs to vendors.
| Metric | Value (2024) |
|---|---|
| Public procurement share (OECD) | ~12% GDP |
| EU public market | €2 trillion |
| Reprocurement cycle | 3–7 years |
| Interoperability priority | >60% |
What You See Is What You Get
Strategy Porter's Five Forces Analysis
This preview shows the exact Strategy Porter’s Five Forces Analysis you'll receive after purchase—no placeholders or mockups. The concise report covers competitive rivalry, supplier power, buyer power, threat of substitution, and barriers to entry with clear scoring and actionable insights. It's fully formatted and ready for immediate download and use.
Original: $10.00
-65%$10.00
$3.50Description
From Overview to Strategy Blueprint
Porter’s Five Forces analysis of Strategy reveals how supplier/buyer power, rivalry, substitutes and entry threats shape profitability and positioning. This snapshot highlights key pressures and competitive levers you must monitor. Unlock the full report for force-by-force ratings, visuals, and actionable recommendations to inform investment or strategic decisions.
Suppliers Bargaining Power
Cloud IaaS dependence
Questica depends on hyperscalers for hosting, compute and databases, concentrating supply: AWS ~32%, Azure ~23% and Google Cloud ~11% of the IaaS market in 2024, giving few providers outsized leverage. Price shifts or reserved‑instance policies can compress margins, with enterprise cloud spend still rising ~20% YoY in 2024, amplifying cost exposure. Multi‑cloud or reserved capacity can mitigate risk but switching is costly and complex, while outages and tight SLAs materially shape negotiating leverage.
Data integration and ERP connectors
Critical connectors to ERPs such as Oracle, SAP, Tyler and Workday are specialized, with SAP and Oracle dominating enterprise footprints; industry reports in 2024 show integration work can consume roughly 30–40% of ERP implementation budgets. API access terms, certification programs and partner tiers create bottlenecks and vendors may change APIs or impose fees, raising switching costs. Building and maintaining adapters demands ongoing engineering resources and recurring operating expense.
Security, compliance, and audit vendors
SOC 2 and ISO 27001 require third-party auditors and tools, typically costing $20k–$100k for SOC 2 and $10k–$50k for ISO 27001, while government attestations (eg FedRAMP) can reach $250k–$1M and add 6–18 months. These suppliers can raise costs and timelines, especially for public-sector deals; annual audit cadence locks in predictable spend (often 10–20% of security budgets), and continuous monitoring needs reduce buyer bargaining leverage.
Implementation and services partners
Regional SIs and consultancies shape peak delivery capacity; 2024 IT services market ≈$1.35T with SI-driven projects ~40%. Scarcity of public-sector specialists raised rates by ~20–50% in 2024. Strong partner ecosystems diversify risk but require MDF and 10–25% margin sharing. Losing a key partner can slow deployments by months and cut win rates.
- Dependence: regional SIs set delivery ceiling
- Cost: public-sector premiums +20–50%
- Economics: MDF and 10–25% margin sharing
- Risk: partner loss → delayed rollouts, lower wins
Specialized talent and SaaS tooling
Engineers with budgeting, forecasting, and government-domain expertise remain scarce, raising labor supplier power as larger SaaS firms outbid startups in compensation cycles; 2024 tech turnover averaged about 25%, intensifying recruitment pressure. Concentrated costs from CI/CD, observability, and data pipeline vendors—part of a global SaaS market ~197 billion in 2024—further strengthen supplier leverage. Retention programs lower churn but do not remove this bargaining power.
- Limited specialist talent increases wage pressure
- ~25% tech turnover in 2024 raises hiring costs
- $197B global SaaS market (2024) reflects vendor pricing power
- Retention helps but cannot fully negate supplier leverage
Hyperscalers, compliance costs and talent squeeze margins, raising switching costs
Suppliers hold strong leverage: hyperscaler concentration (AWS 32%, Azure 23%, GCP 11% in 2024) and ~20% YoY cloud spend growth compress margins and raise switching costs. ERP connectors, third‑party auditors (SOC 2 $20k–$100k; FedRAMP $250k–$1M) and regional SIs (IT services ~$1.35T; SI projects ~40%) create integration bottlenecks. Talent scarcity (≈25% tech turnover in 2024) and SaaS vendor pricing (~$197B market) further strengthen supplier power.
| Item | 2024 Data |
|---|---|
| Hyperscaler share | AWS 32% / Azure 23% / GCP 11% |
| Cloud spend growth | ~20% YoY |
| SOC 2 cost | $20k–$100k |
| FedRAMP cost | $250k–$1M |
| Tech turnover | ~25% |
| IT services market | $1.35T (SI ~40%) |
| Global SaaS market | $197B |
What is included in the product
Detailed Word Document
Uncovers competitive drivers, supplier/buyer power, entry barriers and substitutes affecting Strategy, highlighting disruptive threats and market dynamics. Delivered as a fully editable Word analysis with data-backed insights for business plans, investor materials, internal strategy decks or academic use.
Customizable Excel Spreadsheet
A one-sheet Porter's Five Forces template that translates complex competitive dynamics into clear, actionable pressure scores—ideal for quick strategic decisions, investor decks, and boardroom alignment.
Customers Bargaining Power
Public-sector procurement leverage
Government RFPs, framework agreements and multi-year contracts concentrate buyer power—public procurement represents about 12% of GDP in OECD countries (OECD, 2024) and the EU public procurement market is roughly €2 trillion annually (EC, 2024). Buyers enforce strict SLAs, data residency and security requirements, while price transparency and intense bid competition compress vendor margins; negotiations commonly include caps, MFN clauses and long payment cycles.
High switching costs but formalized exits
Data migration, process redesign and staff retraining create high switching costs that reinforce incumbency but are mitigated by public procurement rules and GDPR-driven data portability and mandated exit plans. Incumbents gain advantage in rebids yet lose absolute lock-in as reprocurements typically occur every 3-7 years and face scrutiny. Renewal pricing must anticipate council and auditor review.
Budget constraints and cyclical timing
Fiscal calendars and appropriations (US federal FY2024 began Oct 1, 2023) constrain pricing flexibility, forcing vendors to offer discounts or phased rollouts to fit funding windows. Procurement delays commonly push deals into the next fiscal year, giving buyers timing leverage. Emphasizing total cost of ownership and clear ROI is critical to accelerate approvals and capture budgeted spend.
Demand for interoperability and transparency
Buyers now demand seamless integration with ERP, HR and BI systems and expect open data, audit trails and real-time performance dashboards; by 2024 over 60% of enterprise buyers ranked interoperability and transparency among top purchasing criteria. Failure to meet these standards triggers rapid down-selection, and shifting integration/customization costs onto vendors increases buyer leverage.
- Seamless ERP/HR/BI integration required
- Open data, audit trails, dashboards non-negotiable
- Over 60% of enterprises prioritize interoperability (2024)
- Vendors absorb higher customization costs
Referenceability and peer networks
Public-sector buyers, who oversee public procurement that OECD estimates at about 12% of GDP in 2024, rely heavily on references and consortium endorsements, so strong references lower perceived risk and reduce buyer power. Negative outcomes from a single implementation can cascade across regions, increasing scrutiny and bargaining leverage. Conversely, a few poor implementations amplify buyer negotiating strength and can force tougher contract terms.
- References reduce perceived risk — lowers buyer power
- High-profile failures cascade — raise buyer leverage
- Poor implementations (even few) strengthen buyer negotiation
Buyers lead: ~12% GDP; EU €2T; >60% want interop
Buyers hold strong leverage: public procurement is ~12% of GDP (OECD 2024) and EU public market ~€2 trillion, driving strict SLAs, price pressure and MFN clauses. Switching costs (migration, retraining) create incumbency but reprocurements every 3–7 years and GDPR portability limit lock‑in. Over 60% of enterprises (2024) demand interoperability, shifting customization costs to vendors.
| Metric | Value (2024) |
|---|---|
| Public procurement share (OECD) | ~12% GDP |
| EU public market | €2 trillion |
| Reprocurement cycle | 3–7 years |
| Interoperability priority | >60% |
What You See Is What You Get
Strategy Porter's Five Forces Analysis
This preview shows the exact Strategy Porter’s Five Forces Analysis you'll receive after purchase—no placeholders or mockups. The concise report covers competitive rivalry, supplier power, buyer power, threat of substitution, and barriers to entry with clear scoring and actionable insights. It's fully formatted and ready for immediate download and use.











