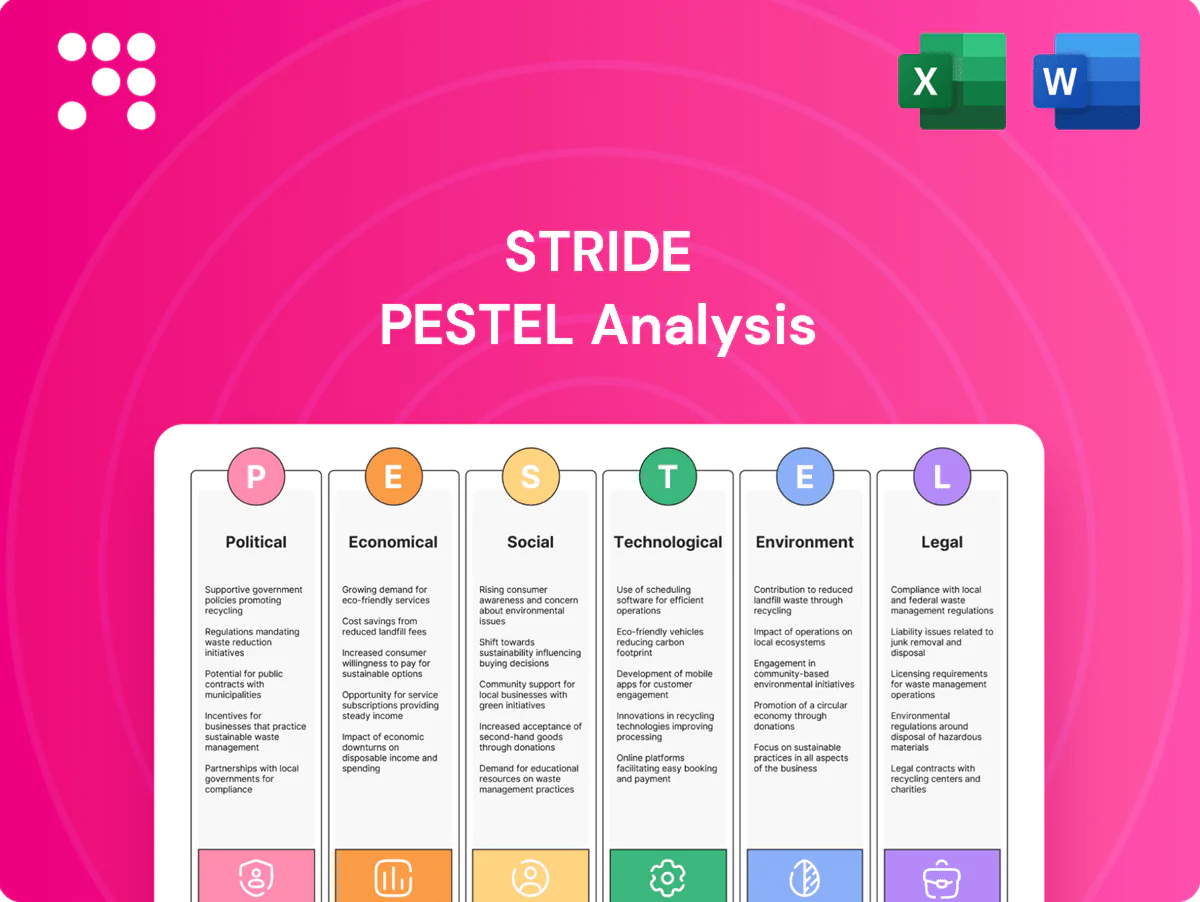
Stride PESTLE Analysis

Plan Smarter. Present Sharper. Compete Stronger.
Discover how political shifts, economic trends, social changes, and tech risks are shaping Stride’s future in our concise PESTLE snapshot—then unlock the full, actionable report for investor-ready insights, regulatory risk maps, and strategic recommendations. Purchase the complete PESTLE now for instant download and boardroom-ready analysis.
Political factors

Public education policy
Funding and authorization for virtual programs hinge on state and district policies, affecting reimbursement and enrollment rules. Shifts in school choice, charter statutes and virtual-school caps can open or restrict markets—charter enrollment is roughly 3.5 million students nationally. Federal priorities like the American Rescue Plan ESSER funding of $122 billion steer learning recovery and workforce development adoption. Close engagement with policymakers mitigates abrupt regulatory shifts.
Appropriations and grants
Variability in federal/state appropriations—district per-pupil spending averaged ~$16,000 (2022–23)—changes purchasing power. Expiring ESSER relief (total ~$190B) pressures 2024–25 budgets and renewals. Competitive grants (Perkins ~$1.3B, WIOA adult ~$3.6B) can fuel CTE/upskilling; Stride must align offerings to eligible use cases to capture funds.

Political polarization
Debates over curriculum, DEI, and parental rights influence vendor selection across roughly 13,000 U.S. school districts, with content scrutiny prompting adoption delays or local mandates that extend procurement timelines. Clear, customizable curricula enable alignment with diverse local preferences and reduce implementation friction. Neutral positioning and modular content lower reputational and legal risk for vendors.

Rural and broadband agendas
Rural broadband initiatives, led by the $42.45 billion BEAD program, expand Stride’s addressable markets as FCC estimates ~14.5 million Americans lacked fixed broadband in 2023. Governors’ digital equity plans that prioritize virtual learning increase state procurement opportunities. Public-private partnerships improve last-mile access, and measurable student outcomes bolster chances of continued public funding.
International expansion risk
International expansion for Stride faces layered approvals and localization mandates from multiple ministries, with 100+ countries enforcing data localization rules by 2024, adding compliance costs and timeline risk. Geopolitical tensions—notably US-China tech frictions—threaten cross-border content and data flows, while currency controls and procurement regulations force careful commercial structuring. Pilot-led market entry reduces exposure and limits upfront spend and regulatory commitment.
- Regulatory complexity: multiple ministry approvals
- Data risk: 100+ countries with localization (2024)
- Financial structuring: FX and procurement constraints
- Mitigation: pilot-led entry to limit exposure
Expiring $190B ESSER, BEAD $42B, 14.5M unconnected
State and district policy, charter and school-choice shifts, and federal priorities (ESSER/ARPA) materially shape reimbursement and enrollment; charter enrollment ≈3.5M. District per-pupil spend ~ $16,000 (2022–23) while ESSER relief ≈ $190B is expiring. BEAD $42.45B and ~14.5M without fixed broadband (2023) widen addressable markets. 100+ countries had data localization rules by 2024, raising compliance costs.
| Item | Value |
|---|---|
| Charter enrollment | ~3.5M |
| Per-pupil spend (2022–23) | ~$16,000 |
| ESSER relief | ~$190B (expiring) |
| BEAD | $42.45B |
| Without fixed broadband (2023) | ~14.5M |
| Data localization (2024) | 100+ countries |
What is included in the product
 Detailed Word Document
Explores how external macro-environmental factors uniquely affect the Stride across Political, Economic, Social, Technological, Environmental, and Legal dimensions, with data-driven context and current trends. Designed for executives, consultants, and investors, the analysis highlights threats, opportunities, and forward-looking scenarios ready for inclusion in plans, pitch decks, or reports.

 Customizable Excel Spreadsheet
A compact, visually segmented Stride PESTLE summary that can be dropped into presentations or shared across teams, allowing users to annotate for region- or business-specific insights and streamline external risk and market-positioning discussions during planning sessions.
Economic factors

K-12 budget cycles
Procurement tied to district fiscal-year calendars (commonly July 1–June 30) forces purchases to await annual budget adoption, elongating sales cycles and pushing many deals across fiscal years; U.S. public K–12 current expenditures totaled about $858 billion in 2021–22 (NCES). Budget tightening shifts demand toward lower-cost, scalable solutions, while multi-year contracts stabilize revenue during downturns. Flexible pricing and clear ROI proofs measurably improve close rates for vendors.
Macroeconomic volatility
Economic volatility drives higher reskilling demand during downturns, supporting Stride’s adult-learning pipeline, while inflation—U.S. CPI remained above 3% in 2024—raises district operating costs and squeezes vendor margins. Elevated policy rates near 5% in 2024–25 increase public financing costs and Stride’s capital expenses. Maintaining operational efficiency is critical to protect unit economics and margins.

Labor market dynamics
Teacher shortages—UNESCO estimates 69 million additional teachers needed by 2030 and Education Week reported widespread K–12 staffing gaps in 2023–24—boost demand for virtual staffing and course coverage. Employer skills gaps elevate CTE and career-pathway investments as companies report persistent hard-skill deficits. Funded employer partnerships and measurable placement outcomes reinforce Stride’s value proposition.

Household affordability
Household affordability constrains uptake of private-pay programs and tutoring as US median household income was $74,580 in 2023 and outstanding US student loan debt reached about $1.7 trillion by 2024, increasing price sensitivity; scholarships and financing expand access in price-elastic segments, bundled offerings raise perceived value, and transparent outcomes justify premiums.
- Consumer sensitivity: private-pay exposure
- Financing: expands price-elastic demand
- Bundling: boosts perceived value
- Outcomes: support premium pricing
Scale and fixed costs
Content and platform fixed costs amortize as enrollment scales, reducing unit costs; utilization swings can move gross margin by several percentage points, while public cloud spend rose ~20% YoY in 2024 so must track seasonality; data-driven capacity planning preserved margins in firms that tied spend to demand.
- Amortization: lower unit cost with scale
- Utilization: drives margin variability
- Cloud: ~20% YoY growth in 2024
- Planning: data-driven preserves margins
Expiring $190B ESSER, BEAD $42B, 14.5M unconnected
Procurement tied to July–June budgets lengthens sales cycles and shifts demand to lower-cost, multi-year contracts; public K–12 spend was ~$858B (2021–22). Inflation (>3% in 2024) and policy rates (~5% in 2024–25) squeeze margins and raise capital costs. Teacher shortages and household affordability (median income $74,580 in 2023; $1.7T student debt in 2024) drive demand for scalable virtual staffing and financing.
| Metric | Value / Year |
|---|---|
| U.S. K–12 current expend. | $858B / 2021–22 |
| CPI | >3% / 2024 |
| Policy rates | ~5% / 2024–25 |
| Median HH income | $74,580 / 2023 |
| Student debt | $1.7T / 2024 |
| Cloud spend growth | +20% YoY / 2024 |
| Teacher gap | 69M needed by 2030 |
Full Version Awaits
Stride PESTLE Analysis
The preview shown here is the exact Stride PESTLE Analysis you’ll receive after purchase—fully formatted and ready to use. The layout, content, and structure visible are identical to the downloadable file, with no placeholders or surprises. After payment you’ll instantly get this exact, professionally structured document.

Plan Smarter. Present Sharper. Compete Stronger.
Discover how political shifts, economic trends, social changes, and tech risks are shaping Stride’s future in our concise PESTLE snapshot—then unlock the full, actionable report for investor-ready insights, regulatory risk maps, and strategic recommendations. Purchase the complete PESTLE now for instant download and boardroom-ready analysis.
Political factors
Public education policy
Funding and authorization for virtual programs hinge on state and district policies, affecting reimbursement and enrollment rules. Shifts in school choice, charter statutes and virtual-school caps can open or restrict markets—charter enrollment is roughly 3.5 million students nationally. Federal priorities like the American Rescue Plan ESSER funding of $122 billion steer learning recovery and workforce development adoption. Close engagement with policymakers mitigates abrupt regulatory shifts.
Appropriations and grants
Variability in federal/state appropriations—district per-pupil spending averaged ~$16,000 (2022–23)—changes purchasing power. Expiring ESSER relief (total ~$190B) pressures 2024–25 budgets and renewals. Competitive grants (Perkins ~$1.3B, WIOA adult ~$3.6B) can fuel CTE/upskilling; Stride must align offerings to eligible use cases to capture funds.
Political polarization
Debates over curriculum, DEI, and parental rights influence vendor selection across roughly 13,000 U.S. school districts, with content scrutiny prompting adoption delays or local mandates that extend procurement timelines. Clear, customizable curricula enable alignment with diverse local preferences and reduce implementation friction. Neutral positioning and modular content lower reputational and legal risk for vendors.
Rural and broadband agendas
Rural broadband initiatives, led by the $42.45 billion BEAD program, expand Stride’s addressable markets as FCC estimates ~14.5 million Americans lacked fixed broadband in 2023. Governors’ digital equity plans that prioritize virtual learning increase state procurement opportunities. Public-private partnerships improve last-mile access, and measurable student outcomes bolster chances of continued public funding.
International expansion risk
International expansion for Stride faces layered approvals and localization mandates from multiple ministries, with 100+ countries enforcing data localization rules by 2024, adding compliance costs and timeline risk. Geopolitical tensions—notably US-China tech frictions—threaten cross-border content and data flows, while currency controls and procurement regulations force careful commercial structuring. Pilot-led market entry reduces exposure and limits upfront spend and regulatory commitment.
- Regulatory complexity: multiple ministry approvals
- Data risk: 100+ countries with localization (2024)
- Financial structuring: FX and procurement constraints
- Mitigation: pilot-led entry to limit exposure
Expiring $190B ESSER, BEAD $42B, 14.5M unconnected
State and district policy, charter and school-choice shifts, and federal priorities (ESSER/ARPA) materially shape reimbursement and enrollment; charter enrollment ≈3.5M. District per-pupil spend ~ $16,000 (2022–23) while ESSER relief ≈ $190B is expiring. BEAD $42.45B and ~14.5M without fixed broadband (2023) widen addressable markets. 100+ countries had data localization rules by 2024, raising compliance costs.
| Item | Value |
|---|---|
| Charter enrollment | ~3.5M |
| Per-pupil spend (2022–23) | ~$16,000 |
| ESSER relief | ~$190B (expiring) |
| BEAD | $42.45B |
| Without fixed broadband (2023) | ~14.5M |
| Data localization (2024) | 100+ countries |
What is included in the product
Detailed Word Document
Explores how external macro-environmental factors uniquely affect the Stride across Political, Economic, Social, Technological, Environmental, and Legal dimensions, with data-driven context and current trends. Designed for executives, consultants, and investors, the analysis highlights threats, opportunities, and forward-looking scenarios ready for inclusion in plans, pitch decks, or reports.
Customizable Excel Spreadsheet
A compact, visually segmented Stride PESTLE summary that can be dropped into presentations or shared across teams, allowing users to annotate for region- or business-specific insights and streamline external risk and market-positioning discussions during planning sessions.
Economic factors
K-12 budget cycles
Procurement tied to district fiscal-year calendars (commonly July 1–June 30) forces purchases to await annual budget adoption, elongating sales cycles and pushing many deals across fiscal years; U.S. public K–12 current expenditures totaled about $858 billion in 2021–22 (NCES). Budget tightening shifts demand toward lower-cost, scalable solutions, while multi-year contracts stabilize revenue during downturns. Flexible pricing and clear ROI proofs measurably improve close rates for vendors.
Macroeconomic volatility
Economic volatility drives higher reskilling demand during downturns, supporting Stride’s adult-learning pipeline, while inflation—U.S. CPI remained above 3% in 2024—raises district operating costs and squeezes vendor margins. Elevated policy rates near 5% in 2024–25 increase public financing costs and Stride’s capital expenses. Maintaining operational efficiency is critical to protect unit economics and margins.
Labor market dynamics
Teacher shortages—UNESCO estimates 69 million additional teachers needed by 2030 and Education Week reported widespread K–12 staffing gaps in 2023–24—boost demand for virtual staffing and course coverage. Employer skills gaps elevate CTE and career-pathway investments as companies report persistent hard-skill deficits. Funded employer partnerships and measurable placement outcomes reinforce Stride’s value proposition.
Household affordability
Household affordability constrains uptake of private-pay programs and tutoring as US median household income was $74,580 in 2023 and outstanding US student loan debt reached about $1.7 trillion by 2024, increasing price sensitivity; scholarships and financing expand access in price-elastic segments, bundled offerings raise perceived value, and transparent outcomes justify premiums.
- Consumer sensitivity: private-pay exposure
- Financing: expands price-elastic demand
- Bundling: boosts perceived value
- Outcomes: support premium pricing
Scale and fixed costs
Content and platform fixed costs amortize as enrollment scales, reducing unit costs; utilization swings can move gross margin by several percentage points, while public cloud spend rose ~20% YoY in 2024 so must track seasonality; data-driven capacity planning preserved margins in firms that tied spend to demand.
- Amortization: lower unit cost with scale
- Utilization: drives margin variability
- Cloud: ~20% YoY growth in 2024
- Planning: data-driven preserves margins
Expiring $190B ESSER, BEAD $42B, 14.5M unconnected
Procurement tied to July–June budgets lengthens sales cycles and shifts demand to lower-cost, multi-year contracts; public K–12 spend was ~$858B (2021–22). Inflation (>3% in 2024) and policy rates (~5% in 2024–25) squeeze margins and raise capital costs. Teacher shortages and household affordability (median income $74,580 in 2023; $1.7T student debt in 2024) drive demand for scalable virtual staffing and financing.
| Metric | Value / Year |
|---|---|
| U.S. K–12 current expend. | $858B / 2021–22 |
| CPI | >3% / 2024 |
| Policy rates | ~5% / 2024–25 |
| Median HH income | $74,580 / 2023 |
| Student debt | $1.7T / 2024 |
| Cloud spend growth | +20% YoY / 2024 |
| Teacher gap | 69M needed by 2030 |
Full Version Awaits
Stride PESTLE Analysis
The preview shown here is the exact Stride PESTLE Analysis you’ll receive after purchase—fully formatted and ready to use. The layout, content, and structure visible are identical to the downloadable file, with no placeholders or surprises. After payment you’ll instantly get this exact, professionally structured document.
Description
Plan Smarter. Present Sharper. Compete Stronger.
Discover how political shifts, economic trends, social changes, and tech risks are shaping Stride’s future in our concise PESTLE snapshot—then unlock the full, actionable report for investor-ready insights, regulatory risk maps, and strategic recommendations. Purchase the complete PESTLE now for instant download and boardroom-ready analysis.
Political factors
Public education policy
Funding and authorization for virtual programs hinge on state and district policies, affecting reimbursement and enrollment rules. Shifts in school choice, charter statutes and virtual-school caps can open or restrict markets—charter enrollment is roughly 3.5 million students nationally. Federal priorities like the American Rescue Plan ESSER funding of $122 billion steer learning recovery and workforce development adoption. Close engagement with policymakers mitigates abrupt regulatory shifts.
Appropriations and grants
Variability in federal/state appropriations—district per-pupil spending averaged ~$16,000 (2022–23)—changes purchasing power. Expiring ESSER relief (total ~$190B) pressures 2024–25 budgets and renewals. Competitive grants (Perkins ~$1.3B, WIOA adult ~$3.6B) can fuel CTE/upskilling; Stride must align offerings to eligible use cases to capture funds.
Political polarization
Debates over curriculum, DEI, and parental rights influence vendor selection across roughly 13,000 U.S. school districts, with content scrutiny prompting adoption delays or local mandates that extend procurement timelines. Clear, customizable curricula enable alignment with diverse local preferences and reduce implementation friction. Neutral positioning and modular content lower reputational and legal risk for vendors.
Rural and broadband agendas
Rural broadband initiatives, led by the $42.45 billion BEAD program, expand Stride’s addressable markets as FCC estimates ~14.5 million Americans lacked fixed broadband in 2023. Governors’ digital equity plans that prioritize virtual learning increase state procurement opportunities. Public-private partnerships improve last-mile access, and measurable student outcomes bolster chances of continued public funding.
International expansion risk
International expansion for Stride faces layered approvals and localization mandates from multiple ministries, with 100+ countries enforcing data localization rules by 2024, adding compliance costs and timeline risk. Geopolitical tensions—notably US-China tech frictions—threaten cross-border content and data flows, while currency controls and procurement regulations force careful commercial structuring. Pilot-led market entry reduces exposure and limits upfront spend and regulatory commitment.
- Regulatory complexity: multiple ministry approvals
- Data risk: 100+ countries with localization (2024)
- Financial structuring: FX and procurement constraints
- Mitigation: pilot-led entry to limit exposure
Expiring $190B ESSER, BEAD $42B, 14.5M unconnected
State and district policy, charter and school-choice shifts, and federal priorities (ESSER/ARPA) materially shape reimbursement and enrollment; charter enrollment ≈3.5M. District per-pupil spend ~ $16,000 (2022–23) while ESSER relief ≈ $190B is expiring. BEAD $42.45B and ~14.5M without fixed broadband (2023) widen addressable markets. 100+ countries had data localization rules by 2024, raising compliance costs.
| Item | Value |
|---|---|
| Charter enrollment | ~3.5M |
| Per-pupil spend (2022–23) | ~$16,000 |
| ESSER relief | ~$190B (expiring) |
| BEAD | $42.45B |
| Without fixed broadband (2023) | ~14.5M |
| Data localization (2024) | 100+ countries |
What is included in the product
Detailed Word Document
Explores how external macro-environmental factors uniquely affect the Stride across Political, Economic, Social, Technological, Environmental, and Legal dimensions, with data-driven context and current trends. Designed for executives, consultants, and investors, the analysis highlights threats, opportunities, and forward-looking scenarios ready for inclusion in plans, pitch decks, or reports.
Customizable Excel Spreadsheet
A compact, visually segmented Stride PESTLE summary that can be dropped into presentations or shared across teams, allowing users to annotate for region- or business-specific insights and streamline external risk and market-positioning discussions during planning sessions.
Economic factors
K-12 budget cycles
Procurement tied to district fiscal-year calendars (commonly July 1–June 30) forces purchases to await annual budget adoption, elongating sales cycles and pushing many deals across fiscal years; U.S. public K–12 current expenditures totaled about $858 billion in 2021–22 (NCES). Budget tightening shifts demand toward lower-cost, scalable solutions, while multi-year contracts stabilize revenue during downturns. Flexible pricing and clear ROI proofs measurably improve close rates for vendors.
Macroeconomic volatility
Economic volatility drives higher reskilling demand during downturns, supporting Stride’s adult-learning pipeline, while inflation—U.S. CPI remained above 3% in 2024—raises district operating costs and squeezes vendor margins. Elevated policy rates near 5% in 2024–25 increase public financing costs and Stride’s capital expenses. Maintaining operational efficiency is critical to protect unit economics and margins.
Labor market dynamics
Teacher shortages—UNESCO estimates 69 million additional teachers needed by 2030 and Education Week reported widespread K–12 staffing gaps in 2023–24—boost demand for virtual staffing and course coverage. Employer skills gaps elevate CTE and career-pathway investments as companies report persistent hard-skill deficits. Funded employer partnerships and measurable placement outcomes reinforce Stride’s value proposition.
Household affordability
Household affordability constrains uptake of private-pay programs and tutoring as US median household income was $74,580 in 2023 and outstanding US student loan debt reached about $1.7 trillion by 2024, increasing price sensitivity; scholarships and financing expand access in price-elastic segments, bundled offerings raise perceived value, and transparent outcomes justify premiums.
- Consumer sensitivity: private-pay exposure
- Financing: expands price-elastic demand
- Bundling: boosts perceived value
- Outcomes: support premium pricing
Scale and fixed costs
Content and platform fixed costs amortize as enrollment scales, reducing unit costs; utilization swings can move gross margin by several percentage points, while public cloud spend rose ~20% YoY in 2024 so must track seasonality; data-driven capacity planning preserved margins in firms that tied spend to demand.
- Amortization: lower unit cost with scale
- Utilization: drives margin variability
- Cloud: ~20% YoY growth in 2024
- Planning: data-driven preserves margins
Expiring $190B ESSER, BEAD $42B, 14.5M unconnected
Procurement tied to July–June budgets lengthens sales cycles and shifts demand to lower-cost, multi-year contracts; public K–12 spend was ~$858B (2021–22). Inflation (>3% in 2024) and policy rates (~5% in 2024–25) squeeze margins and raise capital costs. Teacher shortages and household affordability (median income $74,580 in 2023; $1.7T student debt in 2024) drive demand for scalable virtual staffing and financing.
| Metric | Value / Year |
|---|---|
| U.S. K–12 current expend. | $858B / 2021–22 |
| CPI | >3% / 2024 |
| Policy rates | ~5% / 2024–25 |
| Median HH income | $74,580 / 2023 |
| Student debt | $1.7T / 2024 |
| Cloud spend growth | +20% YoY / 2024 |
| Teacher gap | 69M needed by 2030 |
Full Version Awaits
Stride PESTLE Analysis
The preview shown here is the exact Stride PESTLE Analysis you’ll receive after purchase—fully formatted and ready to use. The layout, content, and structure visible are identical to the downloadable file, with no placeholders or surprises. After payment you’ll instantly get this exact, professionally structured document.











