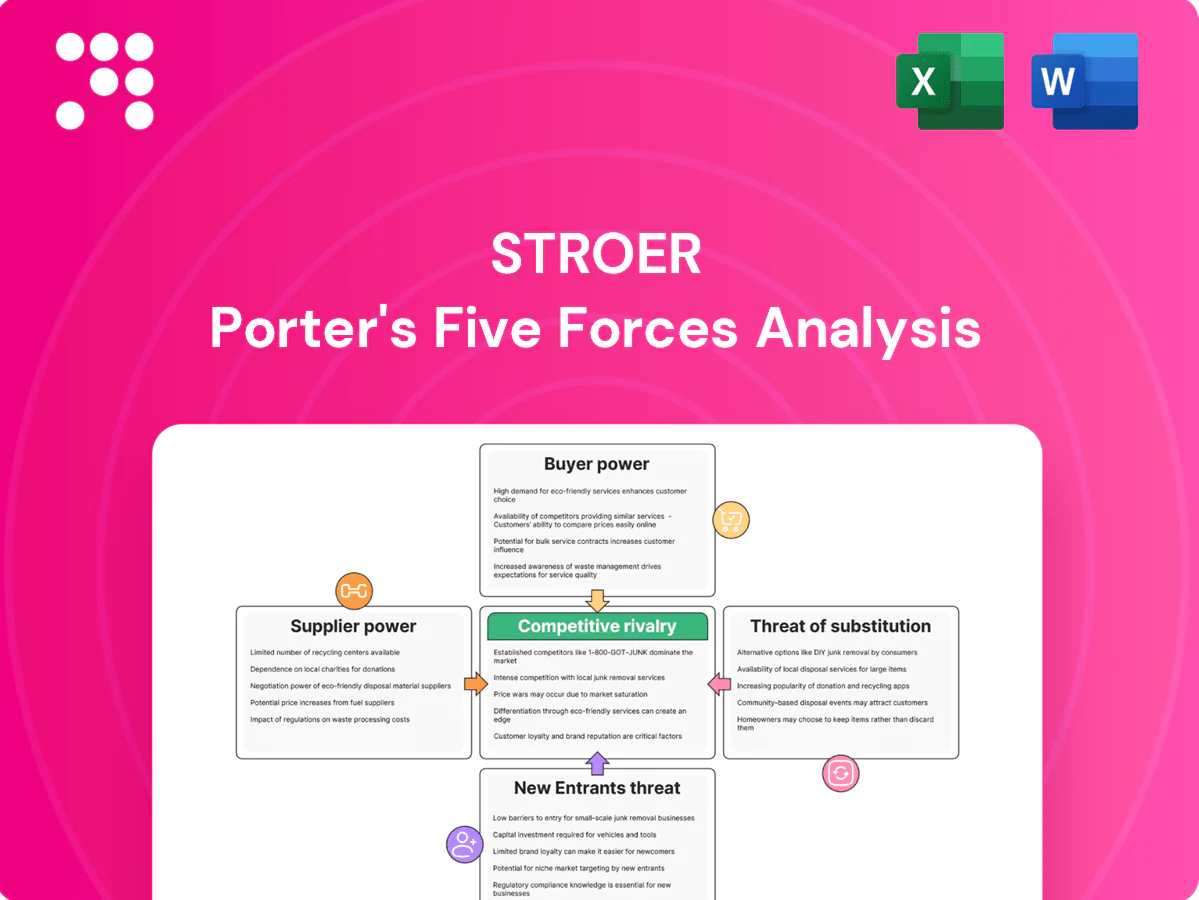
Stroer Porter's Five Forces Analysis

Elevate Your Analysis with the Complete Porter's Five Forces Analysis
Stroer faces intense buyer scrutiny, evolving ad tech substitutes, and concentrated supplier relationships that shape its margins and growth prospects; regulatory shifts add further pressure. This brief snapshot only scratches the surface—unlock the full Porter's Five Forces Analysis to explore Stroer’s competitive dynamics, market pressures, and strategic advantages in detail.
Suppliers Bargaining Power

Supplier Power 1
Site access hinges on concessions and permits from a limited set of municipalities and transport authorities — Germany has around 11,000 municipalities, but prime urban sites are concentrated and thus tightly controlled. Long-duration exclusive contracts (typically 5–15 years) lock terms, yet renewals commonly trigger competitive tenders under public procurement rules, increasing bidding pressure. Regulatory priorities — safety, aesthetics and 2024‑era sustainability standards such as Green Public Procurement — further shift leverage toward public authorities.
Supplier Power 2
Landlords for prime private placements are scarce and location-specific, concentrating negotiating power in top city centers where Ströer faces higher rents; Ströer operates around 400,000 advertising sites, allowing selective exposure management. Scarcity in central districts elevates rental pressure and leverage for landlords. A broad portfolio lets Ströer walk away from uneconomic sites. Long-term leases partially stabilize costs but limit short-term flexibility.

Supplier Power 3
Hardware vendors for digital screens and street furniture command leverage because certified components and bespoke integration raise switching costs, even as standardization (driving ~8% annual component commoditization in 2024) reduces dependency; volume purchasing and multi-sourcing lowered price pressure for major operators, while concentrated spare-parts markets and three- to five-year upgrade cycles reintroduce vendor bargaining power.

Supplier Power 4
Installation, maintenance and field service providers directly affect Ströer uptime and quality; service interruptions reduce OOH availability while local labor constraints and union rules in some German markets can increase operating costs. Ströer’s substantial in‑house installation teams and long‑term scale contracts in 2024 limit reliance on any single supplier, and performance‑based SLAs cap supplier leverage.
- Supplier influence: installation & service
- Cost pressure: local labor & unions
- Mitigation: in‑house teams, scale contracts (2024)
- Controls: performance-based SLAs
Supplier Power 5
Data, programmatic platforms, and audience measurement partners increasingly determine digital OOH monetization; verified measurement and premium data remain concentrated among a few dominant providers, limiting supplier leverage despite interoperability.
Ströer’s proprietary data assets and platform integrations mitigate supplier power, but shifts in measurement standards can rapidly transfer value to external data suppliers and measurement vendors.
- Concentration: few verified measurers control premium metrics
- Counterbalance: Ströer-owned data/platforms reduce dependency
- Risk: standard changes can reallocate revenue to data suppliers
Moderate-high supplier power: municipalities, long concessions and concentrated measurement vendors
Supplier power is moderate-high: municipal/landlord control of prime sites (Germany ~11,000 municipalities; Ströer ~400,000 sites) and long concessions (5–15 yrs) concentrate leverage. Tech vendors exert pricing power despite ~8% annual component commoditization in 2024; measurement/data remain concentrated (top 3 vendors). Ströer scale and proprietary data partially offset risks.
| Metric | Value | Impact |
|---|---|---|
| Municipal count | 11,000 | Site control |
| Ströer sites | 400,000 | Negotiating scale |
| Component commod. | ≈8% (2024) | Lower vendor power |
| Top measurers | 3 | Data concentration |
What is included in the product
 Detailed Word Document
Tailored Porter's Five Forces assessment for Ströer that uncovers competitive drivers, buyer/supplier power, entry barriers, substitutes and disruptive threats, with strategic commentary on how these forces affect Ströer's pricing, profitability and market positioning.

 Customizable Excel Spreadsheet
Relieves analysis overload with a Stroer Porter's Five Forces one-sheet that clearly maps advertising-market pressures and competitive threats for rapid decision-making. Editable metrics and an instant radar chart make scenario comparisons and board-ready slides effortless.
Customers Bargaining Power

Buyer Power 1
In 2024 large advertisers and media buying groups continued centralizing budgets, increasing negotiating leverage over Ströer by demanding deeper discounts, audience guarantees and integrated cross-channel packages. Framework agreements and volume commitments trade lower CPMs for share-of-wallet, pressuring margins. Ströer’s unique OOH and premium digital sites soften but do not eliminate buyer power.
Buyer Power 2
Advertisers can multi-home across OOH rivals and digital channels, increasing price sensitivity as digital ad spend topped about $600bn in 2024 and cross‑channel buying rose. Substitutable reach lets buyers reallocate spend quickly, with programmatic DOOH bookings growing ~30% in 2024, shortening campaign horizons. Short booking cycles for digital screens amplify tactical switching, while distinctive premium locations with scarce alternatives defend higher rates.

Buyer Power 3
Programmatic OOH transparency and real-time comparability boosted buyer leverage in 2024 as automated buys grew, pushing price discovery; auction dynamics compressed spot margins by up to 12% during demand lulls. Private marketplaces and guaranteed deals preserved yields, often delivering 30–50% higher revenue on premium inventory. Data-enriched audience segments supported CPM differentials around 25%, tempering buyer power.

Buyer Power 4
Buyer Power 4: cyclical sectors such as auto, retail and telecom drive demand volatility and intensify bargaining in downturns; in 2024 agencies increasingly consolidated spend to preferred partners for better terms. Ströer’s diversified client base and thousands of advertisers smooth cycles and limit concentration risk. Performance case studies and attribution tools reduce price haggling by proving ROI.
- Agencies consolidate spend to preferred partners
- Diversified client base limits concentration
- Attribution reduces bargaining through ROI proof
Buyer Power 5
Local SMEs exert limited individual leverage but remain highly price-sensitive and switch frequently; Ströer reported group revenue of about 1.84 billion EUR in 2023 and has pushed digital inventory above 60% by 2024, enabling scalable self-serve packages that protect yield. Bundling OOH with online assets raises perceived value and client lock-in, while geo-targeting and footfall-lift case studies (often showing double-digit ROI uplift) reduce discount demand.
- SME churn high, price sensitivity
- Self-serve + standardized packs preserve yield
- Bundling increases lock-in
- Geo-targeting & footfall proof curb discounts
Budgets/CPMs 12%, DOOH ~30%, digital >60%
In 2024 large advertisers and agencies centralized budgets, leveraging volume deals that compressed CPMs up to 12% while programmatic DOOH grew ~30%. Ströer reported €1.84bn revenue in 2023 and >60% digital inventory by 2024, enabling self-serve bundles that limit SME churn. Data-rich premium inventory and private marketplaces (30–50% higher yield) moderate buyer power.
| Metric | Value |
|---|---|
| Ströer revenue (2023) | €1.84bn |
| Digital inventory (2024) | >60% |
| Programmatic DOOH growth (2024) | ~30% |
| Spot margin compression | up to 12% |
| PM yield uplift | 30–50% |
Preview the Actual Deliverable
Stroer Porter's Five Forces Analysis
This preview shows the exact Stroer Porter's Five Forces analysis you’ll receive after purchase—no placeholders or summaries. It contains the full competitive assessment: supplier and buyer power, threat of entrants and substitutes, and rivalry intensity with strategic implications. Instant download and ready-to-use file upon payment.

Elevate Your Analysis with the Complete Porter's Five Forces Analysis
Stroer faces intense buyer scrutiny, evolving ad tech substitutes, and concentrated supplier relationships that shape its margins and growth prospects; regulatory shifts add further pressure. This brief snapshot only scratches the surface—unlock the full Porter's Five Forces Analysis to explore Stroer’s competitive dynamics, market pressures, and strategic advantages in detail.
Suppliers Bargaining Power
Supplier Power 1
Site access hinges on concessions and permits from a limited set of municipalities and transport authorities — Germany has around 11,000 municipalities, but prime urban sites are concentrated and thus tightly controlled. Long-duration exclusive contracts (typically 5–15 years) lock terms, yet renewals commonly trigger competitive tenders under public procurement rules, increasing bidding pressure. Regulatory priorities — safety, aesthetics and 2024‑era sustainability standards such as Green Public Procurement — further shift leverage toward public authorities.
Supplier Power 2
Landlords for prime private placements are scarce and location-specific, concentrating negotiating power in top city centers where Ströer faces higher rents; Ströer operates around 400,000 advertising sites, allowing selective exposure management. Scarcity in central districts elevates rental pressure and leverage for landlords. A broad portfolio lets Ströer walk away from uneconomic sites. Long-term leases partially stabilize costs but limit short-term flexibility.
Supplier Power 3
Hardware vendors for digital screens and street furniture command leverage because certified components and bespoke integration raise switching costs, even as standardization (driving ~8% annual component commoditization in 2024) reduces dependency; volume purchasing and multi-sourcing lowered price pressure for major operators, while concentrated spare-parts markets and three- to five-year upgrade cycles reintroduce vendor bargaining power.
Supplier Power 4
Installation, maintenance and field service providers directly affect Ströer uptime and quality; service interruptions reduce OOH availability while local labor constraints and union rules in some German markets can increase operating costs. Ströer’s substantial in‑house installation teams and long‑term scale contracts in 2024 limit reliance on any single supplier, and performance‑based SLAs cap supplier leverage.
- Supplier influence: installation & service
- Cost pressure: local labor & unions
- Mitigation: in‑house teams, scale contracts (2024)
- Controls: performance-based SLAs
Supplier Power 5
Data, programmatic platforms, and audience measurement partners increasingly determine digital OOH monetization; verified measurement and premium data remain concentrated among a few dominant providers, limiting supplier leverage despite interoperability.
Ströer’s proprietary data assets and platform integrations mitigate supplier power, but shifts in measurement standards can rapidly transfer value to external data suppliers and measurement vendors.
- Concentration: few verified measurers control premium metrics
- Counterbalance: Ströer-owned data/platforms reduce dependency
- Risk: standard changes can reallocate revenue to data suppliers
Moderate-high supplier power: municipalities, long concessions and concentrated measurement vendors
Supplier power is moderate-high: municipal/landlord control of prime sites (Germany ~11,000 municipalities; Ströer ~400,000 sites) and long concessions (5–15 yrs) concentrate leverage. Tech vendors exert pricing power despite ~8% annual component commoditization in 2024; measurement/data remain concentrated (top 3 vendors). Ströer scale and proprietary data partially offset risks.
| Metric | Value | Impact |
|---|---|---|
| Municipal count | 11,000 | Site control |
| Ströer sites | 400,000 | Negotiating scale |
| Component commod. | ≈8% (2024) | Lower vendor power |
| Top measurers | 3 | Data concentration |
What is included in the product
Detailed Word Document
Tailored Porter's Five Forces assessment for Ströer that uncovers competitive drivers, buyer/supplier power, entry barriers, substitutes and disruptive threats, with strategic commentary on how these forces affect Ströer's pricing, profitability and market positioning.
Customizable Excel Spreadsheet
Relieves analysis overload with a Stroer Porter's Five Forces one-sheet that clearly maps advertising-market pressures and competitive threats for rapid decision-making. Editable metrics and an instant radar chart make scenario comparisons and board-ready slides effortless.
Customers Bargaining Power
Buyer Power 1
In 2024 large advertisers and media buying groups continued centralizing budgets, increasing negotiating leverage over Ströer by demanding deeper discounts, audience guarantees and integrated cross-channel packages. Framework agreements and volume commitments trade lower CPMs for share-of-wallet, pressuring margins. Ströer’s unique OOH and premium digital sites soften but do not eliminate buyer power.
Buyer Power 2
Advertisers can multi-home across OOH rivals and digital channels, increasing price sensitivity as digital ad spend topped about $600bn in 2024 and cross‑channel buying rose. Substitutable reach lets buyers reallocate spend quickly, with programmatic DOOH bookings growing ~30% in 2024, shortening campaign horizons. Short booking cycles for digital screens amplify tactical switching, while distinctive premium locations with scarce alternatives defend higher rates.
Buyer Power 3
Programmatic OOH transparency and real-time comparability boosted buyer leverage in 2024 as automated buys grew, pushing price discovery; auction dynamics compressed spot margins by up to 12% during demand lulls. Private marketplaces and guaranteed deals preserved yields, often delivering 30–50% higher revenue on premium inventory. Data-enriched audience segments supported CPM differentials around 25%, tempering buyer power.
Buyer Power 4
Buyer Power 4: cyclical sectors such as auto, retail and telecom drive demand volatility and intensify bargaining in downturns; in 2024 agencies increasingly consolidated spend to preferred partners for better terms. Ströer’s diversified client base and thousands of advertisers smooth cycles and limit concentration risk. Performance case studies and attribution tools reduce price haggling by proving ROI.
- Agencies consolidate spend to preferred partners
- Diversified client base limits concentration
- Attribution reduces bargaining through ROI proof
Buyer Power 5
Local SMEs exert limited individual leverage but remain highly price-sensitive and switch frequently; Ströer reported group revenue of about 1.84 billion EUR in 2023 and has pushed digital inventory above 60% by 2024, enabling scalable self-serve packages that protect yield. Bundling OOH with online assets raises perceived value and client lock-in, while geo-targeting and footfall-lift case studies (often showing double-digit ROI uplift) reduce discount demand.
- SME churn high, price sensitivity
- Self-serve + standardized packs preserve yield
- Bundling increases lock-in
- Geo-targeting & footfall proof curb discounts
Budgets/CPMs 12%, DOOH ~30%, digital >60%
In 2024 large advertisers and agencies centralized budgets, leveraging volume deals that compressed CPMs up to 12% while programmatic DOOH grew ~30%. Ströer reported €1.84bn revenue in 2023 and >60% digital inventory by 2024, enabling self-serve bundles that limit SME churn. Data-rich premium inventory and private marketplaces (30–50% higher yield) moderate buyer power.
| Metric | Value |
|---|---|
| Ströer revenue (2023) | €1.84bn |
| Digital inventory (2024) | >60% |
| Programmatic DOOH growth (2024) | ~30% |
| Spot margin compression | up to 12% |
| PM yield uplift | 30–50% |
Preview the Actual Deliverable
Stroer Porter's Five Forces Analysis
This preview shows the exact Stroer Porter's Five Forces analysis you’ll receive after purchase—no placeholders or summaries. It contains the full competitive assessment: supplier and buyer power, threat of entrants and substitutes, and rivalry intensity with strategic implications. Instant download and ready-to-use file upon payment.
Original: $10.00
-65%$10.00
$3.50Description
Elevate Your Analysis with the Complete Porter's Five Forces Analysis
Stroer faces intense buyer scrutiny, evolving ad tech substitutes, and concentrated supplier relationships that shape its margins and growth prospects; regulatory shifts add further pressure. This brief snapshot only scratches the surface—unlock the full Porter's Five Forces Analysis to explore Stroer’s competitive dynamics, market pressures, and strategic advantages in detail.
Suppliers Bargaining Power
Supplier Power 1
Site access hinges on concessions and permits from a limited set of municipalities and transport authorities — Germany has around 11,000 municipalities, but prime urban sites are concentrated and thus tightly controlled. Long-duration exclusive contracts (typically 5–15 years) lock terms, yet renewals commonly trigger competitive tenders under public procurement rules, increasing bidding pressure. Regulatory priorities — safety, aesthetics and 2024‑era sustainability standards such as Green Public Procurement — further shift leverage toward public authorities.
Supplier Power 2
Landlords for prime private placements are scarce and location-specific, concentrating negotiating power in top city centers where Ströer faces higher rents; Ströer operates around 400,000 advertising sites, allowing selective exposure management. Scarcity in central districts elevates rental pressure and leverage for landlords. A broad portfolio lets Ströer walk away from uneconomic sites. Long-term leases partially stabilize costs but limit short-term flexibility.
Supplier Power 3
Hardware vendors for digital screens and street furniture command leverage because certified components and bespoke integration raise switching costs, even as standardization (driving ~8% annual component commoditization in 2024) reduces dependency; volume purchasing and multi-sourcing lowered price pressure for major operators, while concentrated spare-parts markets and three- to five-year upgrade cycles reintroduce vendor bargaining power.
Supplier Power 4
Installation, maintenance and field service providers directly affect Ströer uptime and quality; service interruptions reduce OOH availability while local labor constraints and union rules in some German markets can increase operating costs. Ströer’s substantial in‑house installation teams and long‑term scale contracts in 2024 limit reliance on any single supplier, and performance‑based SLAs cap supplier leverage.
- Supplier influence: installation & service
- Cost pressure: local labor & unions
- Mitigation: in‑house teams, scale contracts (2024)
- Controls: performance-based SLAs
Supplier Power 5
Data, programmatic platforms, and audience measurement partners increasingly determine digital OOH monetization; verified measurement and premium data remain concentrated among a few dominant providers, limiting supplier leverage despite interoperability.
Ströer’s proprietary data assets and platform integrations mitigate supplier power, but shifts in measurement standards can rapidly transfer value to external data suppliers and measurement vendors.
- Concentration: few verified measurers control premium metrics
- Counterbalance: Ströer-owned data/platforms reduce dependency
- Risk: standard changes can reallocate revenue to data suppliers
Moderate-high supplier power: municipalities, long concessions and concentrated measurement vendors
Supplier power is moderate-high: municipal/landlord control of prime sites (Germany ~11,000 municipalities; Ströer ~400,000 sites) and long concessions (5–15 yrs) concentrate leverage. Tech vendors exert pricing power despite ~8% annual component commoditization in 2024; measurement/data remain concentrated (top 3 vendors). Ströer scale and proprietary data partially offset risks.
| Metric | Value | Impact |
|---|---|---|
| Municipal count | 11,000 | Site control |
| Ströer sites | 400,000 | Negotiating scale |
| Component commod. | ≈8% (2024) | Lower vendor power |
| Top measurers | 3 | Data concentration |
What is included in the product
Detailed Word Document
Tailored Porter's Five Forces assessment for Ströer that uncovers competitive drivers, buyer/supplier power, entry barriers, substitutes and disruptive threats, with strategic commentary on how these forces affect Ströer's pricing, profitability and market positioning.
Customizable Excel Spreadsheet
Relieves analysis overload with a Stroer Porter's Five Forces one-sheet that clearly maps advertising-market pressures and competitive threats for rapid decision-making. Editable metrics and an instant radar chart make scenario comparisons and board-ready slides effortless.
Customers Bargaining Power
Buyer Power 1
In 2024 large advertisers and media buying groups continued centralizing budgets, increasing negotiating leverage over Ströer by demanding deeper discounts, audience guarantees and integrated cross-channel packages. Framework agreements and volume commitments trade lower CPMs for share-of-wallet, pressuring margins. Ströer’s unique OOH and premium digital sites soften but do not eliminate buyer power.
Buyer Power 2
Advertisers can multi-home across OOH rivals and digital channels, increasing price sensitivity as digital ad spend topped about $600bn in 2024 and cross‑channel buying rose. Substitutable reach lets buyers reallocate spend quickly, with programmatic DOOH bookings growing ~30% in 2024, shortening campaign horizons. Short booking cycles for digital screens amplify tactical switching, while distinctive premium locations with scarce alternatives defend higher rates.
Buyer Power 3
Programmatic OOH transparency and real-time comparability boosted buyer leverage in 2024 as automated buys grew, pushing price discovery; auction dynamics compressed spot margins by up to 12% during demand lulls. Private marketplaces and guaranteed deals preserved yields, often delivering 30–50% higher revenue on premium inventory. Data-enriched audience segments supported CPM differentials around 25%, tempering buyer power.
Buyer Power 4
Buyer Power 4: cyclical sectors such as auto, retail and telecom drive demand volatility and intensify bargaining in downturns; in 2024 agencies increasingly consolidated spend to preferred partners for better terms. Ströer’s diversified client base and thousands of advertisers smooth cycles and limit concentration risk. Performance case studies and attribution tools reduce price haggling by proving ROI.
- Agencies consolidate spend to preferred partners
- Diversified client base limits concentration
- Attribution reduces bargaining through ROI proof
Buyer Power 5
Local SMEs exert limited individual leverage but remain highly price-sensitive and switch frequently; Ströer reported group revenue of about 1.84 billion EUR in 2023 and has pushed digital inventory above 60% by 2024, enabling scalable self-serve packages that protect yield. Bundling OOH with online assets raises perceived value and client lock-in, while geo-targeting and footfall-lift case studies (often showing double-digit ROI uplift) reduce discount demand.
- SME churn high, price sensitivity
- Self-serve + standardized packs preserve yield
- Bundling increases lock-in
- Geo-targeting & footfall proof curb discounts
Budgets/CPMs 12%, DOOH ~30%, digital >60%
In 2024 large advertisers and agencies centralized budgets, leveraging volume deals that compressed CPMs up to 12% while programmatic DOOH grew ~30%. Ströer reported €1.84bn revenue in 2023 and >60% digital inventory by 2024, enabling self-serve bundles that limit SME churn. Data-rich premium inventory and private marketplaces (30–50% higher yield) moderate buyer power.
| Metric | Value |
|---|---|
| Ströer revenue (2023) | €1.84bn |
| Digital inventory (2024) | >60% |
| Programmatic DOOH growth (2024) | ~30% |
| Spot margin compression | up to 12% |
| PM yield uplift | 30–50% |
Preview the Actual Deliverable
Stroer Porter's Five Forces Analysis
This preview shows the exact Stroer Porter's Five Forces analysis you’ll receive after purchase—no placeholders or summaries. It contains the full competitive assessment: supplier and buyer power, threat of entrants and substitutes, and rivalry intensity with strategic implications. Instant download and ready-to-use file upon payment.











