Subsea 7 PESTLE Analysis

Make Smarter Strategic Decisions with a Complete PESTEL View
Our PESTLE Analysis of Subsea 7 reveals how geopolitics, energy transition, and regulatory shifts reshape its offshore engineering prospects. Actionable insights highlight risks and opportunities across markets and technologies. Purchase the full report for the complete, editable strategic toolkit.
Political factors

Geopolitics and energy security
Geopolitics and energy-security shifts—from upstream sanctions to maritime disputes—can abruptly cut bid pipelines and compress execution windows, forcing Subsea 7 to balance exposure between stable and emerging basins to reduce state-driven disruption risk. Government-backed fast-tracking of domestic supply chains can speed awards but often brings localization clauses that raise costs and complexity. Political realignments that reallocate capex between oil and gas and renewables will directly reshape tender volumes and timing.
Local content mandates
National content rules drive Subsea7 to form joint ventures, localize supply chains and invest in workforce training, with mandates in many markets typically ranging from 30-60% local spend, boosting bid competitiveness but adding 5-15% to project costs and schedule complexity. Early engagement with regulators aligns execution models and technology transfer, improving win rates. Market-by-market variation requires flexible contracting and vendor strategies.

Permitting and approvals
Offshore licenses, seabed leases and environmental consents set Subsea7 project timing; industry data show permitting often drives schedule variance of many months and can be the critical path for vessel mobilization. Lengthy multi-agency approvals frequently delay vessel schedules and cash conversion, increasing working capital strain. Streamlined permitting regimes for renewables have shortened lead times versus hydrocarbons, creating faster project backlogs. Proactive permitting roadmaps reduce idle time and liquidated-damages risk.

Subsidies and industrial policy
Renewables auctions, tax credits (eg US Inflation Reduction Act 30% investment tax credit for qualifying offshore wind) and export finance shape project viability and SURF margins, influencing bid pricing and EPC terms. Policy stability drives tender participation and fleet allocation; oil and gas fiscal regimes (royalties, incentives) directly affect operators’ FIDs and SURF demand. Monitoring policy cycles helps optimize market entry and backlog mix.
- Tax credit: US IRA 30% ITC
- Export finance alters commercial terms
- Fiscal regimes drive FID timing
- Policy stability -> tender & fleet decisions
Sanctions and trade controls
Sanction regimes constrain client eligibility, sourcing and routing of specialized subsea equipment, raising compliance burdens and possible project delays. Non-compliance risks include project bans and reputational harm, so robust screening and KYC are essential. Export controls on advanced subsea tech can limit deepwater solutions and extend lead times; diversified suppliers and rerouting mitigate cross-border frictions.
- Client eligibility screening
- Export-control limits on tech
- Supply diversification
- Rerouting and compliance programs
Sanctions, local-content and permits lift offshore costs +5-15%
Geopolitical shifts and sanctions (20+ major upstream sanctions 2022–24) and national content rules (30–60% local spend) force Subsea7 into JV/localization, raising project costs ~5–15%. Permitting delays (avg 6–12 months) and policy incentives (US IRA 30% ITC) reshape tender timing and margins. Export controls lengthen lead times; diversified suppliers and strong compliance cut disruption risk.
| Factor | Metric | Impact |
|---|---|---|
| Sanctions | 20+ (2022–24) | Restricts clients/suppliers |
| Local content | 30–60% | +5–15% cost |
| Permitting | 6–12 months | Schedule risk |
| Incentives | US IRA 30% ITC | Improves renewables viability |
What is included in the product
 Detailed Word Document
Explores how macro-environmental forces—Political, Economic, Social, Technological, Environmental, and Legal—specifically impact Subsea 7’s offshore engineering and renewables transition, with data-backed trends, forward-looking insights, and actionable implications for strategy, risk mitigation, and investor communications.

 Customizable Excel Spreadsheet
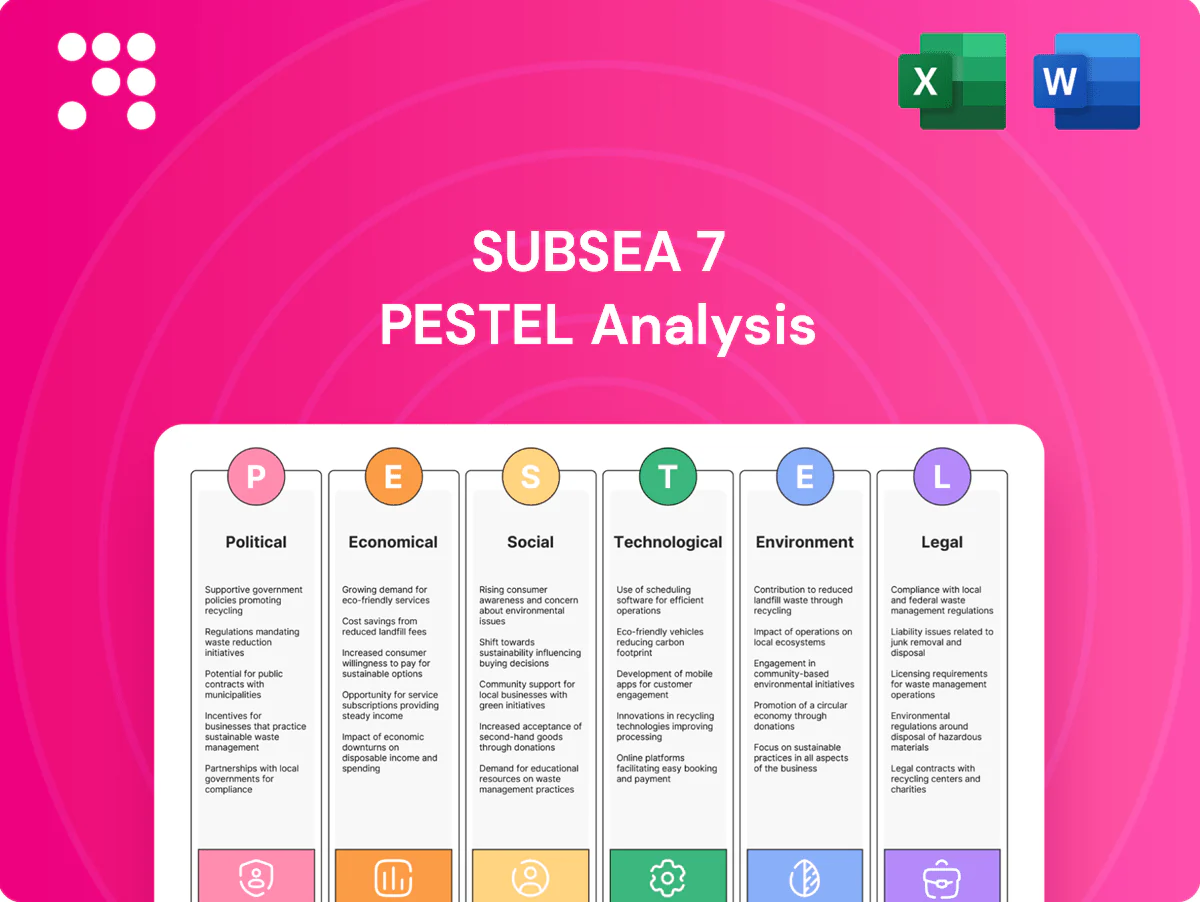
A clean, summarized version of the Subsea 7 PESTLE analysis for easy reference in meetings or presentations. Visually segmented by PESTLE categories and written in simple language to speed alignment, support risk discussions, and be dropped into slides or reports.
Economic factors

Commodity price cycles
Oil and gas price volatility (Brent trading mostly between $60–$100/bbl in 2024–25) directly drives operator offshore FIDs and SURF award timing, with downcycles compressing day rates and shifting contract risk to contractors while upcycles tighten vessel/crew capacity and lift margins. Renewables pricing remains sensitive to supply‑chain inflation and auction strike levels. Balanced exposure across oil, gas and renewables stabilizes Subsea7 revenues.
Capex and financing conditions
Rising policy rates and 10-year government yields near 4–5% plus project-credit spreads of roughly 200–400 basis points materially reduce project NPV and slow client sanctioning decisions. Access to project finance and ECA support remains pivotal for multi-hundred-million-euro offshore wind and CCS scopes, enabling longer tenors and lower equity stacks. A strong balance sheet allows Subsea 7 to fund vessel upgrades and counter-cyclical investing without expensive external capital. Pre-FEED/FEED conversion rates are highly sensitive to assumed cost of capital in financial models.

Currency and cost inflation
Subsea 7 faces FX risk from multi-currency revenue and costs across NOK, USD, GBP and EUR, with 2024 contracts continuing to span these currencies. Inflation in steel, vessel fuel and subsea hardware in 2024 has tightened bid competitiveness and pushed input costs higher. Hedging programs and indexation clauses on long-duration EPCIC projects help protect margins. Localization of supply reduces FX exposure but raises fixed local operating costs.

Fleet utilization and day rates
Vessel utilization directly drives Subsea7s operating leverage and profitability; higher utilization in 2024 supported margin recovery across renewable and oilfield campaigns. Efficient scheduling across campaigns cut transit and standby costs, while tight market conditions during 2024–25 improved day-rate discipline and contract terms. Conversely, idle time erodes margins and raises maintenance burdens.
- Utilization => higher operating leverage
- Scheduling => lower transit/standby costs
- Tight market => stronger day rates/terms
- Idle time => margin erosion + higher maintenance
Supply chain resilience
Long-lead items such as umbilicals, risers and subsea cables face bottlenecks in upcycles with typical lead times of 12–24 months; dual-sourcing and strategic inventory materially reduce schedule risk. Vendor solvency and logistics capacity directly affect delivery certainty, while close collaboration with OEMs drives component standardization and improved cost curves.
- Lead times: 12–24 months
- Mitigants: dual-sourcing, inventory
- Risks: vendor solvency, logistics
- Benefits: OEM collaboration, standardization
Sanctions, local-content and permits lift offshore costs +5-15%
Oil/gas price swings (Brent ~60–100 USD/bbl in 2024–25) drive FIDs, day rates and margin volatility; balanced oil/renewables mix stabilizes revenue. Policy rates/10y yields ~4–5% and project spreads ~200–400bps reduce NPV and delay sanctions; strong balance sheet enables capex and bidding flexibility. FX (NOK, USD, GBP, EUR), inflation in steel/fuel and 12–24m lead times pressure costs; hedging and dual‑sourcing mitigate.
| Metric | 2024–25 Level |
|---|---|
| Brent | 60–100 USD/bbl |
| 10y yields | 4–5% |
| Proj. credit spread | 200–400 bps |
| Lead times | 12–24 months |
What You See Is What You Get
Subsea 7 PESTLE Analysis
The preview shown here is the exact Subsea 7 PESTLE Analysis document you’ll receive after purchase—fully formatted and ready to use. The content, structure, and layout visible in this preview are identical to the downloadable file delivered after payment. No placeholders or teasers—this is the final, professional report you’ll own upon checkout.

Make Smarter Strategic Decisions with a Complete PESTEL View
Our PESTLE Analysis of Subsea 7 reveals how geopolitics, energy transition, and regulatory shifts reshape its offshore engineering prospects. Actionable insights highlight risks and opportunities across markets and technologies. Purchase the full report for the complete, editable strategic toolkit.
Political factors
Geopolitics and energy security
Geopolitics and energy-security shifts—from upstream sanctions to maritime disputes—can abruptly cut bid pipelines and compress execution windows, forcing Subsea 7 to balance exposure between stable and emerging basins to reduce state-driven disruption risk. Government-backed fast-tracking of domestic supply chains can speed awards but often brings localization clauses that raise costs and complexity. Political realignments that reallocate capex between oil and gas and renewables will directly reshape tender volumes and timing.
Local content mandates
National content rules drive Subsea7 to form joint ventures, localize supply chains and invest in workforce training, with mandates in many markets typically ranging from 30-60% local spend, boosting bid competitiveness but adding 5-15% to project costs and schedule complexity. Early engagement with regulators aligns execution models and technology transfer, improving win rates. Market-by-market variation requires flexible contracting and vendor strategies.
Permitting and approvals
Offshore licenses, seabed leases and environmental consents set Subsea7 project timing; industry data show permitting often drives schedule variance of many months and can be the critical path for vessel mobilization. Lengthy multi-agency approvals frequently delay vessel schedules and cash conversion, increasing working capital strain. Streamlined permitting regimes for renewables have shortened lead times versus hydrocarbons, creating faster project backlogs. Proactive permitting roadmaps reduce idle time and liquidated-damages risk.
Subsidies and industrial policy
Renewables auctions, tax credits (eg US Inflation Reduction Act 30% investment tax credit for qualifying offshore wind) and export finance shape project viability and SURF margins, influencing bid pricing and EPC terms. Policy stability drives tender participation and fleet allocation; oil and gas fiscal regimes (royalties, incentives) directly affect operators’ FIDs and SURF demand. Monitoring policy cycles helps optimize market entry and backlog mix.
- Tax credit: US IRA 30% ITC
- Export finance alters commercial terms
- Fiscal regimes drive FID timing
- Policy stability -> tender & fleet decisions
Sanctions and trade controls
Sanction regimes constrain client eligibility, sourcing and routing of specialized subsea equipment, raising compliance burdens and possible project delays. Non-compliance risks include project bans and reputational harm, so robust screening and KYC are essential. Export controls on advanced subsea tech can limit deepwater solutions and extend lead times; diversified suppliers and rerouting mitigate cross-border frictions.
- Client eligibility screening
- Export-control limits on tech
- Supply diversification
- Rerouting and compliance programs
Sanctions, local-content and permits lift offshore costs +5-15%
Geopolitical shifts and sanctions (20+ major upstream sanctions 2022–24) and national content rules (30–60% local spend) force Subsea7 into JV/localization, raising project costs ~5–15%. Permitting delays (avg 6–12 months) and policy incentives (US IRA 30% ITC) reshape tender timing and margins. Export controls lengthen lead times; diversified suppliers and strong compliance cut disruption risk.
| Factor | Metric | Impact |
|---|---|---|
| Sanctions | 20+ (2022–24) | Restricts clients/suppliers |
| Local content | 30–60% | +5–15% cost |
| Permitting | 6–12 months | Schedule risk |
| Incentives | US IRA 30% ITC | Improves renewables viability |
What is included in the product
Detailed Word Document
Explores how macro-environmental forces—Political, Economic, Social, Technological, Environmental, and Legal—specifically impact Subsea 7’s offshore engineering and renewables transition, with data-backed trends, forward-looking insights, and actionable implications for strategy, risk mitigation, and investor communications.
Customizable Excel Spreadsheet
A clean, summarized version of the Subsea 7 PESTLE analysis for easy reference in meetings or presentations. Visually segmented by PESTLE categories and written in simple language to speed alignment, support risk discussions, and be dropped into slides or reports.
Economic factors
Commodity price cycles
Oil and gas price volatility (Brent trading mostly between $60–$100/bbl in 2024–25) directly drives operator offshore FIDs and SURF award timing, with downcycles compressing day rates and shifting contract risk to contractors while upcycles tighten vessel/crew capacity and lift margins. Renewables pricing remains sensitive to supply‑chain inflation and auction strike levels. Balanced exposure across oil, gas and renewables stabilizes Subsea7 revenues.
Capex and financing conditions
Rising policy rates and 10-year government yields near 4–5% plus project-credit spreads of roughly 200–400 basis points materially reduce project NPV and slow client sanctioning decisions. Access to project finance and ECA support remains pivotal for multi-hundred-million-euro offshore wind and CCS scopes, enabling longer tenors and lower equity stacks. A strong balance sheet allows Subsea 7 to fund vessel upgrades and counter-cyclical investing without expensive external capital. Pre-FEED/FEED conversion rates are highly sensitive to assumed cost of capital in financial models.
Currency and cost inflation
Subsea 7 faces FX risk from multi-currency revenue and costs across NOK, USD, GBP and EUR, with 2024 contracts continuing to span these currencies. Inflation in steel, vessel fuel and subsea hardware in 2024 has tightened bid competitiveness and pushed input costs higher. Hedging programs and indexation clauses on long-duration EPCIC projects help protect margins. Localization of supply reduces FX exposure but raises fixed local operating costs.
Fleet utilization and day rates
Vessel utilization directly drives Subsea7s operating leverage and profitability; higher utilization in 2024 supported margin recovery across renewable and oilfield campaigns. Efficient scheduling across campaigns cut transit and standby costs, while tight market conditions during 2024–25 improved day-rate discipline and contract terms. Conversely, idle time erodes margins and raises maintenance burdens.
- Utilization => higher operating leverage
- Scheduling => lower transit/standby costs
- Tight market => stronger day rates/terms
- Idle time => margin erosion + higher maintenance
Supply chain resilience
Long-lead items such as umbilicals, risers and subsea cables face bottlenecks in upcycles with typical lead times of 12–24 months; dual-sourcing and strategic inventory materially reduce schedule risk. Vendor solvency and logistics capacity directly affect delivery certainty, while close collaboration with OEMs drives component standardization and improved cost curves.
- Lead times: 12–24 months
- Mitigants: dual-sourcing, inventory
- Risks: vendor solvency, logistics
- Benefits: OEM collaboration, standardization
Sanctions, local-content and permits lift offshore costs +5-15%
Oil/gas price swings (Brent ~60–100 USD/bbl in 2024–25) drive FIDs, day rates and margin volatility; balanced oil/renewables mix stabilizes revenue. Policy rates/10y yields ~4–5% and project spreads ~200–400bps reduce NPV and delay sanctions; strong balance sheet enables capex and bidding flexibility. FX (NOK, USD, GBP, EUR), inflation in steel/fuel and 12–24m lead times pressure costs; hedging and dual‑sourcing mitigate.
| Metric | 2024–25 Level |
|---|---|
| Brent | 60–100 USD/bbl |
| 10y yields | 4–5% |
| Proj. credit spread | 200–400 bps |
| Lead times | 12–24 months |
What You See Is What You Get
Subsea 7 PESTLE Analysis
The preview shown here is the exact Subsea 7 PESTLE Analysis document you’ll receive after purchase—fully formatted and ready to use. The content, structure, and layout visible in this preview are identical to the downloadable file delivered after payment. No placeholders or teasers—this is the final, professional report you’ll own upon checkout.
Original: $10.00
-65%$10.00
$3.50Description
Make Smarter Strategic Decisions with a Complete PESTEL View
Our PESTLE Analysis of Subsea 7 reveals how geopolitics, energy transition, and regulatory shifts reshape its offshore engineering prospects. Actionable insights highlight risks and opportunities across markets and technologies. Purchase the full report for the complete, editable strategic toolkit.
Political factors
Geopolitics and energy security
Geopolitics and energy-security shifts—from upstream sanctions to maritime disputes—can abruptly cut bid pipelines and compress execution windows, forcing Subsea 7 to balance exposure between stable and emerging basins to reduce state-driven disruption risk. Government-backed fast-tracking of domestic supply chains can speed awards but often brings localization clauses that raise costs and complexity. Political realignments that reallocate capex between oil and gas and renewables will directly reshape tender volumes and timing.
Local content mandates
National content rules drive Subsea7 to form joint ventures, localize supply chains and invest in workforce training, with mandates in many markets typically ranging from 30-60% local spend, boosting bid competitiveness but adding 5-15% to project costs and schedule complexity. Early engagement with regulators aligns execution models and technology transfer, improving win rates. Market-by-market variation requires flexible contracting and vendor strategies.
Permitting and approvals
Offshore licenses, seabed leases and environmental consents set Subsea7 project timing; industry data show permitting often drives schedule variance of many months and can be the critical path for vessel mobilization. Lengthy multi-agency approvals frequently delay vessel schedules and cash conversion, increasing working capital strain. Streamlined permitting regimes for renewables have shortened lead times versus hydrocarbons, creating faster project backlogs. Proactive permitting roadmaps reduce idle time and liquidated-damages risk.
Subsidies and industrial policy
Renewables auctions, tax credits (eg US Inflation Reduction Act 30% investment tax credit for qualifying offshore wind) and export finance shape project viability and SURF margins, influencing bid pricing and EPC terms. Policy stability drives tender participation and fleet allocation; oil and gas fiscal regimes (royalties, incentives) directly affect operators’ FIDs and SURF demand. Monitoring policy cycles helps optimize market entry and backlog mix.
- Tax credit: US IRA 30% ITC
- Export finance alters commercial terms
- Fiscal regimes drive FID timing
- Policy stability -> tender & fleet decisions
Sanctions and trade controls
Sanction regimes constrain client eligibility, sourcing and routing of specialized subsea equipment, raising compliance burdens and possible project delays. Non-compliance risks include project bans and reputational harm, so robust screening and KYC are essential. Export controls on advanced subsea tech can limit deepwater solutions and extend lead times; diversified suppliers and rerouting mitigate cross-border frictions.
- Client eligibility screening
- Export-control limits on tech
- Supply diversification
- Rerouting and compliance programs
Sanctions, local-content and permits lift offshore costs +5-15%
Geopolitical shifts and sanctions (20+ major upstream sanctions 2022–24) and national content rules (30–60% local spend) force Subsea7 into JV/localization, raising project costs ~5–15%. Permitting delays (avg 6–12 months) and policy incentives (US IRA 30% ITC) reshape tender timing and margins. Export controls lengthen lead times; diversified suppliers and strong compliance cut disruption risk.
| Factor | Metric | Impact |
|---|---|---|
| Sanctions | 20+ (2022–24) | Restricts clients/suppliers |
| Local content | 30–60% | +5–15% cost |
| Permitting | 6–12 months | Schedule risk |
| Incentives | US IRA 30% ITC | Improves renewables viability |
What is included in the product
Detailed Word Document
Explores how macro-environmental forces—Political, Economic, Social, Technological, Environmental, and Legal—specifically impact Subsea 7’s offshore engineering and renewables transition, with data-backed trends, forward-looking insights, and actionable implications for strategy, risk mitigation, and investor communications.
Customizable Excel Spreadsheet
A clean, summarized version of the Subsea 7 PESTLE analysis for easy reference in meetings or presentations. Visually segmented by PESTLE categories and written in simple language to speed alignment, support risk discussions, and be dropped into slides or reports.
Economic factors
Commodity price cycles
Oil and gas price volatility (Brent trading mostly between $60–$100/bbl in 2024–25) directly drives operator offshore FIDs and SURF award timing, with downcycles compressing day rates and shifting contract risk to contractors while upcycles tighten vessel/crew capacity and lift margins. Renewables pricing remains sensitive to supply‑chain inflation and auction strike levels. Balanced exposure across oil, gas and renewables stabilizes Subsea7 revenues.
Capex and financing conditions
Rising policy rates and 10-year government yields near 4–5% plus project-credit spreads of roughly 200–400 basis points materially reduce project NPV and slow client sanctioning decisions. Access to project finance and ECA support remains pivotal for multi-hundred-million-euro offshore wind and CCS scopes, enabling longer tenors and lower equity stacks. A strong balance sheet allows Subsea 7 to fund vessel upgrades and counter-cyclical investing without expensive external capital. Pre-FEED/FEED conversion rates are highly sensitive to assumed cost of capital in financial models.
Currency and cost inflation
Subsea 7 faces FX risk from multi-currency revenue and costs across NOK, USD, GBP and EUR, with 2024 contracts continuing to span these currencies. Inflation in steel, vessel fuel and subsea hardware in 2024 has tightened bid competitiveness and pushed input costs higher. Hedging programs and indexation clauses on long-duration EPCIC projects help protect margins. Localization of supply reduces FX exposure but raises fixed local operating costs.
Fleet utilization and day rates
Vessel utilization directly drives Subsea7s operating leverage and profitability; higher utilization in 2024 supported margin recovery across renewable and oilfield campaigns. Efficient scheduling across campaigns cut transit and standby costs, while tight market conditions during 2024–25 improved day-rate discipline and contract terms. Conversely, idle time erodes margins and raises maintenance burdens.
- Utilization => higher operating leverage
- Scheduling => lower transit/standby costs
- Tight market => stronger day rates/terms
- Idle time => margin erosion + higher maintenance
Supply chain resilience
Long-lead items such as umbilicals, risers and subsea cables face bottlenecks in upcycles with typical lead times of 12–24 months; dual-sourcing and strategic inventory materially reduce schedule risk. Vendor solvency and logistics capacity directly affect delivery certainty, while close collaboration with OEMs drives component standardization and improved cost curves.
- Lead times: 12–24 months
- Mitigants: dual-sourcing, inventory
- Risks: vendor solvency, logistics
- Benefits: OEM collaboration, standardization
Sanctions, local-content and permits lift offshore costs +5-15%
Oil/gas price swings (Brent ~60–100 USD/bbl in 2024–25) drive FIDs, day rates and margin volatility; balanced oil/renewables mix stabilizes revenue. Policy rates/10y yields ~4–5% and project spreads ~200–400bps reduce NPV and delay sanctions; strong balance sheet enables capex and bidding flexibility. FX (NOK, USD, GBP, EUR), inflation in steel/fuel and 12–24m lead times pressure costs; hedging and dual‑sourcing mitigate.
| Metric | 2024–25 Level |
|---|---|
| Brent | 60–100 USD/bbl |
| 10y yields | 4–5% |
| Proj. credit spread | 200–400 bps |
| Lead times | 12–24 months |
What You See Is What You Get
Subsea 7 PESTLE Analysis
The preview shown here is the exact Subsea 7 PESTLE Analysis document you’ll receive after purchase—fully formatted and ready to use. The content, structure, and layout visible in this preview are identical to the downloadable file delivered after payment. No placeholders or teasers—this is the final, professional report you’ll own upon checkout.











