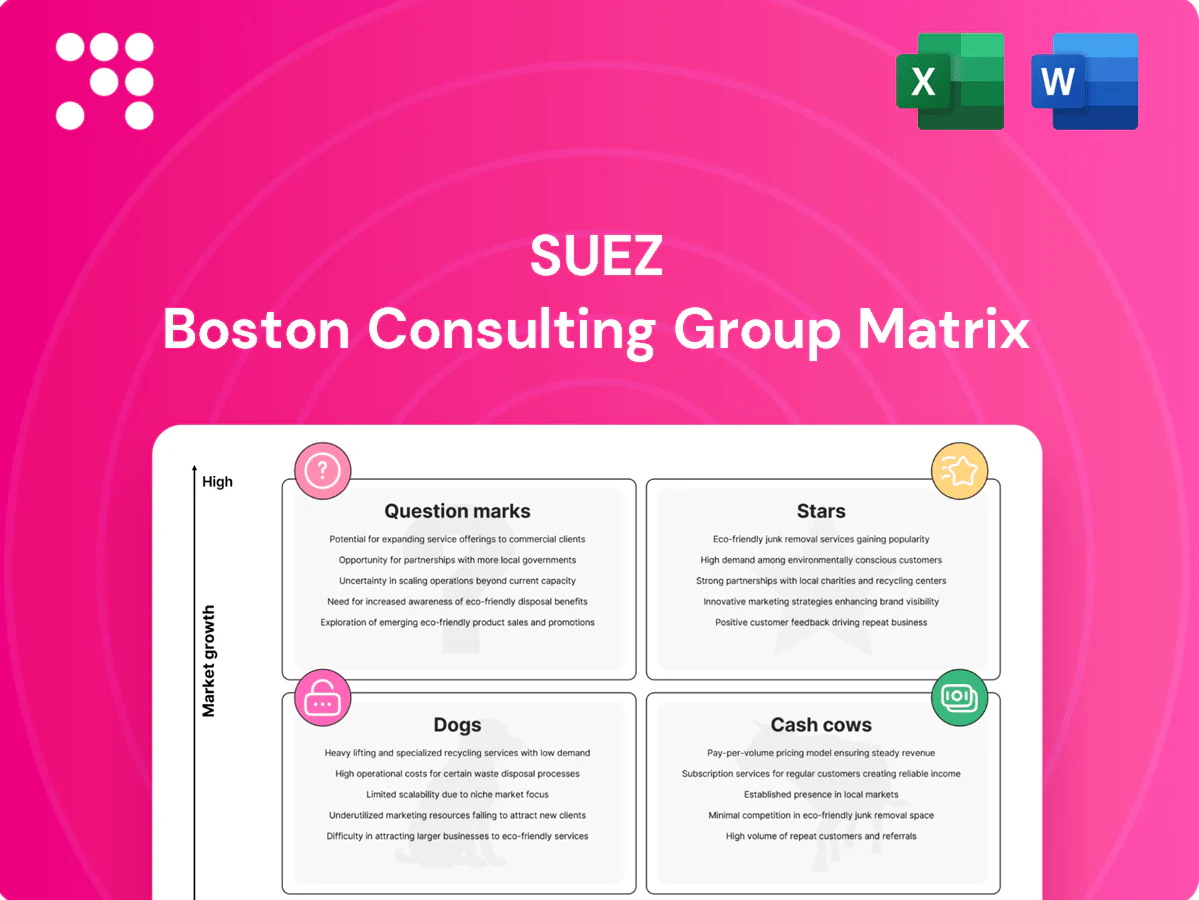
Suez Boston Consulting Group Matrix

Visual. Strategic. Downloadable.
The Suez BCG Matrix snapshot shows which services are fueling growth, which generate steady cash, and which could be weighing the portfolio down—critical clarity for any exec steering strategy. This preview teases quadrant placements and high-level implications; the full BCG Matrix delivers the data-rich, quadrant-by-quadrant breakdown you need. Purchase the complete report for actionable recommendations, editable Word and Excel files, and a ready-to-present roadmap to smarter investment and resource allocation.
Stars

Digital water platforms & smart metering
Digital water platforms and smart metering sit in a high-growth, high-need quadrant for Suez: global non-revenue water averages about 30%, driving urgent demand for leakage control, AI ops and billing accuracy. Utilities and industry budgets are increasing, with the smart water market growing roughly 10% CAGR as adoption rises. Suez’s existing scale and investments in integrations, analytics and sticky SaaS can defend share and convert this flywheel into a future cash cow.
Desalination & reuse mega-projects
Water-stressed regions, led by MENA and parts of Asia, drive a booming desalination pipeline and Suez is routinely shortlisted for complex EPC + O&M bids; the global desalination market exceeded $20 billion in 2024 and large projects dominate procurement. References compound advantage across repeat EPC wins, strengthening long O&M tails. Yes, capex-intensive, but disciplined execution yields returns aligned with project risk; invest to win, standardize delivery, lock long O&M contracts.

Industrial water outsourcing (food, pharma, microelectronics)
Manufacturers demand guaranteed quality, high uptime, and rapid reductions in water intensity—outsourcing cuts operational water use and risk; industry reports project the industrial water services market to grow toward ~$60bn by 2028. Suez brings credibility, modular treatment tech and lifecycle contracts that scale across sites, improving unit economics as portfolios grow. Prioritize multi-site deals and embed digital monitoring to drive >20% OPEX savings and faster rollouts.

Advanced wastewater treatment & nutrient removal
Regulations tightened across the EU and US in 2024, forcing municipalities to accelerate upgrades; Suez’s process IP and >2,000 global project references position it ahead in many markets. Growth in advanced nutrient removal is brisk with premium projects growing faster than commodity treatment, and high-end competition remains thinner. Strategy: double down on design-build-operate contracts with performance guarantees to capture higher-margin, low-competition work.
Energy-from-waste with grid contracts
Energy-from-waste with grid contracts sits at the baseload energy and waste recovery sweet spot where supportive policy frameworks exist, delivering firm generation and diversion value. Suez leverages deep operating expertise and bankable PPAs to underwrite projects and secure financing. Growth markets are selective; when regulatory incentives and feedstock availability align, Suez captures strong share and should continue investing where the incentive stack is durable.
- Position: baseload + waste recovery
- Strength: operating expertise, bankable PPAs
- Strategy: selective market entry, focus on durable incentives
Digital water, desalination and selective EfW: scale SaaS, lock O&M value
Digital water platforms, smart metering and desalination are Stars: non-revenue water ~30% global, smart water market ~10% CAGR, desalination >$20bn in 2024. Suez’s scale, >2,000 references and modular SaaS/DBO capabilities can convert growth into cash cows. Energy-from-waste is a selective Star where bankable PPAs and durable incentives align.
| Segment | 2024/2028 metric | Suez advantage | Strategy |
|---|---|---|---|
| Smart water | ~10% CAGR | Analytics, SaaS | Scale SaaS, multi-site deals |
| Desalination | >$20bn (2024) | EPC+O&M refs | Win large EPC, lock O&M |
| Industrial services | ~$60bn market by 2028 | Modular treatment | Multi-site, embed digital |
| EfW | Selective growth | PPAs, ops | Enter markets with durable incentives |
What is included in the product
 Detailed Word Document
Concise Suez BCG Matrix review: quadrant insights, investment priorities, risks and growth potential across products and business units

 Customizable Excel Spreadsheet
One-page Suez BCG Matrix pinpointing weak spots and growth bets—fast clarity for smarter resource and portfolio decisions
Cash Cows

Long-term municipal water O&M contracts (Europe)
Long-term municipal water O&M contracts in Europe are a stable, regulated cash cow for Suez with contract tenors typically 10–25 years and a high-share backlog driving predictable renewals. Growth is low (circa 1–2% CAGR from population and tariff indexing) while cash conversion is strong, often above 70–80%. Minimal promo spend is needed — focus on service quality, relationship management, cost trimming and keeping churn near zero.
Municipal waste collection & sorting in mature cities
Defensible routes and standardized ops in mature-city municipal collection deliver steady volumes with low growth (≈1%/yr in developed markets), enabling price-escalators and efficiency programs to generate cash. Typical EBITDA margins for consolidated municipal contracts run high-single digits to low-teens, so milk margins while selectively upgrading fleets. Prioritize targeted capex and automation of MRFs to lift yield and reduce O&M costs.

Hazardous waste treatment networks
Hazardous waste treatment networks act as cash cows for Suez: high permitting moats and long regulatory barriers (permits often take 2–5 years) keep pricing rational and competition low. Utilization typically exceeds 85% and customers pay up for compliance certainty, supporting EBITDA margins around 18–22%. Market growth is modest (~3–5% CAGR), so focus is on maintaining assets, optimizing throughput and locking multiyear contracts (3–7 years).

Drinking water production plants under concession
Drinking water production plants under concession are Suez cash cows: core franchise assets that consistently fund operations, with mature operating playbooks and planned capex cycles ensuring steady net cash generation year after year; focus on top-tier reliability and use recurring cash flows to renegotiate tariffs and contract terms from a position of strength.
- Core franchise assets
- Mature operations & planned capex
- Recurring positive cash flow
- Prioritize reliability
- Renegotiate from strength
Recycling contracts with guaranteed feedstock
Recycling contracts with guaranteed feedstock make Suez's plants cash cows: when tonnage is secured (covering >60% of throughput) facilities generate steady cash even as commodity prices swing, supporting mid-teens EBITDA margins in 2024. Hedging programs plus process tweaks (improved sorting, higher recovery rates) protect margins without needing rapid volume growth. Not a rocket ship, but a dependable cash generator—hold contracts, refine yield, and keep maintenance tight.
- secured feedstock >60% throughput
- mid-teens EBITDA margins (2024)
- hedging + process optimization
- prioritize contract retention & maintenance
Lock contracts, target capex & automation to lift margins across waste and recycling
Long-tenor municipal O&M and concessions deliver low growth (1–2% CAGR) with cash conversion ~70–80% and EBITDA 8–12%; hazardous waste shows utilization >85% and EBITDA 18–22%; recycling with secured feedstock >60% yielded mid-teens EBITDA in 2024. Prioritize contract retention, targeted capex, automation and throughput optimization.
| Segment | Growth | Cash/EBITDA | Key metric (2024) |
|---|---|---|---|
| Municipal O&M | 1–2% CAGR | Cash conv 70–80% / EBITDA 8–12% | Long tenors 10–25y |
| Hazardous waste | 3–5% CAGR | EBITDA 18–22% | Utilization >85% |
| Recycling | ~2–3% CAGR | EBITDA mid-teens (2024) | Secured feedstock >60% |
What You See Is What You Get
Suez BCG Matrix
The file you're previewing is the final Suez BCG Matrix you'll receive after purchase. No watermarks or placeholders—just the fully formatted, analysis-ready report. It's crafted for strategic clarity and immediate use in presentations, planning, or investor decks. Once purchased, the same document is instantly downloadable and editable.

Visual. Strategic. Downloadable.
The Suez BCG Matrix snapshot shows which services are fueling growth, which generate steady cash, and which could be weighing the portfolio down—critical clarity for any exec steering strategy. This preview teases quadrant placements and high-level implications; the full BCG Matrix delivers the data-rich, quadrant-by-quadrant breakdown you need. Purchase the complete report for actionable recommendations, editable Word and Excel files, and a ready-to-present roadmap to smarter investment and resource allocation.
Stars
Digital water platforms & smart metering
Digital water platforms and smart metering sit in a high-growth, high-need quadrant for Suez: global non-revenue water averages about 30%, driving urgent demand for leakage control, AI ops and billing accuracy. Utilities and industry budgets are increasing, with the smart water market growing roughly 10% CAGR as adoption rises. Suez’s existing scale and investments in integrations, analytics and sticky SaaS can defend share and convert this flywheel into a future cash cow.
Desalination & reuse mega-projects
Water-stressed regions, led by MENA and parts of Asia, drive a booming desalination pipeline and Suez is routinely shortlisted for complex EPC + O&M bids; the global desalination market exceeded $20 billion in 2024 and large projects dominate procurement. References compound advantage across repeat EPC wins, strengthening long O&M tails. Yes, capex-intensive, but disciplined execution yields returns aligned with project risk; invest to win, standardize delivery, lock long O&M contracts.
Industrial water outsourcing (food, pharma, microelectronics)
Manufacturers demand guaranteed quality, high uptime, and rapid reductions in water intensity—outsourcing cuts operational water use and risk; industry reports project the industrial water services market to grow toward ~$60bn by 2028. Suez brings credibility, modular treatment tech and lifecycle contracts that scale across sites, improving unit economics as portfolios grow. Prioritize multi-site deals and embed digital monitoring to drive >20% OPEX savings and faster rollouts.
Advanced wastewater treatment & nutrient removal
Regulations tightened across the EU and US in 2024, forcing municipalities to accelerate upgrades; Suez’s process IP and >2,000 global project references position it ahead in many markets. Growth in advanced nutrient removal is brisk with premium projects growing faster than commodity treatment, and high-end competition remains thinner. Strategy: double down on design-build-operate contracts with performance guarantees to capture higher-margin, low-competition work.
Energy-from-waste with grid contracts
Energy-from-waste with grid contracts sits at the baseload energy and waste recovery sweet spot where supportive policy frameworks exist, delivering firm generation and diversion value. Suez leverages deep operating expertise and bankable PPAs to underwrite projects and secure financing. Growth markets are selective; when regulatory incentives and feedstock availability align, Suez captures strong share and should continue investing where the incentive stack is durable.
- Position: baseload + waste recovery
- Strength: operating expertise, bankable PPAs
- Strategy: selective market entry, focus on durable incentives
Digital water, desalination and selective EfW: scale SaaS, lock O&M value
Digital water platforms, smart metering and desalination are Stars: non-revenue water ~30% global, smart water market ~10% CAGR, desalination >$20bn in 2024. Suez’s scale, >2,000 references and modular SaaS/DBO capabilities can convert growth into cash cows. Energy-from-waste is a selective Star where bankable PPAs and durable incentives align.
| Segment | 2024/2028 metric | Suez advantage | Strategy |
|---|---|---|---|
| Smart water | ~10% CAGR | Analytics, SaaS | Scale SaaS, multi-site deals |
| Desalination | >$20bn (2024) | EPC+O&M refs | Win large EPC, lock O&M |
| Industrial services | ~$60bn market by 2028 | Modular treatment | Multi-site, embed digital |
| EfW | Selective growth | PPAs, ops | Enter markets with durable incentives |
What is included in the product
Detailed Word Document
Concise Suez BCG Matrix review: quadrant insights, investment priorities, risks and growth potential across products and business units
Customizable Excel Spreadsheet
One-page Suez BCG Matrix pinpointing weak spots and growth bets—fast clarity for smarter resource and portfolio decisions
Cash Cows
Long-term municipal water O&M contracts (Europe)
Long-term municipal water O&M contracts in Europe are a stable, regulated cash cow for Suez with contract tenors typically 10–25 years and a high-share backlog driving predictable renewals. Growth is low (circa 1–2% CAGR from population and tariff indexing) while cash conversion is strong, often above 70–80%. Minimal promo spend is needed — focus on service quality, relationship management, cost trimming and keeping churn near zero.
Municipal waste collection & sorting in mature cities
Defensible routes and standardized ops in mature-city municipal collection deliver steady volumes with low growth (≈1%/yr in developed markets), enabling price-escalators and efficiency programs to generate cash. Typical EBITDA margins for consolidated municipal contracts run high-single digits to low-teens, so milk margins while selectively upgrading fleets. Prioritize targeted capex and automation of MRFs to lift yield and reduce O&M costs.
Hazardous waste treatment networks
Hazardous waste treatment networks act as cash cows for Suez: high permitting moats and long regulatory barriers (permits often take 2–5 years) keep pricing rational and competition low. Utilization typically exceeds 85% and customers pay up for compliance certainty, supporting EBITDA margins around 18–22%. Market growth is modest (~3–5% CAGR), so focus is on maintaining assets, optimizing throughput and locking multiyear contracts (3–7 years).
Drinking water production plants under concession
Drinking water production plants under concession are Suez cash cows: core franchise assets that consistently fund operations, with mature operating playbooks and planned capex cycles ensuring steady net cash generation year after year; focus on top-tier reliability and use recurring cash flows to renegotiate tariffs and contract terms from a position of strength.
- Core franchise assets
- Mature operations & planned capex
- Recurring positive cash flow
- Prioritize reliability
- Renegotiate from strength
Recycling contracts with guaranteed feedstock
Recycling contracts with guaranteed feedstock make Suez's plants cash cows: when tonnage is secured (covering >60% of throughput) facilities generate steady cash even as commodity prices swing, supporting mid-teens EBITDA margins in 2024. Hedging programs plus process tweaks (improved sorting, higher recovery rates) protect margins without needing rapid volume growth. Not a rocket ship, but a dependable cash generator—hold contracts, refine yield, and keep maintenance tight.
- secured feedstock >60% throughput
- mid-teens EBITDA margins (2024)
- hedging + process optimization
- prioritize contract retention & maintenance
Lock contracts, target capex & automation to lift margins across waste and recycling
Long-tenor municipal O&M and concessions deliver low growth (1–2% CAGR) with cash conversion ~70–80% and EBITDA 8–12%; hazardous waste shows utilization >85% and EBITDA 18–22%; recycling with secured feedstock >60% yielded mid-teens EBITDA in 2024. Prioritize contract retention, targeted capex, automation and throughput optimization.
| Segment | Growth | Cash/EBITDA | Key metric (2024) |
|---|---|---|---|
| Municipal O&M | 1–2% CAGR | Cash conv 70–80% / EBITDA 8–12% | Long tenors 10–25y |
| Hazardous waste | 3–5% CAGR | EBITDA 18–22% | Utilization >85% |
| Recycling | ~2–3% CAGR | EBITDA mid-teens (2024) | Secured feedstock >60% |
What You See Is What You Get
Suez BCG Matrix
The file you're previewing is the final Suez BCG Matrix you'll receive after purchase. No watermarks or placeholders—just the fully formatted, analysis-ready report. It's crafted for strategic clarity and immediate use in presentations, planning, or investor decks. Once purchased, the same document is instantly downloadable and editable.
Original: $10.00
-65%$10.00
$3.50Description
Visual. Strategic. Downloadable.
The Suez BCG Matrix snapshot shows which services are fueling growth, which generate steady cash, and which could be weighing the portfolio down—critical clarity for any exec steering strategy. This preview teases quadrant placements and high-level implications; the full BCG Matrix delivers the data-rich, quadrant-by-quadrant breakdown you need. Purchase the complete report for actionable recommendations, editable Word and Excel files, and a ready-to-present roadmap to smarter investment and resource allocation.
Stars
Digital water platforms & smart metering
Digital water platforms and smart metering sit in a high-growth, high-need quadrant for Suez: global non-revenue water averages about 30%, driving urgent demand for leakage control, AI ops and billing accuracy. Utilities and industry budgets are increasing, with the smart water market growing roughly 10% CAGR as adoption rises. Suez’s existing scale and investments in integrations, analytics and sticky SaaS can defend share and convert this flywheel into a future cash cow.
Desalination & reuse mega-projects
Water-stressed regions, led by MENA and parts of Asia, drive a booming desalination pipeline and Suez is routinely shortlisted for complex EPC + O&M bids; the global desalination market exceeded $20 billion in 2024 and large projects dominate procurement. References compound advantage across repeat EPC wins, strengthening long O&M tails. Yes, capex-intensive, but disciplined execution yields returns aligned with project risk; invest to win, standardize delivery, lock long O&M contracts.
Industrial water outsourcing (food, pharma, microelectronics)
Manufacturers demand guaranteed quality, high uptime, and rapid reductions in water intensity—outsourcing cuts operational water use and risk; industry reports project the industrial water services market to grow toward ~$60bn by 2028. Suez brings credibility, modular treatment tech and lifecycle contracts that scale across sites, improving unit economics as portfolios grow. Prioritize multi-site deals and embed digital monitoring to drive >20% OPEX savings and faster rollouts.
Advanced wastewater treatment & nutrient removal
Regulations tightened across the EU and US in 2024, forcing municipalities to accelerate upgrades; Suez’s process IP and >2,000 global project references position it ahead in many markets. Growth in advanced nutrient removal is brisk with premium projects growing faster than commodity treatment, and high-end competition remains thinner. Strategy: double down on design-build-operate contracts with performance guarantees to capture higher-margin, low-competition work.
Energy-from-waste with grid contracts
Energy-from-waste with grid contracts sits at the baseload energy and waste recovery sweet spot where supportive policy frameworks exist, delivering firm generation and diversion value. Suez leverages deep operating expertise and bankable PPAs to underwrite projects and secure financing. Growth markets are selective; when regulatory incentives and feedstock availability align, Suez captures strong share and should continue investing where the incentive stack is durable.
- Position: baseload + waste recovery
- Strength: operating expertise, bankable PPAs
- Strategy: selective market entry, focus on durable incentives
Digital water, desalination and selective EfW: scale SaaS, lock O&M value
Digital water platforms, smart metering and desalination are Stars: non-revenue water ~30% global, smart water market ~10% CAGR, desalination >$20bn in 2024. Suez’s scale, >2,000 references and modular SaaS/DBO capabilities can convert growth into cash cows. Energy-from-waste is a selective Star where bankable PPAs and durable incentives align.
| Segment | 2024/2028 metric | Suez advantage | Strategy |
|---|---|---|---|
| Smart water | ~10% CAGR | Analytics, SaaS | Scale SaaS, multi-site deals |
| Desalination | >$20bn (2024) | EPC+O&M refs | Win large EPC, lock O&M |
| Industrial services | ~$60bn market by 2028 | Modular treatment | Multi-site, embed digital |
| EfW | Selective growth | PPAs, ops | Enter markets with durable incentives |
What is included in the product
Detailed Word Document
Concise Suez BCG Matrix review: quadrant insights, investment priorities, risks and growth potential across products and business units
Customizable Excel Spreadsheet
One-page Suez BCG Matrix pinpointing weak spots and growth bets—fast clarity for smarter resource and portfolio decisions
Cash Cows
Long-term municipal water O&M contracts (Europe)
Long-term municipal water O&M contracts in Europe are a stable, regulated cash cow for Suez with contract tenors typically 10–25 years and a high-share backlog driving predictable renewals. Growth is low (circa 1–2% CAGR from population and tariff indexing) while cash conversion is strong, often above 70–80%. Minimal promo spend is needed — focus on service quality, relationship management, cost trimming and keeping churn near zero.
Municipal waste collection & sorting in mature cities
Defensible routes and standardized ops in mature-city municipal collection deliver steady volumes with low growth (≈1%/yr in developed markets), enabling price-escalators and efficiency programs to generate cash. Typical EBITDA margins for consolidated municipal contracts run high-single digits to low-teens, so milk margins while selectively upgrading fleets. Prioritize targeted capex and automation of MRFs to lift yield and reduce O&M costs.
Hazardous waste treatment networks
Hazardous waste treatment networks act as cash cows for Suez: high permitting moats and long regulatory barriers (permits often take 2–5 years) keep pricing rational and competition low. Utilization typically exceeds 85% and customers pay up for compliance certainty, supporting EBITDA margins around 18–22%. Market growth is modest (~3–5% CAGR), so focus is on maintaining assets, optimizing throughput and locking multiyear contracts (3–7 years).
Drinking water production plants under concession
Drinking water production plants under concession are Suez cash cows: core franchise assets that consistently fund operations, with mature operating playbooks and planned capex cycles ensuring steady net cash generation year after year; focus on top-tier reliability and use recurring cash flows to renegotiate tariffs and contract terms from a position of strength.
- Core franchise assets
- Mature operations & planned capex
- Recurring positive cash flow
- Prioritize reliability
- Renegotiate from strength
Recycling contracts with guaranteed feedstock
Recycling contracts with guaranteed feedstock make Suez's plants cash cows: when tonnage is secured (covering >60% of throughput) facilities generate steady cash even as commodity prices swing, supporting mid-teens EBITDA margins in 2024. Hedging programs plus process tweaks (improved sorting, higher recovery rates) protect margins without needing rapid volume growth. Not a rocket ship, but a dependable cash generator—hold contracts, refine yield, and keep maintenance tight.
- secured feedstock >60% throughput
- mid-teens EBITDA margins (2024)
- hedging + process optimization
- prioritize contract retention & maintenance
Lock contracts, target capex & automation to lift margins across waste and recycling
Long-tenor municipal O&M and concessions deliver low growth (1–2% CAGR) with cash conversion ~70–80% and EBITDA 8–12%; hazardous waste shows utilization >85% and EBITDA 18–22%; recycling with secured feedstock >60% yielded mid-teens EBITDA in 2024. Prioritize contract retention, targeted capex, automation and throughput optimization.
| Segment | Growth | Cash/EBITDA | Key metric (2024) |
|---|---|---|---|
| Municipal O&M | 1–2% CAGR | Cash conv 70–80% / EBITDA 8–12% | Long tenors 10–25y |
| Hazardous waste | 3–5% CAGR | EBITDA 18–22% | Utilization >85% |
| Recycling | ~2–3% CAGR | EBITDA mid-teens (2024) | Secured feedstock >60% |
What You See Is What You Get
Suez BCG Matrix
The file you're previewing is the final Suez BCG Matrix you'll receive after purchase. No watermarks or placeholders—just the fully formatted, analysis-ready report. It's crafted for strategic clarity and immediate use in presentations, planning, or investor decks. Once purchased, the same document is instantly downloadable and editable.











