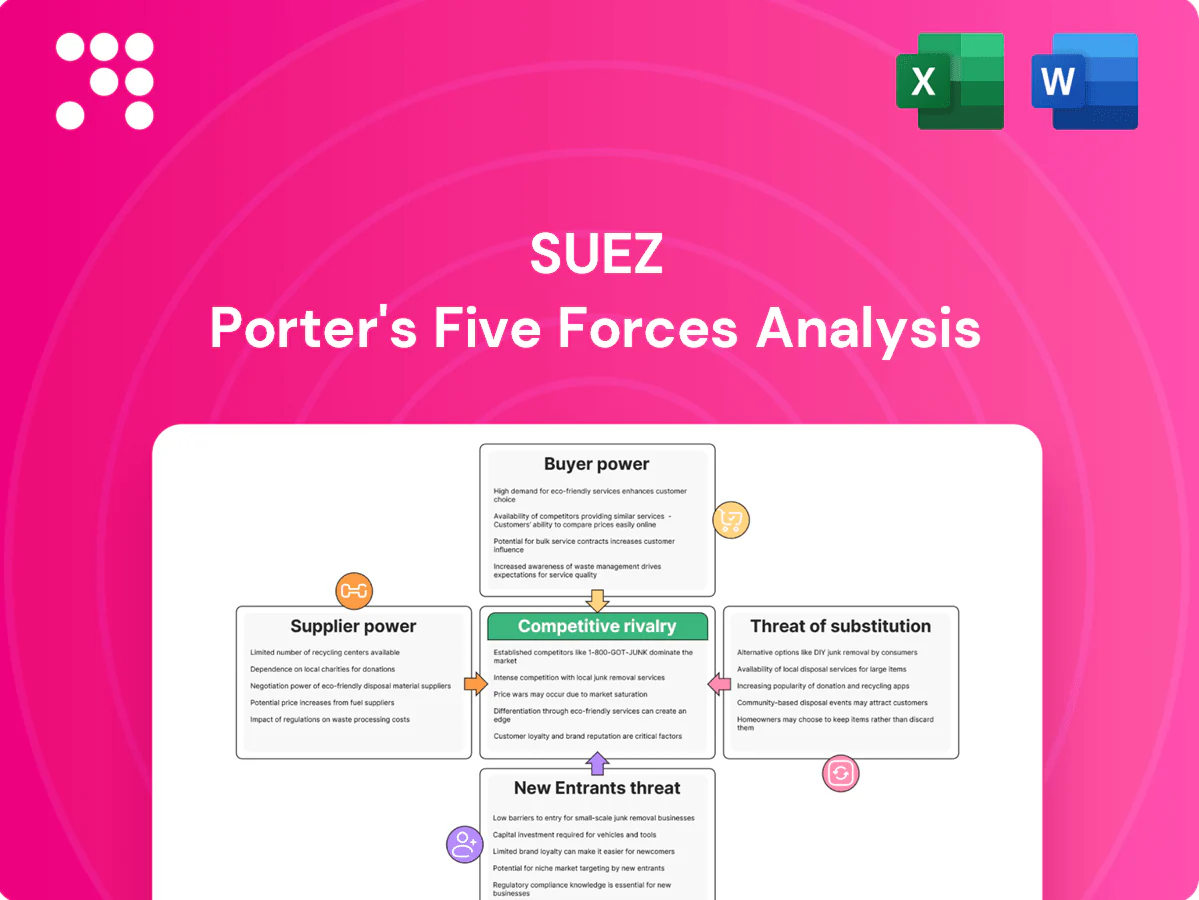
Suez Porter's Five Forces Analysis

Elevate Your Analysis with the Complete Porter's Five Forces Analysis
Suez faces intense competitive dynamics driven by regulatory scrutiny, capital intensity, and evolving customer demands, with supplier and buyer power varying across service lines. This snapshot highlights key pressures—technology disruption, cost sensitivity, and moderate threat from new entrants. Unlock the full Porter's Five Forces Analysis to explore force-by-force ratings, visuals, and actionable strategy recommendations.
Suppliers Bargaining Power

Critical equipment OEMs
Membrane, pump and sensor OEMs are highly concentrated, with the top three membrane suppliers holding roughly 60% of the global market in 2024, giving them pricing power on specialized components. Certification and validation cycles often exceed 12 months and performance guarantees raise explicit switching costs for Suez. Long-term frame agreements (commonly 3–7 years) smooth price spikes but lock standards to select vendors. Co-development deals can create dependency while delivering measurable performance gains for specific projects.
Chemicals and consumables
Coagulants, disinfectants and adsorbents are partly commoditized, capping supplier leverage, but 2024 energy-driven chlor-alkali price volatility and regional feedstock constraints increased supplier bargaining power. High transport and safety compliance costs raise switching friction, while multi-sourcing and hedging reduce exposure but demand strict QA. Tightening 2024 PFAS-free specifications further narrow qualified suppliers.

Energy providers
Operations are energy intensive — industry accounts for about 37% of global final energy consumption (IEA 2023) — exposing Suez to power and gas suppliers’ terms.
Long‑term PPAs, typically 10–20 years, plus on‑site biogas and solar generation materially reduce market exposure.
Regulatory price caps in some markets and growing demand flexibility plus efficiency upgrades strengthen Suez’s negotiating levers with suppliers.

Specialist contractors
Specialist civil and electromechanical contractors exert strong leverage over Suez projects because their skills directly drive timelines and capital intensity; tight labor markets reduce flexibility and elevate rates, while preferred-partner frameworks secure capacity but lock in volumes and pricing dynamics; stringent HSE and compliance filters shrink the eligible pool, increasing contractor bargaining power.
- Skilled labor dependence raises schedule and cost risk
- Labor tightness lifts rates and reduces replanning options
- Preferred-partner deals trade capacity for volume commitment
- High HSE/compliance standards narrow supplier pool
Digital and data platforms
Digital and data platform suppliers (IoT, SCADA, analytics) can create strong lock-in via proprietary stacks and integrations; 2024 industry studies report up to 20% throughput gains tied to such deep integrations, increasing switching costs and supplier leverage. Cybersecurity rules and data residency laws further constrain options, while open-architecture procurement and APIs dilute vendor power.
- Co-own IP to preserve optionality
- Insist on interoperable standards (OPC UA, MQTT)
- Require API-first contracts and escape clauses
Membrane oligopoly (top3 ≈60%) and 10–20y PPAs raise risk; digital adds ~20% throughput
Suppliers range from highly concentrated membrane OEMs (top 3 ≈60% global share in 2024) with long certification cycles and high switching costs, to commoditized chemicals where 2024 feedstock-driven volatility raised leverage. Energy suppliers pose risk given water sector intensity; long PPAs (10–20y) and on-site renewables materially lower exposure. Digital vendors can lock Suez in after integrations that delivered ~20% throughput gains in 2024.
| Supplier | 2024 metric | Switching cost |
|---|---|---|
| Membranes | Top3 ≈60% share | High |
| Chemicals | Feedstock volatility 2024 | Medium |
| Energy | PPAs 10–20y | Medium |
| Digital | ~20% throughput gain 2024 | High |
What is included in the product
 Detailed Word Document
Uncovers key drivers of competition, customer influence, and market-entry risks tailored to Suez, with a concise evaluation of supplier and buyer power and their impact on pricing and profitability. Identifies disruptive forces, substitutes, newcomer barriers, and strategic protections, delivered in an editable format for investor materials, strategy decks, or academic projects.

 Customizable Excel Spreadsheet
One-sheet Porter's Five Forces for Suez—quickly visualize competitive pressures across shipping, terminals, and logistics with adjustable scores and a radar chart to simplify board-level decisions and scenario testing.
Customers Bargaining Power

Municipal tendering power
Municipal tendering in 2024 uses competitive RFPs with transparent scoring, intensifying price pressure on Suez by making cost the primary decision lever. Large concession sizes and multi‑year terms give municipalities leverage to enforce strict SLAs and heavy penalties for noncompliance. Political oversight prioritizes tariff containment over operator margins, while reputation and past performance heavily influence award and renewal outcomes.
Industrial clients’ alternatives
By 2024 large industrial clients increasingly threaten to in-source or invite 20–30 year build-operate-transfer bids, forcing Suez to compete with global vendors on cost and uptime benchmarks; performance‑linked contracts now shift operational and uptime risk onto Suez; buyers leverage ESG mandates to demand circularity and lower-carbon solutions at flat or declining lifecycle costs.

Contract concentration and renegotiation
High-value concessions, typically 15–30 year contracts, concentrate revenue and amplify buyer leverage at renewal when a few contracts account for the bulk of cash flow. Mid-contract reopeners tied to CPI or regulatory changes can materially reset project economics. Consistent strong KPI attainment strengthens Suez’s bargaining stance, while operational incidents or poor performance can trigger onerous renegotiation terms or termination rights.

Multi-sourcing and modularity
Buyers increasingly multi-source design, O&M, sludge and digital scopes to drive competition and lower bids; standardized specs for discrete lots make switching faster while integrated offers still prevail where risk transfer and single-point liability matter. Interoperability clauses and API commitments limit long-term vendor lock-in. The Suez gateway handles about 12% of global trade, amplifying buyer leverage.
- Scope-splitting: raises competitive bidding
- Standard specs: ease switching on lots
- Integrated deals: win on risk transfer
- Interoperability: reduces vendor lock-in
Price sensitivity vs reliability
Customers trade price sensitivity for reliability in water and waste: essential-service buyers prioritize compliance and uptime, and operators face strict regulatory penalties for failures that can exceed millions in fines and remediation costs in 2024.
Value-added offerings—reuse, waste-to-energy, resource recovery—command premiums as they reduce lifecycle costs; transparent lifecycle costings and total cost of ownership models strengthen pricing defensibility.
- Reliability over price
- High regulatory penalties (2024)
- Premiums for WtE/reuse
- Lifecycle cost transparency
Municipal RFPs 2024: cost-focus, concessions 15–30 yrs, uptime risk, million fines
Municipal RFPs in 2024 prioritize cost, shortening margins; concessions run 15–30 years giving buyers renewal leverage. Large industrial clients push 20–30 year BOT bids and in‑sourcing threats, shifting uptime and ESG risk to Suez. Essential-service demand makes reliability paramount; regulatory penalties can reach millions per incident (2024).
| Metric | Value (2024) |
|---|---|
| Global trade via Suez | ≈12% |
| Concession length | 15–30 years |
| Industrial BOT bids | 20–30 years |
| Regulatory penalties | Millions per incident |
Preview the Actual Deliverable
Suez Porter's Five Forces Analysis
This preview shows the exact Suez Porter's Five Forces Analysis you'll receive immediately after purchase—no placeholders. The document is fully formatted, professionally written, and ready for download and use the moment you buy. No samples or mockups; it's the final deliverable.

Elevate Your Analysis with the Complete Porter's Five Forces Analysis
Suez faces intense competitive dynamics driven by regulatory scrutiny, capital intensity, and evolving customer demands, with supplier and buyer power varying across service lines. This snapshot highlights key pressures—technology disruption, cost sensitivity, and moderate threat from new entrants. Unlock the full Porter's Five Forces Analysis to explore force-by-force ratings, visuals, and actionable strategy recommendations.
Suppliers Bargaining Power
Critical equipment OEMs
Membrane, pump and sensor OEMs are highly concentrated, with the top three membrane suppliers holding roughly 60% of the global market in 2024, giving them pricing power on specialized components. Certification and validation cycles often exceed 12 months and performance guarantees raise explicit switching costs for Suez. Long-term frame agreements (commonly 3–7 years) smooth price spikes but lock standards to select vendors. Co-development deals can create dependency while delivering measurable performance gains for specific projects.
Chemicals and consumables
Coagulants, disinfectants and adsorbents are partly commoditized, capping supplier leverage, but 2024 energy-driven chlor-alkali price volatility and regional feedstock constraints increased supplier bargaining power. High transport and safety compliance costs raise switching friction, while multi-sourcing and hedging reduce exposure but demand strict QA. Tightening 2024 PFAS-free specifications further narrow qualified suppliers.
Energy providers
Operations are energy intensive — industry accounts for about 37% of global final energy consumption (IEA 2023) — exposing Suez to power and gas suppliers’ terms.
Long‑term PPAs, typically 10–20 years, plus on‑site biogas and solar generation materially reduce market exposure.
Regulatory price caps in some markets and growing demand flexibility plus efficiency upgrades strengthen Suez’s negotiating levers with suppliers.
Specialist contractors
Specialist civil and electromechanical contractors exert strong leverage over Suez projects because their skills directly drive timelines and capital intensity; tight labor markets reduce flexibility and elevate rates, while preferred-partner frameworks secure capacity but lock in volumes and pricing dynamics; stringent HSE and compliance filters shrink the eligible pool, increasing contractor bargaining power.
- Skilled labor dependence raises schedule and cost risk
- Labor tightness lifts rates and reduces replanning options
- Preferred-partner deals trade capacity for volume commitment
- High HSE/compliance standards narrow supplier pool
Digital and data platforms
Digital and data platform suppliers (IoT, SCADA, analytics) can create strong lock-in via proprietary stacks and integrations; 2024 industry studies report up to 20% throughput gains tied to such deep integrations, increasing switching costs and supplier leverage. Cybersecurity rules and data residency laws further constrain options, while open-architecture procurement and APIs dilute vendor power.
- Co-own IP to preserve optionality
- Insist on interoperable standards (OPC UA, MQTT)
- Require API-first contracts and escape clauses
Membrane oligopoly (top3 ≈60%) and 10–20y PPAs raise risk; digital adds ~20% throughput
Suppliers range from highly concentrated membrane OEMs (top 3 ≈60% global share in 2024) with long certification cycles and high switching costs, to commoditized chemicals where 2024 feedstock-driven volatility raised leverage. Energy suppliers pose risk given water sector intensity; long PPAs (10–20y) and on-site renewables materially lower exposure. Digital vendors can lock Suez in after integrations that delivered ~20% throughput gains in 2024.
| Supplier | 2024 metric | Switching cost |
|---|---|---|
| Membranes | Top3 ≈60% share | High |
| Chemicals | Feedstock volatility 2024 | Medium |
| Energy | PPAs 10–20y | Medium |
| Digital | ~20% throughput gain 2024 | High |
What is included in the product
Detailed Word Document
Uncovers key drivers of competition, customer influence, and market-entry risks tailored to Suez, with a concise evaluation of supplier and buyer power and their impact on pricing and profitability. Identifies disruptive forces, substitutes, newcomer barriers, and strategic protections, delivered in an editable format for investor materials, strategy decks, or academic projects.
Customizable Excel Spreadsheet
One-sheet Porter's Five Forces for Suez—quickly visualize competitive pressures across shipping, terminals, and logistics with adjustable scores and a radar chart to simplify board-level decisions and scenario testing.
Customers Bargaining Power
Municipal tendering power
Municipal tendering in 2024 uses competitive RFPs with transparent scoring, intensifying price pressure on Suez by making cost the primary decision lever. Large concession sizes and multi‑year terms give municipalities leverage to enforce strict SLAs and heavy penalties for noncompliance. Political oversight prioritizes tariff containment over operator margins, while reputation and past performance heavily influence award and renewal outcomes.
Industrial clients’ alternatives
By 2024 large industrial clients increasingly threaten to in-source or invite 20–30 year build-operate-transfer bids, forcing Suez to compete with global vendors on cost and uptime benchmarks; performance‑linked contracts now shift operational and uptime risk onto Suez; buyers leverage ESG mandates to demand circularity and lower-carbon solutions at flat or declining lifecycle costs.
Contract concentration and renegotiation
High-value concessions, typically 15–30 year contracts, concentrate revenue and amplify buyer leverage at renewal when a few contracts account for the bulk of cash flow. Mid-contract reopeners tied to CPI or regulatory changes can materially reset project economics. Consistent strong KPI attainment strengthens Suez’s bargaining stance, while operational incidents or poor performance can trigger onerous renegotiation terms or termination rights.
Multi-sourcing and modularity
Buyers increasingly multi-source design, O&M, sludge and digital scopes to drive competition and lower bids; standardized specs for discrete lots make switching faster while integrated offers still prevail where risk transfer and single-point liability matter. Interoperability clauses and API commitments limit long-term vendor lock-in. The Suez gateway handles about 12% of global trade, amplifying buyer leverage.
- Scope-splitting: raises competitive bidding
- Standard specs: ease switching on lots
- Integrated deals: win on risk transfer
- Interoperability: reduces vendor lock-in
Price sensitivity vs reliability
Customers trade price sensitivity for reliability in water and waste: essential-service buyers prioritize compliance and uptime, and operators face strict regulatory penalties for failures that can exceed millions in fines and remediation costs in 2024.
Value-added offerings—reuse, waste-to-energy, resource recovery—command premiums as they reduce lifecycle costs; transparent lifecycle costings and total cost of ownership models strengthen pricing defensibility.
- Reliability over price
- High regulatory penalties (2024)
- Premiums for WtE/reuse
- Lifecycle cost transparency
Municipal RFPs 2024: cost-focus, concessions 15–30 yrs, uptime risk, million fines
Municipal RFPs in 2024 prioritize cost, shortening margins; concessions run 15–30 years giving buyers renewal leverage. Large industrial clients push 20–30 year BOT bids and in‑sourcing threats, shifting uptime and ESG risk to Suez. Essential-service demand makes reliability paramount; regulatory penalties can reach millions per incident (2024).
| Metric | Value (2024) |
|---|---|
| Global trade via Suez | ≈12% |
| Concession length | 15–30 years |
| Industrial BOT bids | 20–30 years |
| Regulatory penalties | Millions per incident |
Preview the Actual Deliverable
Suez Porter's Five Forces Analysis
This preview shows the exact Suez Porter's Five Forces Analysis you'll receive immediately after purchase—no placeholders. The document is fully formatted, professionally written, and ready for download and use the moment you buy. No samples or mockups; it's the final deliverable.
Description
Elevate Your Analysis with the Complete Porter's Five Forces Analysis
Suez faces intense competitive dynamics driven by regulatory scrutiny, capital intensity, and evolving customer demands, with supplier and buyer power varying across service lines. This snapshot highlights key pressures—technology disruption, cost sensitivity, and moderate threat from new entrants. Unlock the full Porter's Five Forces Analysis to explore force-by-force ratings, visuals, and actionable strategy recommendations.
Suppliers Bargaining Power
Critical equipment OEMs
Membrane, pump and sensor OEMs are highly concentrated, with the top three membrane suppliers holding roughly 60% of the global market in 2024, giving them pricing power on specialized components. Certification and validation cycles often exceed 12 months and performance guarantees raise explicit switching costs for Suez. Long-term frame agreements (commonly 3–7 years) smooth price spikes but lock standards to select vendors. Co-development deals can create dependency while delivering measurable performance gains for specific projects.
Chemicals and consumables
Coagulants, disinfectants and adsorbents are partly commoditized, capping supplier leverage, but 2024 energy-driven chlor-alkali price volatility and regional feedstock constraints increased supplier bargaining power. High transport and safety compliance costs raise switching friction, while multi-sourcing and hedging reduce exposure but demand strict QA. Tightening 2024 PFAS-free specifications further narrow qualified suppliers.
Energy providers
Operations are energy intensive — industry accounts for about 37% of global final energy consumption (IEA 2023) — exposing Suez to power and gas suppliers’ terms.
Long‑term PPAs, typically 10–20 years, plus on‑site biogas and solar generation materially reduce market exposure.
Regulatory price caps in some markets and growing demand flexibility plus efficiency upgrades strengthen Suez’s negotiating levers with suppliers.
Specialist contractors
Specialist civil and electromechanical contractors exert strong leverage over Suez projects because their skills directly drive timelines and capital intensity; tight labor markets reduce flexibility and elevate rates, while preferred-partner frameworks secure capacity but lock in volumes and pricing dynamics; stringent HSE and compliance filters shrink the eligible pool, increasing contractor bargaining power.
- Skilled labor dependence raises schedule and cost risk
- Labor tightness lifts rates and reduces replanning options
- Preferred-partner deals trade capacity for volume commitment
- High HSE/compliance standards narrow supplier pool
Digital and data platforms
Digital and data platform suppliers (IoT, SCADA, analytics) can create strong lock-in via proprietary stacks and integrations; 2024 industry studies report up to 20% throughput gains tied to such deep integrations, increasing switching costs and supplier leverage. Cybersecurity rules and data residency laws further constrain options, while open-architecture procurement and APIs dilute vendor power.
- Co-own IP to preserve optionality
- Insist on interoperable standards (OPC UA, MQTT)
- Require API-first contracts and escape clauses
Membrane oligopoly (top3 ≈60%) and 10–20y PPAs raise risk; digital adds ~20% throughput
Suppliers range from highly concentrated membrane OEMs (top 3 ≈60% global share in 2024) with long certification cycles and high switching costs, to commoditized chemicals where 2024 feedstock-driven volatility raised leverage. Energy suppliers pose risk given water sector intensity; long PPAs (10–20y) and on-site renewables materially lower exposure. Digital vendors can lock Suez in after integrations that delivered ~20% throughput gains in 2024.
| Supplier | 2024 metric | Switching cost |
|---|---|---|
| Membranes | Top3 ≈60% share | High |
| Chemicals | Feedstock volatility 2024 | Medium |
| Energy | PPAs 10–20y | Medium |
| Digital | ~20% throughput gain 2024 | High |
What is included in the product
Detailed Word Document
Uncovers key drivers of competition, customer influence, and market-entry risks tailored to Suez, with a concise evaluation of supplier and buyer power and their impact on pricing and profitability. Identifies disruptive forces, substitutes, newcomer barriers, and strategic protections, delivered in an editable format for investor materials, strategy decks, or academic projects.
Customizable Excel Spreadsheet
One-sheet Porter's Five Forces for Suez—quickly visualize competitive pressures across shipping, terminals, and logistics with adjustable scores and a radar chart to simplify board-level decisions and scenario testing.
Customers Bargaining Power
Municipal tendering power
Municipal tendering in 2024 uses competitive RFPs with transparent scoring, intensifying price pressure on Suez by making cost the primary decision lever. Large concession sizes and multi‑year terms give municipalities leverage to enforce strict SLAs and heavy penalties for noncompliance. Political oversight prioritizes tariff containment over operator margins, while reputation and past performance heavily influence award and renewal outcomes.
Industrial clients’ alternatives
By 2024 large industrial clients increasingly threaten to in-source or invite 20–30 year build-operate-transfer bids, forcing Suez to compete with global vendors on cost and uptime benchmarks; performance‑linked contracts now shift operational and uptime risk onto Suez; buyers leverage ESG mandates to demand circularity and lower-carbon solutions at flat or declining lifecycle costs.
Contract concentration and renegotiation
High-value concessions, typically 15–30 year contracts, concentrate revenue and amplify buyer leverage at renewal when a few contracts account for the bulk of cash flow. Mid-contract reopeners tied to CPI or regulatory changes can materially reset project economics. Consistent strong KPI attainment strengthens Suez’s bargaining stance, while operational incidents or poor performance can trigger onerous renegotiation terms or termination rights.
Multi-sourcing and modularity
Buyers increasingly multi-source design, O&M, sludge and digital scopes to drive competition and lower bids; standardized specs for discrete lots make switching faster while integrated offers still prevail where risk transfer and single-point liability matter. Interoperability clauses and API commitments limit long-term vendor lock-in. The Suez gateway handles about 12% of global trade, amplifying buyer leverage.
- Scope-splitting: raises competitive bidding
- Standard specs: ease switching on lots
- Integrated deals: win on risk transfer
- Interoperability: reduces vendor lock-in
Price sensitivity vs reliability
Customers trade price sensitivity for reliability in water and waste: essential-service buyers prioritize compliance and uptime, and operators face strict regulatory penalties for failures that can exceed millions in fines and remediation costs in 2024.
Value-added offerings—reuse, waste-to-energy, resource recovery—command premiums as they reduce lifecycle costs; transparent lifecycle costings and total cost of ownership models strengthen pricing defensibility.
- Reliability over price
- High regulatory penalties (2024)
- Premiums for WtE/reuse
- Lifecycle cost transparency
Municipal RFPs 2024: cost-focus, concessions 15–30 yrs, uptime risk, million fines
Municipal RFPs in 2024 prioritize cost, shortening margins; concessions run 15–30 years giving buyers renewal leverage. Large industrial clients push 20–30 year BOT bids and in‑sourcing threats, shifting uptime and ESG risk to Suez. Essential-service demand makes reliability paramount; regulatory penalties can reach millions per incident (2024).
| Metric | Value (2024) |
|---|---|
| Global trade via Suez | ≈12% |
| Concession length | 15–30 years |
| Industrial BOT bids | 20–30 years |
| Regulatory penalties | Millions per incident |
Preview the Actual Deliverable
Suez Porter's Five Forces Analysis
This preview shows the exact Suez Porter's Five Forces Analysis you'll receive immediately after purchase—no placeholders. The document is fully formatted, professionally written, and ready for download and use the moment you buy. No samples or mockups; it's the final deliverable.











