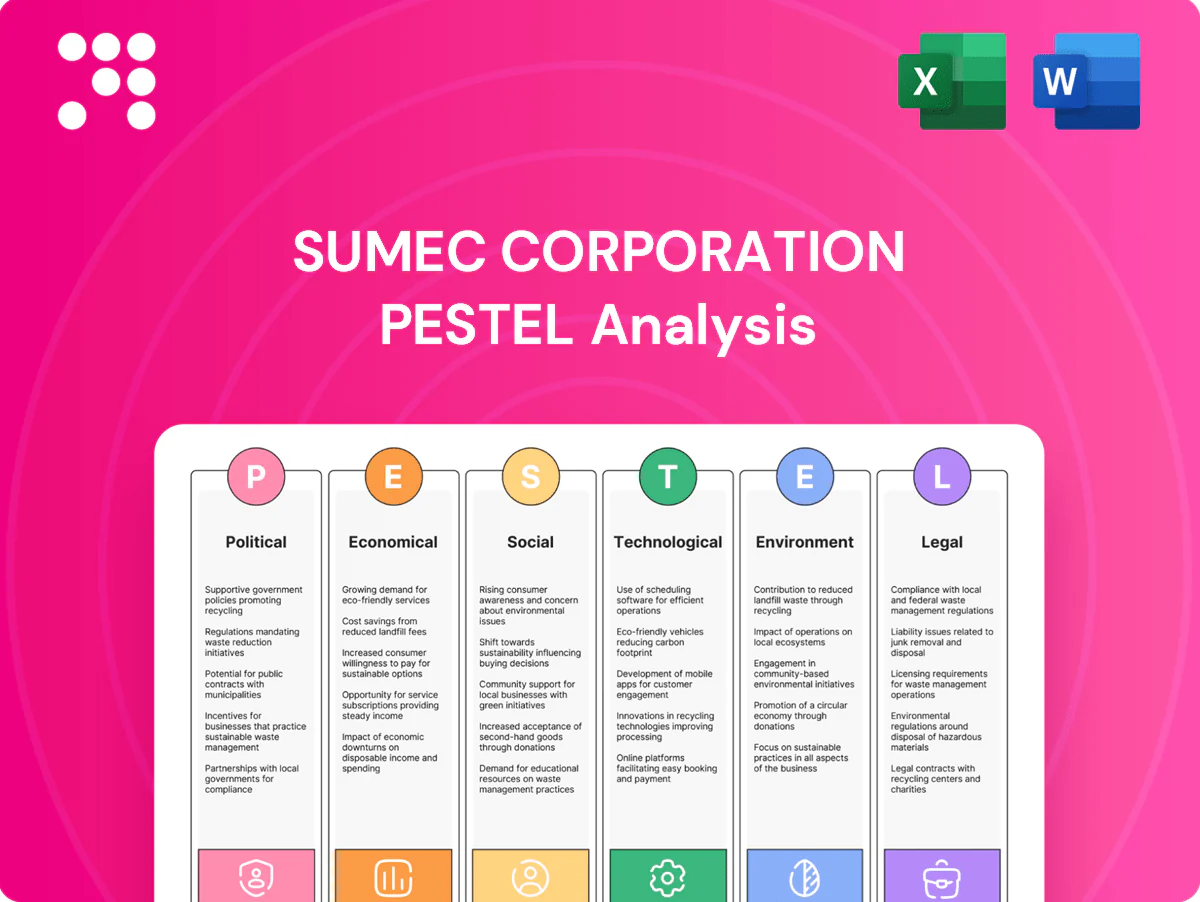
Sumec Corporation PESTLE Analysis

Skip the Research. Get the Strategy.
Discover how political shifts, economic cycles, and technological advances shape Sumec Corporation’s strategic horizon in our concise PESTLE snapshot. This analysis highlights regulatory risks, market drivers, and sustainability pressures that matter to investors and planners. Buy the full PESTLE for a complete, editable report with actionable insights you can deploy immediately.
Political factors

Geopolitics and BRI exposure
As a Chinese state-linked enterprise (SUMEC, 600710.SH), SUMEC’s overseas contracting draws clear benefits from Belt and Road Initiative support — the BRI spans about 149 countries and 32 intl. orgs as of 2024 — but shifting geopolitics alters sentiment and access. Project entry can expand in friendly jurisdictions and tighten in sensitive ones, so scenario planning for country entry/exit and diversified market portfolios mitigates concentration risk. Government-to-government MOUs can accelerate deal flow yet introduce political risk cycles tied to bilateral relations.
Tariffs and export controls
Trade frictions and export controls on dual-use tech (notably U.S./EU/China measures) and retaliatory tariffs—often reaching 25% on key machine parts—disrupt Sumec’s machinery and energy equipment flows, raising lead times and working capital needs. Localizing assembly or using bonded zones reduces tariff pain, while proactive tariff classification and licensing management preserves delivery schedules and cuts clearance delays.

State policy alignment
China’s industrial, energy and environmental policies — including the 14th Five-Year Plan and commitments to peak emissions before 2030 and carbon neutrality by 2060 — shape financing and sector prioritization. Subsidies and directed credit increasingly favor renewables, grid equipment and efficiency upgrades; wind and solar capacity exceeded 1,200 GW by end-2023. Aligning Sumec’s product mix with policy roadmaps improves bid competitiveness. Policy reversals demand agile product and financing adjustments.

Host-country stability and procurement
Infrastructure contracts for Sumec hinge on host-country political stability, procurement transparency and sovereign creditworthiness; multilateral-backed tenders (over $100 billion annual procurement globally) provide clearer frameworks but require stricter compliance, while election cycles and cabinet reshuffles commonly delay approvals or trigger renegotiation; political risk insurance (e.g., MIGA, private PRI) is used to de-risk receivables.
- Stability: procurement depends on sovereign credit
- Timing: elections/cabinet changes delay approvals
- Multilateral: clearer rules, higher compliance
- Mitigation: political risk insurance for receivables
Export credit and diplomatic support
Access to China policy banks (China Exim, CDB) and export credit insurance (Sinosure) boosts Sumec’s EPC competitiveness in bids and financing; China’s Belt and Road covers 140+ countries as of 2024, expanding project pipelines. Strong diplomatic ties can speed permits and customs clearance, but visible state backing raises scrutiny in rival blocs. Diversifying financing preserves neutrality and reduces geopolitical risk.
- Policy banks: preferential financing, export credit support
- Diplomacy: faster permits/customs in friendly states
- Risk: increased scrutiny from US/EU-aligned blocs
- Mitigation: balanced commercial and sovereign funding
BRI 149 boosts bids; tariffs 25% squeeze chains
State-linked status yields BRI advantages (149 countries, 2024) but raises scrutiny; trade frictions and export controls (tariffs up to 25%) squeeze supply chains and working capital. Policy bank support and Sinosure export credit boost bids; renewables push (1,200 GW capacity end-2023) redirects project mix and finance toward green equipment.
| Factor | Impact | Data/Metric | Mitigation |
|---|---|---|---|
| Geopolitics | Market access variability | BRI: 149 countries (2024) | Scenario planning |
| Trade controls | Costs, delays | Tariffs up to 25% | Localize/ bonded zones |
| Financing | Bid competitiveness | Renewables 1,200 GW (2023) | Diversify funding/PRI |
What is included in the product
 Detailed Word Document
Explores how macro-environmental forces—Political, Economic, Social, Technological, Environmental and Legal—uniquely affect Sumec Corporation’s manufacturing, trading and global services, with data-backed trends, sector-specific examples and forward-looking insights to inform strategy, risk mitigation and investor communications.

 Customizable Excel Spreadsheet
A concise, visually segmented PESTLE summary for Sumec Corporation that relieves briefing pain points—easy to drop into presentations, annotate for regional context, and share across teams to streamline risk and strategy discussions.
Economic factors

Global infrastructure cycle
Global capital spending on energy, transport and water underpins SUMEC’s order book: global infrastructure needs are estimated at about 94 trillion USD to 2040 (Global Infrastructure Hub), while energy investment reached ~2.4 trillion USD in 2023 (IEA). Fiscal stimulus, rising urbanization (China urbanization ~64.7% in 2023, World Bank) and grid upgrades improve pipeline visibility. Downturns in construction or public budgets compress EPC opportunities, but SUMEC’s sector-spread smooths cyclicality.
Commodity and freight volatility
Input costs for steel, copper and shipping can swing margins dramatically; container spot rates remained roughly 50% above 2019 averages into 2024 while metal price swings kept input volatility high. Hedging and index-linked contracts are used to protect profitability on long-lead projects. Logistics disruptions force higher inventory buffers and lift financing costs, and dual-sourcing plus nearshoring reduce exposure to these swings.

FX and interest rate dynamics
Multi-currency contracts leave Sumec cash flows exposed to FX swings and global rate cycles; DXY averaged ~104 in 2024 and USD/EUR volatility spiked ±6% YTD, amplifying translation risk. Natural hedges, forwards and local-currency project financing (China 1yr LPR 3.45%, ECB depo ~4.0%, Fed funds ~5.25%) stabilize returns. Rising policy rates raise discount rates and compress project NPVs, while a robust treasury policy preserves bid competitiveness.

Emerging market demand
Industrialization across Asia, Africa and the Middle East sustains machinery and power demand; Asia‑Pacific equipment demand rose ~6% CAGR 2021–24 while IMF put Sub‑Saharan growth near 3.7% in 2024, supporting infrastructure spend. Credit constraints and sovereign risk delay pipeline-to-revenue conversion; structured finance has unlocked projects in constrained markets. After‑sales and O&M can lift lifetime value by 15–25%.
- Industrialization drive: Asia/Africa/Middle East
- Risk: credit constraints, sovereign exposure
- Mitigation: structured finance + 15–25% after-sales lift
Global growth and trade elasticity
Global GDP growth near 3.2% (IMF 2024) and modest trade volume expansion (WTO ~1.5% 2024) tie directly to demand for Sumec’s machinery and ship-related orders; slowdowns cut utilization and newbuild appetite, lowering capital-expenditure cycles. Counter-cyclical maintenance and retrofits historically sustain revenue during downturns, while diversification into environmental services—growing as regulatory spending rises—buffers volatility.
- Trade-GDP link: IMF global GDP ~3.2% (2024)
- Newbuild risk: lower trade reduces ship orders and machinery capex
- Resilience: maintenance/retrofit demand is counter-cyclical
- Hedge: environmental services diversify revenue
BRI 149 boosts bids; tariffs 25% squeeze chains
SUMEC benefits from sustained infrastructure and energy capex (global infra need ~94tn to 2040; energy investment ~2.4tn in 2023) and rising APAC/Africa industrialization, but input-cost volatility (steel, copper, freight) and FX/rate swings compress margins. Structured finance, hedging and after-sales (lift 15–25%) mitigate project risk and smooth cyclicality.
| Metric | Value |
|---|---|
| Global GDP (2024, IMF) | 3.2% |
| Fed funds (mid‑2025) | ≈5.25% |
| Container rates vs 2019 | ≈+50% |
Same Document Delivered
Sumec Corporation PESTLE Analysis
The preview shown here is the exact Sumec Corporation PESTLE Analysis you’ll receive after purchase—fully formatted and ready to use. No placeholders or teasers; this is the final, professionally structured file. After payment you can download this identical document immediately.

Skip the Research. Get the Strategy.
Discover how political shifts, economic cycles, and technological advances shape Sumec Corporation’s strategic horizon in our concise PESTLE snapshot. This analysis highlights regulatory risks, market drivers, and sustainability pressures that matter to investors and planners. Buy the full PESTLE for a complete, editable report with actionable insights you can deploy immediately.
Political factors
Geopolitics and BRI exposure
As a Chinese state-linked enterprise (SUMEC, 600710.SH), SUMEC’s overseas contracting draws clear benefits from Belt and Road Initiative support — the BRI spans about 149 countries and 32 intl. orgs as of 2024 — but shifting geopolitics alters sentiment and access. Project entry can expand in friendly jurisdictions and tighten in sensitive ones, so scenario planning for country entry/exit and diversified market portfolios mitigates concentration risk. Government-to-government MOUs can accelerate deal flow yet introduce political risk cycles tied to bilateral relations.
Tariffs and export controls
Trade frictions and export controls on dual-use tech (notably U.S./EU/China measures) and retaliatory tariffs—often reaching 25% on key machine parts—disrupt Sumec’s machinery and energy equipment flows, raising lead times and working capital needs. Localizing assembly or using bonded zones reduces tariff pain, while proactive tariff classification and licensing management preserves delivery schedules and cuts clearance delays.
State policy alignment
China’s industrial, energy and environmental policies — including the 14th Five-Year Plan and commitments to peak emissions before 2030 and carbon neutrality by 2060 — shape financing and sector prioritization. Subsidies and directed credit increasingly favor renewables, grid equipment and efficiency upgrades; wind and solar capacity exceeded 1,200 GW by end-2023. Aligning Sumec’s product mix with policy roadmaps improves bid competitiveness. Policy reversals demand agile product and financing adjustments.
Host-country stability and procurement
Infrastructure contracts for Sumec hinge on host-country political stability, procurement transparency and sovereign creditworthiness; multilateral-backed tenders (over $100 billion annual procurement globally) provide clearer frameworks but require stricter compliance, while election cycles and cabinet reshuffles commonly delay approvals or trigger renegotiation; political risk insurance (e.g., MIGA, private PRI) is used to de-risk receivables.
- Stability: procurement depends on sovereign credit
- Timing: elections/cabinet changes delay approvals
- Multilateral: clearer rules, higher compliance
- Mitigation: political risk insurance for receivables
Export credit and diplomatic support
Access to China policy banks (China Exim, CDB) and export credit insurance (Sinosure) boosts Sumec’s EPC competitiveness in bids and financing; China’s Belt and Road covers 140+ countries as of 2024, expanding project pipelines. Strong diplomatic ties can speed permits and customs clearance, but visible state backing raises scrutiny in rival blocs. Diversifying financing preserves neutrality and reduces geopolitical risk.
- Policy banks: preferential financing, export credit support
- Diplomacy: faster permits/customs in friendly states
- Risk: increased scrutiny from US/EU-aligned blocs
- Mitigation: balanced commercial and sovereign funding
BRI 149 boosts bids; tariffs 25% squeeze chains
State-linked status yields BRI advantages (149 countries, 2024) but raises scrutiny; trade frictions and export controls (tariffs up to 25%) squeeze supply chains and working capital. Policy bank support and Sinosure export credit boost bids; renewables push (1,200 GW capacity end-2023) redirects project mix and finance toward green equipment.
| Factor | Impact | Data/Metric | Mitigation |
|---|---|---|---|
| Geopolitics | Market access variability | BRI: 149 countries (2024) | Scenario planning |
| Trade controls | Costs, delays | Tariffs up to 25% | Localize/ bonded zones |
| Financing | Bid competitiveness | Renewables 1,200 GW (2023) | Diversify funding/PRI |
What is included in the product
Detailed Word Document
Explores how macro-environmental forces—Political, Economic, Social, Technological, Environmental and Legal—uniquely affect Sumec Corporation’s manufacturing, trading and global services, with data-backed trends, sector-specific examples and forward-looking insights to inform strategy, risk mitigation and investor communications.
Customizable Excel Spreadsheet
A concise, visually segmented PESTLE summary for Sumec Corporation that relieves briefing pain points—easy to drop into presentations, annotate for regional context, and share across teams to streamline risk and strategy discussions.
Economic factors
Global infrastructure cycle
Global capital spending on energy, transport and water underpins SUMEC’s order book: global infrastructure needs are estimated at about 94 trillion USD to 2040 (Global Infrastructure Hub), while energy investment reached ~2.4 trillion USD in 2023 (IEA). Fiscal stimulus, rising urbanization (China urbanization ~64.7% in 2023, World Bank) and grid upgrades improve pipeline visibility. Downturns in construction or public budgets compress EPC opportunities, but SUMEC’s sector-spread smooths cyclicality.
Commodity and freight volatility
Input costs for steel, copper and shipping can swing margins dramatically; container spot rates remained roughly 50% above 2019 averages into 2024 while metal price swings kept input volatility high. Hedging and index-linked contracts are used to protect profitability on long-lead projects. Logistics disruptions force higher inventory buffers and lift financing costs, and dual-sourcing plus nearshoring reduce exposure to these swings.
FX and interest rate dynamics
Multi-currency contracts leave Sumec cash flows exposed to FX swings and global rate cycles; DXY averaged ~104 in 2024 and USD/EUR volatility spiked ±6% YTD, amplifying translation risk. Natural hedges, forwards and local-currency project financing (China 1yr LPR 3.45%, ECB depo ~4.0%, Fed funds ~5.25%) stabilize returns. Rising policy rates raise discount rates and compress project NPVs, while a robust treasury policy preserves bid competitiveness.
Emerging market demand
Industrialization across Asia, Africa and the Middle East sustains machinery and power demand; Asia‑Pacific equipment demand rose ~6% CAGR 2021–24 while IMF put Sub‑Saharan growth near 3.7% in 2024, supporting infrastructure spend. Credit constraints and sovereign risk delay pipeline-to-revenue conversion; structured finance has unlocked projects in constrained markets. After‑sales and O&M can lift lifetime value by 15–25%.
- Industrialization drive: Asia/Africa/Middle East
- Risk: credit constraints, sovereign exposure
- Mitigation: structured finance + 15–25% after-sales lift
Global growth and trade elasticity
Global GDP growth near 3.2% (IMF 2024) and modest trade volume expansion (WTO ~1.5% 2024) tie directly to demand for Sumec’s machinery and ship-related orders; slowdowns cut utilization and newbuild appetite, lowering capital-expenditure cycles. Counter-cyclical maintenance and retrofits historically sustain revenue during downturns, while diversification into environmental services—growing as regulatory spending rises—buffers volatility.
- Trade-GDP link: IMF global GDP ~3.2% (2024)
- Newbuild risk: lower trade reduces ship orders and machinery capex
- Resilience: maintenance/retrofit demand is counter-cyclical
- Hedge: environmental services diversify revenue
BRI 149 boosts bids; tariffs 25% squeeze chains
SUMEC benefits from sustained infrastructure and energy capex (global infra need ~94tn to 2040; energy investment ~2.4tn in 2023) and rising APAC/Africa industrialization, but input-cost volatility (steel, copper, freight) and FX/rate swings compress margins. Structured finance, hedging and after-sales (lift 15–25%) mitigate project risk and smooth cyclicality.
| Metric | Value |
|---|---|
| Global GDP (2024, IMF) | 3.2% |
| Fed funds (mid‑2025) | ≈5.25% |
| Container rates vs 2019 | ≈+50% |
Same Document Delivered
Sumec Corporation PESTLE Analysis
The preview shown here is the exact Sumec Corporation PESTLE Analysis you’ll receive after purchase—fully formatted and ready to use. No placeholders or teasers; this is the final, professionally structured file. After payment you can download this identical document immediately.
Original: $10.00
-65%$10.00
$3.50Description
Skip the Research. Get the Strategy.
Discover how political shifts, economic cycles, and technological advances shape Sumec Corporation’s strategic horizon in our concise PESTLE snapshot. This analysis highlights regulatory risks, market drivers, and sustainability pressures that matter to investors and planners. Buy the full PESTLE for a complete, editable report with actionable insights you can deploy immediately.
Political factors
Geopolitics and BRI exposure
As a Chinese state-linked enterprise (SUMEC, 600710.SH), SUMEC’s overseas contracting draws clear benefits from Belt and Road Initiative support — the BRI spans about 149 countries and 32 intl. orgs as of 2024 — but shifting geopolitics alters sentiment and access. Project entry can expand in friendly jurisdictions and tighten in sensitive ones, so scenario planning for country entry/exit and diversified market portfolios mitigates concentration risk. Government-to-government MOUs can accelerate deal flow yet introduce political risk cycles tied to bilateral relations.
Tariffs and export controls
Trade frictions and export controls on dual-use tech (notably U.S./EU/China measures) and retaliatory tariffs—often reaching 25% on key machine parts—disrupt Sumec’s machinery and energy equipment flows, raising lead times and working capital needs. Localizing assembly or using bonded zones reduces tariff pain, while proactive tariff classification and licensing management preserves delivery schedules and cuts clearance delays.
State policy alignment
China’s industrial, energy and environmental policies — including the 14th Five-Year Plan and commitments to peak emissions before 2030 and carbon neutrality by 2060 — shape financing and sector prioritization. Subsidies and directed credit increasingly favor renewables, grid equipment and efficiency upgrades; wind and solar capacity exceeded 1,200 GW by end-2023. Aligning Sumec’s product mix with policy roadmaps improves bid competitiveness. Policy reversals demand agile product and financing adjustments.
Host-country stability and procurement
Infrastructure contracts for Sumec hinge on host-country political stability, procurement transparency and sovereign creditworthiness; multilateral-backed tenders (over $100 billion annual procurement globally) provide clearer frameworks but require stricter compliance, while election cycles and cabinet reshuffles commonly delay approvals or trigger renegotiation; political risk insurance (e.g., MIGA, private PRI) is used to de-risk receivables.
- Stability: procurement depends on sovereign credit
- Timing: elections/cabinet changes delay approvals
- Multilateral: clearer rules, higher compliance
- Mitigation: political risk insurance for receivables
Export credit and diplomatic support
Access to China policy banks (China Exim, CDB) and export credit insurance (Sinosure) boosts Sumec’s EPC competitiveness in bids and financing; China’s Belt and Road covers 140+ countries as of 2024, expanding project pipelines. Strong diplomatic ties can speed permits and customs clearance, but visible state backing raises scrutiny in rival blocs. Diversifying financing preserves neutrality and reduces geopolitical risk.
- Policy banks: preferential financing, export credit support
- Diplomacy: faster permits/customs in friendly states
- Risk: increased scrutiny from US/EU-aligned blocs
- Mitigation: balanced commercial and sovereign funding
BRI 149 boosts bids; tariffs 25% squeeze chains
State-linked status yields BRI advantages (149 countries, 2024) but raises scrutiny; trade frictions and export controls (tariffs up to 25%) squeeze supply chains and working capital. Policy bank support and Sinosure export credit boost bids; renewables push (1,200 GW capacity end-2023) redirects project mix and finance toward green equipment.
| Factor | Impact | Data/Metric | Mitigation |
|---|---|---|---|
| Geopolitics | Market access variability | BRI: 149 countries (2024) | Scenario planning |
| Trade controls | Costs, delays | Tariffs up to 25% | Localize/ bonded zones |
| Financing | Bid competitiveness | Renewables 1,200 GW (2023) | Diversify funding/PRI |
What is included in the product
Detailed Word Document
Explores how macro-environmental forces—Political, Economic, Social, Technological, Environmental and Legal—uniquely affect Sumec Corporation’s manufacturing, trading and global services, with data-backed trends, sector-specific examples and forward-looking insights to inform strategy, risk mitigation and investor communications.
Customizable Excel Spreadsheet
A concise, visually segmented PESTLE summary for Sumec Corporation that relieves briefing pain points—easy to drop into presentations, annotate for regional context, and share across teams to streamline risk and strategy discussions.
Economic factors
Global infrastructure cycle
Global capital spending on energy, transport and water underpins SUMEC’s order book: global infrastructure needs are estimated at about 94 trillion USD to 2040 (Global Infrastructure Hub), while energy investment reached ~2.4 trillion USD in 2023 (IEA). Fiscal stimulus, rising urbanization (China urbanization ~64.7% in 2023, World Bank) and grid upgrades improve pipeline visibility. Downturns in construction or public budgets compress EPC opportunities, but SUMEC’s sector-spread smooths cyclicality.
Commodity and freight volatility
Input costs for steel, copper and shipping can swing margins dramatically; container spot rates remained roughly 50% above 2019 averages into 2024 while metal price swings kept input volatility high. Hedging and index-linked contracts are used to protect profitability on long-lead projects. Logistics disruptions force higher inventory buffers and lift financing costs, and dual-sourcing plus nearshoring reduce exposure to these swings.
FX and interest rate dynamics
Multi-currency contracts leave Sumec cash flows exposed to FX swings and global rate cycles; DXY averaged ~104 in 2024 and USD/EUR volatility spiked ±6% YTD, amplifying translation risk. Natural hedges, forwards and local-currency project financing (China 1yr LPR 3.45%, ECB depo ~4.0%, Fed funds ~5.25%) stabilize returns. Rising policy rates raise discount rates and compress project NPVs, while a robust treasury policy preserves bid competitiveness.
Emerging market demand
Industrialization across Asia, Africa and the Middle East sustains machinery and power demand; Asia‑Pacific equipment demand rose ~6% CAGR 2021–24 while IMF put Sub‑Saharan growth near 3.7% in 2024, supporting infrastructure spend. Credit constraints and sovereign risk delay pipeline-to-revenue conversion; structured finance has unlocked projects in constrained markets. After‑sales and O&M can lift lifetime value by 15–25%.
- Industrialization drive: Asia/Africa/Middle East
- Risk: credit constraints, sovereign exposure
- Mitigation: structured finance + 15–25% after-sales lift
Global growth and trade elasticity
Global GDP growth near 3.2% (IMF 2024) and modest trade volume expansion (WTO ~1.5% 2024) tie directly to demand for Sumec’s machinery and ship-related orders; slowdowns cut utilization and newbuild appetite, lowering capital-expenditure cycles. Counter-cyclical maintenance and retrofits historically sustain revenue during downturns, while diversification into environmental services—growing as regulatory spending rises—buffers volatility.
- Trade-GDP link: IMF global GDP ~3.2% (2024)
- Newbuild risk: lower trade reduces ship orders and machinery capex
- Resilience: maintenance/retrofit demand is counter-cyclical
- Hedge: environmental services diversify revenue
BRI 149 boosts bids; tariffs 25% squeeze chains
SUMEC benefits from sustained infrastructure and energy capex (global infra need ~94tn to 2040; energy investment ~2.4tn in 2023) and rising APAC/Africa industrialization, but input-cost volatility (steel, copper, freight) and FX/rate swings compress margins. Structured finance, hedging and after-sales (lift 15–25%) mitigate project risk and smooth cyclicality.
| Metric | Value |
|---|---|
| Global GDP (2024, IMF) | 3.2% |
| Fed funds (mid‑2025) | ≈5.25% |
| Container rates vs 2019 | ≈+50% |
Same Document Delivered
Sumec Corporation PESTLE Analysis
The preview shown here is the exact Sumec Corporation PESTLE Analysis you’ll receive after purchase—fully formatted and ready to use. No placeholders or teasers; this is the final, professionally structured file. After payment you can download this identical document immediately.











