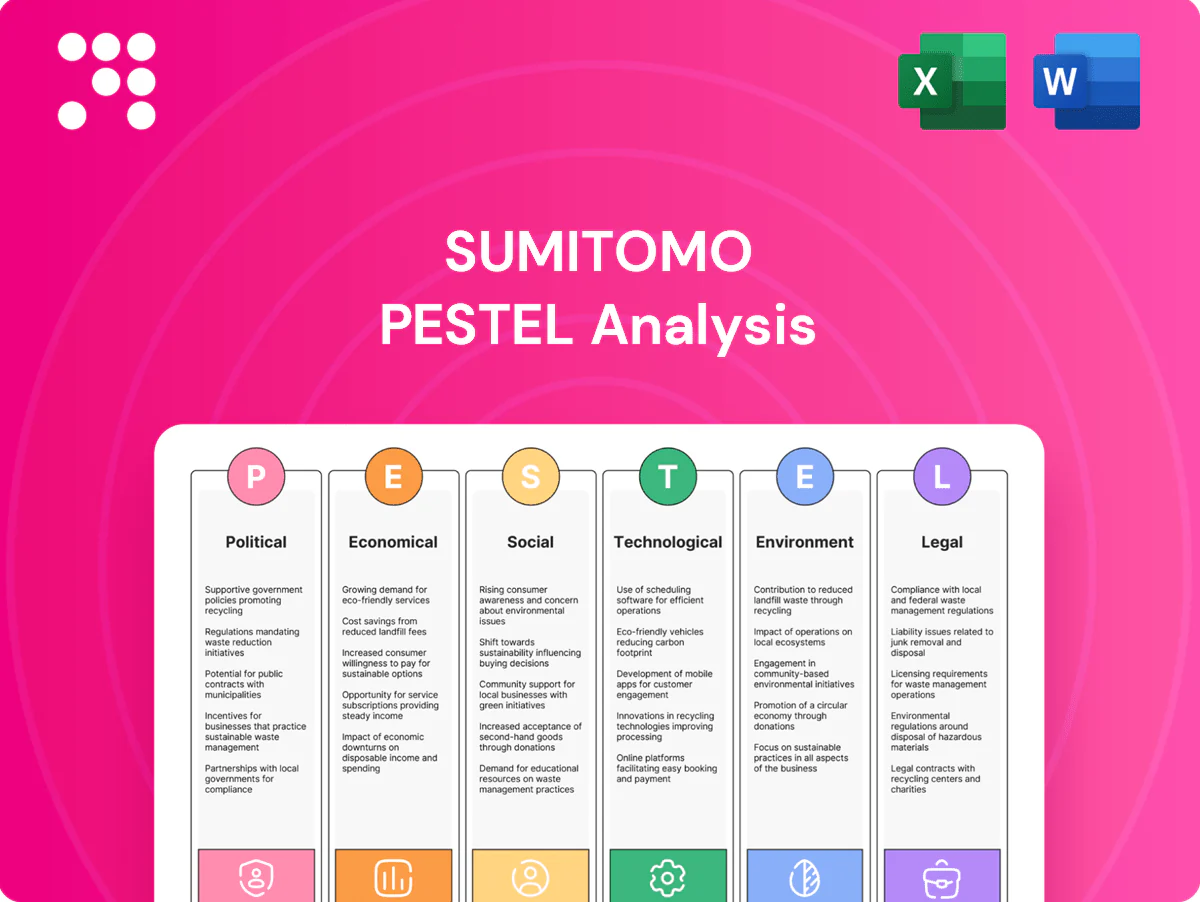
Sumitomo PESTLE Analysis

Your Competitive Advantage Starts with This Report
Our Sumitomo PESTLE distills political, economic, social, technological, legal and environmental forces shaping the group's strategy and risks. Use these insights to anticipate regulatory shifts, supply-chain impacts and growth pockets. Buy the full analysis for the detailed, actionable intelligence ready for immediate use.
Political factors

Geopolitical tensions and supply security
Heightened U.S.–China rivalry and tightened U.S. export controls on advanced semiconductors, Russia-related sanctions (Russia supplies roughly 40% of global palladium) and Middle East risks (Strait of Hormuz carries about 20% of seaborne oil) can disrupt metals, energy and electronics lanes Sumitomo relies on. The firm must diversify suppliers, build inventory buffers in critical categories, buy political risk insurance and pursue regionalized supply strategies and local government partnerships to preserve access.
Trade policy and tariffs
Shifts in tariffs and export controls—e.g., US steel/aluminum duties (25%/10%) and Section 301 measures covering about $360bn of Chinese imports—materially change project economics across metals, semiconductors and energy equipment. Sumitomo needs agile contracts to pass costs or re-route flows and should use classification, origin planning and bonded zones to preserve margins. Ongoing monitoring of WTO rulings and new bilateral deals (WTO MFN average ~2.9% in 2023) must inform routes to market.

Industrial policy and subsidies
Global incentives for infrastructure, renewables, EVs and semiconductors (e.g., US Inflation Reduction Act ~$369B, CHIPS incentives ~$52B) create co-investment opportunities for Sumitomo across projects and supply chains. Competing national content rules force local manufacturing or JV footprints, increasing strategic capex but unlocking grants. Sumitomo can arbitrage multi-country programs to optimize capex and maximize grant capture. Policy-driven demand visibility strengthens long-term offtake and financing prospects.

Host-country stability and governance
Host-country stability and governance affect Sumitomo resource and infrastructure projects through regime change, permit delays and community opposition; World Bank Worldwide Governance Indicators use a scale roughly from -2.5 to 2.5 to benchmark such risks.
Robust stakeholder mapping and ESG engagement reduce likelihood of disruptions and improve social license to operate.
Stabilization clauses and political risk insurance enhance bankability; local content development strengthens resilience and local support.
- WGI scale: -2.5 to 2.5
- Mitigate: stakeholder mapping, ESG engagement
- De-risk: stabilization clauses, political risk cover
- Resilience: local content development
Japan’s diplomatic leverage
As a Japanese sogo shosha, Sumitomo leverages Japan’s diplomatic network and state-backed instruments—Japan is a top-five OECD DAC donor, disbursing roughly $17 billion in ODA (2023), alongside JBIC and NEXI finance and insurance for strategic projects.
Diplomatic channels often unlock concessional financing and risk mitigation for large infrastructure and energy deals, aligning with Tokyo’s Indo-Pacific partnerships and energy security agenda.
Close alignment with Japan’s decarbonization targets strengthens access to support, but Sumitomo must balance government-aligned projects with market neutrality in sensitive jurisdictions.
- ODA: top-five DAC donor (~$17bn, 2023)
- State backing: JBIC/NEXI provide project finance and risk cover
- Strategic focus: Indo-Pacific energy/security partnerships
- Risk: need neutrality in geopolitically sensitive markets
Geopolitics, tariffs and subsidies force supply-chain diversification and local co-investment
Geopolitical shocks (US–China tech rivalry, Russia ~40% palladium, Strait of Hormuz ~20% seaborne oil) and trade measures (US steel/aluminum duties 25%/10%, WTO MFN ~2.9% 2023) threaten Sumitomo supply chains; diversify suppliers, buffers, political risk cover. Policy incentives (IRA ~$369B, CHIPS ~$52B) create co-investment and local-content needs. Japan ODA ~ $17bn (2023) and JBIC/NEXI aid project bankability.
| Risk | Key figure |
|---|---|
| Palladium supply | Russia ~40% |
| Seaborne oil via Hormuz | ~20% |
| IRA | $369B |
| CHIPS | $52B |
| Japan ODA 2023 | $17B |
What is included in the product
 Detailed Word Document
Explores how Political, Economic, Social, Technological, Environmental, and Legal forces uniquely impact Sumitomo’s businesses across regions and sectors, with each section grounded in current data and trends. Designed for executives and advisors, it highlights threats, opportunities, and forward-looking scenarios to inform strategy, funding and risk management.

 Customizable Excel Spreadsheet
A concise, visually segmented Sumitomo PESTLE summary that teams can drop into presentations, annotate for local business lines, and share for quick alignment—helping stakeholders rapidly identify external risks and strategic opportunities.
Economic factors

Commodity price cycles
Volatility in iron ore (swinging ~30–40% YTD), copper (annualized volatility ~22% in 2024), LNG (TTF down ~60% from 2022 peaks to 2024) and petrochemical margins (±$150–250/ton) materially drives trading margins and asset returns; portfolio hedging and optionality in offtake contracts are essential to lock spreads. Counter-cyclical resource and infrastructure buys at trough valuations boost IRRs, while integrated trading‑intelligence tightens inventory and basis risk management.
Global growth and capex cycles
Infrastructure, real estate and transport revenues move with global GDP, forecast at about 3.0% in 2025 (IMF Apr 2025), and with policy rates in advanced economies averaging roughly 4–5% in 2024–25; higher rates squeeze project IRRs and debt capacity. Sumitomo can favor brownfield, shorter-payback assets and recycle capital via divestments. Multilateral and blended finance can lower WACC materially, often by 200–300 bps on strategic projects.

FX and interest rate exposure
Multi-currency cash flows across Asia, EMEA and the Americas create significant translation and transaction risks for Sumitomo; the group mitigates this through active hedging using forwards, FX swaps and natural operational offsets to protect margins.
Interest rate swaps and diversified funding across yen, dollar and euro markets help stabilize financing costs, while a centralized treasury enhances liquidity management and tightens counterparty risk control.

Supply chain costs and logistics
Freight volatility drives Sumitomo trade economics: container spot rates fell ~70% from 2021 peaks to average ~USD1,200 per 40ft in 2024, while port congestion at major US gateways declined from >20 days waiting in 2021 to ~2 days in 2024 and marine insurance premiums rose roughly 20% 2022–24.
Mitigation through long-term charters, multi-port routing and digital visibility (real-time ETAs) cuts cost swings and demurrage exposure, supporting steadier margins.
Nearshoring and inventory optimization can lower lead times by up to 30% and reduce working capital needs ~10–20%; strategic warehouses close to key customers improve reliability and on-time delivery.
- freight: ~USD1,200/40ft (2024)
- port waits: ~2 days (major US ports, 2024)
- insurance: +~20% (2022–24)
- lead-time reduction: up to 30%
- working capital saving: ~10–20%
Energy transition economics
Renewables, hydrogen, CCUS and battery value chains are scaling with falling costs: global solar/wind LCOEs down sharply and battery packs ~$120/kWh (2023 BNEF) with projections near $100/kWh by 2025; electrolyzer CAPEX has fallen ~60% since 2015 (IEA/IRENA) and global CO2 captured ~40 MtCO2/yr (2023 Global CCS Institute). Timing entries around subsidy cliffs and learning curves is critical; Sumitomo can bundle offtake, EPC and financing to de-risk adoption while cash-harvesting and decarbonizing legacy hydrocarbon assets.
- renewables scale; LCOE down
- batteries ~$120/kWh (2023)
- electrolyzers -60% since 2015
- CCUS ~40 MtCO2/yr (2023)
- bundle offtake/EPC/finance to de-risk
- cash-harvest + decarbonize legacy assets
Geopolitics, tariffs and subsidies force supply-chain diversification and local co-investment
Commodity swings (iron ore ~30–40% YTD; copper vol ~22% 2024) and energy margin variability materially drive trading and asset returns; hedging and optionality are essential. Global GDP ~3.0% (IMF Apr 2025) and policy rates ~4–5% (2024–25) compress IRRs, favoring brownfield and blended finance. Freight, FX and funding diversification (yen/USD/EUR) are key to stabilizing cash flows.
| Metric | Value | Source |
|---|---|---|
| Iron ore volatility | ~30–40% YTD | Market data 2025 |
| Global GDP 2025 | ~3.0% | IMF Apr 2025 |
| Policy rates | 4–5% (AE, 2024–25) | Central banks |
| Freight | ~USD1,200/40ft (2024) | Market rates |
| Battery cost | ~USD100/kWh (2025 proj) | BNEF 2024–25 |
Preview the Actual Deliverable
Sumitomo PESTLE Analysis
The Sumitomo PESTLE Analysis preview shown here is the exact, fully formatted document you’ll receive after purchase; it covers political, economic, social, technological, legal, and environmental factors specific to Sumitomo. This is the real, finished file—professionally structured and ready to download immediately after checkout. No placeholders, no changes, just the complete analysis as displayed.

Your Competitive Advantage Starts with This Report
Our Sumitomo PESTLE distills political, economic, social, technological, legal and environmental forces shaping the group's strategy and risks. Use these insights to anticipate regulatory shifts, supply-chain impacts and growth pockets. Buy the full analysis for the detailed, actionable intelligence ready for immediate use.
Political factors
Geopolitical tensions and supply security
Heightened U.S.–China rivalry and tightened U.S. export controls on advanced semiconductors, Russia-related sanctions (Russia supplies roughly 40% of global palladium) and Middle East risks (Strait of Hormuz carries about 20% of seaborne oil) can disrupt metals, energy and electronics lanes Sumitomo relies on. The firm must diversify suppliers, build inventory buffers in critical categories, buy political risk insurance and pursue regionalized supply strategies and local government partnerships to preserve access.
Trade policy and tariffs
Shifts in tariffs and export controls—e.g., US steel/aluminum duties (25%/10%) and Section 301 measures covering about $360bn of Chinese imports—materially change project economics across metals, semiconductors and energy equipment. Sumitomo needs agile contracts to pass costs or re-route flows and should use classification, origin planning and bonded zones to preserve margins. Ongoing monitoring of WTO rulings and new bilateral deals (WTO MFN average ~2.9% in 2023) must inform routes to market.
Industrial policy and subsidies
Global incentives for infrastructure, renewables, EVs and semiconductors (e.g., US Inflation Reduction Act ~$369B, CHIPS incentives ~$52B) create co-investment opportunities for Sumitomo across projects and supply chains. Competing national content rules force local manufacturing or JV footprints, increasing strategic capex but unlocking grants. Sumitomo can arbitrage multi-country programs to optimize capex and maximize grant capture. Policy-driven demand visibility strengthens long-term offtake and financing prospects.
Host-country stability and governance
Host-country stability and governance affect Sumitomo resource and infrastructure projects through regime change, permit delays and community opposition; World Bank Worldwide Governance Indicators use a scale roughly from -2.5 to 2.5 to benchmark such risks.
Robust stakeholder mapping and ESG engagement reduce likelihood of disruptions and improve social license to operate.
Stabilization clauses and political risk insurance enhance bankability; local content development strengthens resilience and local support.
- WGI scale: -2.5 to 2.5
- Mitigate: stakeholder mapping, ESG engagement
- De-risk: stabilization clauses, political risk cover
- Resilience: local content development
Japan’s diplomatic leverage
As a Japanese sogo shosha, Sumitomo leverages Japan’s diplomatic network and state-backed instruments—Japan is a top-five OECD DAC donor, disbursing roughly $17 billion in ODA (2023), alongside JBIC and NEXI finance and insurance for strategic projects.
Diplomatic channels often unlock concessional financing and risk mitigation for large infrastructure and energy deals, aligning with Tokyo’s Indo-Pacific partnerships and energy security agenda.
Close alignment with Japan’s decarbonization targets strengthens access to support, but Sumitomo must balance government-aligned projects with market neutrality in sensitive jurisdictions.
- ODA: top-five DAC donor (~$17bn, 2023)
- State backing: JBIC/NEXI provide project finance and risk cover
- Strategic focus: Indo-Pacific energy/security partnerships
- Risk: need neutrality in geopolitically sensitive markets
Geopolitics, tariffs and subsidies force supply-chain diversification and local co-investment
Geopolitical shocks (US–China tech rivalry, Russia ~40% palladium, Strait of Hormuz ~20% seaborne oil) and trade measures (US steel/aluminum duties 25%/10%, WTO MFN ~2.9% 2023) threaten Sumitomo supply chains; diversify suppliers, buffers, political risk cover. Policy incentives (IRA ~$369B, CHIPS ~$52B) create co-investment and local-content needs. Japan ODA ~ $17bn (2023) and JBIC/NEXI aid project bankability.
| Risk | Key figure |
|---|---|
| Palladium supply | Russia ~40% |
| Seaborne oil via Hormuz | ~20% |
| IRA | $369B |
| CHIPS | $52B |
| Japan ODA 2023 | $17B |
What is included in the product
Detailed Word Document
Explores how Political, Economic, Social, Technological, Environmental, and Legal forces uniquely impact Sumitomo’s businesses across regions and sectors, with each section grounded in current data and trends. Designed for executives and advisors, it highlights threats, opportunities, and forward-looking scenarios to inform strategy, funding and risk management.
Customizable Excel Spreadsheet
A concise, visually segmented Sumitomo PESTLE summary that teams can drop into presentations, annotate for local business lines, and share for quick alignment—helping stakeholders rapidly identify external risks and strategic opportunities.
Economic factors
Commodity price cycles
Volatility in iron ore (swinging ~30–40% YTD), copper (annualized volatility ~22% in 2024), LNG (TTF down ~60% from 2022 peaks to 2024) and petrochemical margins (±$150–250/ton) materially drives trading margins and asset returns; portfolio hedging and optionality in offtake contracts are essential to lock spreads. Counter-cyclical resource and infrastructure buys at trough valuations boost IRRs, while integrated trading‑intelligence tightens inventory and basis risk management.
Global growth and capex cycles
Infrastructure, real estate and transport revenues move with global GDP, forecast at about 3.0% in 2025 (IMF Apr 2025), and with policy rates in advanced economies averaging roughly 4–5% in 2024–25; higher rates squeeze project IRRs and debt capacity. Sumitomo can favor brownfield, shorter-payback assets and recycle capital via divestments. Multilateral and blended finance can lower WACC materially, often by 200–300 bps on strategic projects.
FX and interest rate exposure
Multi-currency cash flows across Asia, EMEA and the Americas create significant translation and transaction risks for Sumitomo; the group mitigates this through active hedging using forwards, FX swaps and natural operational offsets to protect margins.
Interest rate swaps and diversified funding across yen, dollar and euro markets help stabilize financing costs, while a centralized treasury enhances liquidity management and tightens counterparty risk control.
Supply chain costs and logistics
Freight volatility drives Sumitomo trade economics: container spot rates fell ~70% from 2021 peaks to average ~USD1,200 per 40ft in 2024, while port congestion at major US gateways declined from >20 days waiting in 2021 to ~2 days in 2024 and marine insurance premiums rose roughly 20% 2022–24.
Mitigation through long-term charters, multi-port routing and digital visibility (real-time ETAs) cuts cost swings and demurrage exposure, supporting steadier margins.
Nearshoring and inventory optimization can lower lead times by up to 30% and reduce working capital needs ~10–20%; strategic warehouses close to key customers improve reliability and on-time delivery.
- freight: ~USD1,200/40ft (2024)
- port waits: ~2 days (major US ports, 2024)
- insurance: +~20% (2022–24)
- lead-time reduction: up to 30%
- working capital saving: ~10–20%
Energy transition economics
Renewables, hydrogen, CCUS and battery value chains are scaling with falling costs: global solar/wind LCOEs down sharply and battery packs ~$120/kWh (2023 BNEF) with projections near $100/kWh by 2025; electrolyzer CAPEX has fallen ~60% since 2015 (IEA/IRENA) and global CO2 captured ~40 MtCO2/yr (2023 Global CCS Institute). Timing entries around subsidy cliffs and learning curves is critical; Sumitomo can bundle offtake, EPC and financing to de-risk adoption while cash-harvesting and decarbonizing legacy hydrocarbon assets.
- renewables scale; LCOE down
- batteries ~$120/kWh (2023)
- electrolyzers -60% since 2015
- CCUS ~40 MtCO2/yr (2023)
- bundle offtake/EPC/finance to de-risk
- cash-harvest + decarbonize legacy assets
Geopolitics, tariffs and subsidies force supply-chain diversification and local co-investment
Commodity swings (iron ore ~30–40% YTD; copper vol ~22% 2024) and energy margin variability materially drive trading and asset returns; hedging and optionality are essential. Global GDP ~3.0% (IMF Apr 2025) and policy rates ~4–5% (2024–25) compress IRRs, favoring brownfield and blended finance. Freight, FX and funding diversification (yen/USD/EUR) are key to stabilizing cash flows.
| Metric | Value | Source |
|---|---|---|
| Iron ore volatility | ~30–40% YTD | Market data 2025 |
| Global GDP 2025 | ~3.0% | IMF Apr 2025 |
| Policy rates | 4–5% (AE, 2024–25) | Central banks |
| Freight | ~USD1,200/40ft (2024) | Market rates |
| Battery cost | ~USD100/kWh (2025 proj) | BNEF 2024–25 |
Preview the Actual Deliverable
Sumitomo PESTLE Analysis
The Sumitomo PESTLE Analysis preview shown here is the exact, fully formatted document you’ll receive after purchase; it covers political, economic, social, technological, legal, and environmental factors specific to Sumitomo. This is the real, finished file—professionally structured and ready to download immediately after checkout. No placeholders, no changes, just the complete analysis as displayed.
Description
Your Competitive Advantage Starts with This Report
Our Sumitomo PESTLE distills political, economic, social, technological, legal and environmental forces shaping the group's strategy and risks. Use these insights to anticipate regulatory shifts, supply-chain impacts and growth pockets. Buy the full analysis for the detailed, actionable intelligence ready for immediate use.
Political factors
Geopolitical tensions and supply security
Heightened U.S.–China rivalry and tightened U.S. export controls on advanced semiconductors, Russia-related sanctions (Russia supplies roughly 40% of global palladium) and Middle East risks (Strait of Hormuz carries about 20% of seaborne oil) can disrupt metals, energy and electronics lanes Sumitomo relies on. The firm must diversify suppliers, build inventory buffers in critical categories, buy political risk insurance and pursue regionalized supply strategies and local government partnerships to preserve access.
Trade policy and tariffs
Shifts in tariffs and export controls—e.g., US steel/aluminum duties (25%/10%) and Section 301 measures covering about $360bn of Chinese imports—materially change project economics across metals, semiconductors and energy equipment. Sumitomo needs agile contracts to pass costs or re-route flows and should use classification, origin planning and bonded zones to preserve margins. Ongoing monitoring of WTO rulings and new bilateral deals (WTO MFN average ~2.9% in 2023) must inform routes to market.
Industrial policy and subsidies
Global incentives for infrastructure, renewables, EVs and semiconductors (e.g., US Inflation Reduction Act ~$369B, CHIPS incentives ~$52B) create co-investment opportunities for Sumitomo across projects and supply chains. Competing national content rules force local manufacturing or JV footprints, increasing strategic capex but unlocking grants. Sumitomo can arbitrage multi-country programs to optimize capex and maximize grant capture. Policy-driven demand visibility strengthens long-term offtake and financing prospects.
Host-country stability and governance
Host-country stability and governance affect Sumitomo resource and infrastructure projects through regime change, permit delays and community opposition; World Bank Worldwide Governance Indicators use a scale roughly from -2.5 to 2.5 to benchmark such risks.
Robust stakeholder mapping and ESG engagement reduce likelihood of disruptions and improve social license to operate.
Stabilization clauses and political risk insurance enhance bankability; local content development strengthens resilience and local support.
- WGI scale: -2.5 to 2.5
- Mitigate: stakeholder mapping, ESG engagement
- De-risk: stabilization clauses, political risk cover
- Resilience: local content development
Japan’s diplomatic leverage
As a Japanese sogo shosha, Sumitomo leverages Japan’s diplomatic network and state-backed instruments—Japan is a top-five OECD DAC donor, disbursing roughly $17 billion in ODA (2023), alongside JBIC and NEXI finance and insurance for strategic projects.
Diplomatic channels often unlock concessional financing and risk mitigation for large infrastructure and energy deals, aligning with Tokyo’s Indo-Pacific partnerships and energy security agenda.
Close alignment with Japan’s decarbonization targets strengthens access to support, but Sumitomo must balance government-aligned projects with market neutrality in sensitive jurisdictions.
- ODA: top-five DAC donor (~$17bn, 2023)
- State backing: JBIC/NEXI provide project finance and risk cover
- Strategic focus: Indo-Pacific energy/security partnerships
- Risk: need neutrality in geopolitically sensitive markets
Geopolitics, tariffs and subsidies force supply-chain diversification and local co-investment
Geopolitical shocks (US–China tech rivalry, Russia ~40% palladium, Strait of Hormuz ~20% seaborne oil) and trade measures (US steel/aluminum duties 25%/10%, WTO MFN ~2.9% 2023) threaten Sumitomo supply chains; diversify suppliers, buffers, political risk cover. Policy incentives (IRA ~$369B, CHIPS ~$52B) create co-investment and local-content needs. Japan ODA ~ $17bn (2023) and JBIC/NEXI aid project bankability.
| Risk | Key figure |
|---|---|
| Palladium supply | Russia ~40% |
| Seaborne oil via Hormuz | ~20% |
| IRA | $369B |
| CHIPS | $52B |
| Japan ODA 2023 | $17B |
What is included in the product
Detailed Word Document
Explores how Political, Economic, Social, Technological, Environmental, and Legal forces uniquely impact Sumitomo’s businesses across regions and sectors, with each section grounded in current data and trends. Designed for executives and advisors, it highlights threats, opportunities, and forward-looking scenarios to inform strategy, funding and risk management.
Customizable Excel Spreadsheet
A concise, visually segmented Sumitomo PESTLE summary that teams can drop into presentations, annotate for local business lines, and share for quick alignment—helping stakeholders rapidly identify external risks and strategic opportunities.
Economic factors
Commodity price cycles
Volatility in iron ore (swinging ~30–40% YTD), copper (annualized volatility ~22% in 2024), LNG (TTF down ~60% from 2022 peaks to 2024) and petrochemical margins (±$150–250/ton) materially drives trading margins and asset returns; portfolio hedging and optionality in offtake contracts are essential to lock spreads. Counter-cyclical resource and infrastructure buys at trough valuations boost IRRs, while integrated trading‑intelligence tightens inventory and basis risk management.
Global growth and capex cycles
Infrastructure, real estate and transport revenues move with global GDP, forecast at about 3.0% in 2025 (IMF Apr 2025), and with policy rates in advanced economies averaging roughly 4–5% in 2024–25; higher rates squeeze project IRRs and debt capacity. Sumitomo can favor brownfield, shorter-payback assets and recycle capital via divestments. Multilateral and blended finance can lower WACC materially, often by 200–300 bps on strategic projects.
FX and interest rate exposure
Multi-currency cash flows across Asia, EMEA and the Americas create significant translation and transaction risks for Sumitomo; the group mitigates this through active hedging using forwards, FX swaps and natural operational offsets to protect margins.
Interest rate swaps and diversified funding across yen, dollar and euro markets help stabilize financing costs, while a centralized treasury enhances liquidity management and tightens counterparty risk control.
Supply chain costs and logistics
Freight volatility drives Sumitomo trade economics: container spot rates fell ~70% from 2021 peaks to average ~USD1,200 per 40ft in 2024, while port congestion at major US gateways declined from >20 days waiting in 2021 to ~2 days in 2024 and marine insurance premiums rose roughly 20% 2022–24.
Mitigation through long-term charters, multi-port routing and digital visibility (real-time ETAs) cuts cost swings and demurrage exposure, supporting steadier margins.
Nearshoring and inventory optimization can lower lead times by up to 30% and reduce working capital needs ~10–20%; strategic warehouses close to key customers improve reliability and on-time delivery.
- freight: ~USD1,200/40ft (2024)
- port waits: ~2 days (major US ports, 2024)
- insurance: +~20% (2022–24)
- lead-time reduction: up to 30%
- working capital saving: ~10–20%
Energy transition economics
Renewables, hydrogen, CCUS and battery value chains are scaling with falling costs: global solar/wind LCOEs down sharply and battery packs ~$120/kWh (2023 BNEF) with projections near $100/kWh by 2025; electrolyzer CAPEX has fallen ~60% since 2015 (IEA/IRENA) and global CO2 captured ~40 MtCO2/yr (2023 Global CCS Institute). Timing entries around subsidy cliffs and learning curves is critical; Sumitomo can bundle offtake, EPC and financing to de-risk adoption while cash-harvesting and decarbonizing legacy hydrocarbon assets.
- renewables scale; LCOE down
- batteries ~$120/kWh (2023)
- electrolyzers -60% since 2015
- CCUS ~40 MtCO2/yr (2023)
- bundle offtake/EPC/finance to de-risk
- cash-harvest + decarbonize legacy assets
Geopolitics, tariffs and subsidies force supply-chain diversification and local co-investment
Commodity swings (iron ore ~30–40% YTD; copper vol ~22% 2024) and energy margin variability materially drive trading and asset returns; hedging and optionality are essential. Global GDP ~3.0% (IMF Apr 2025) and policy rates ~4–5% (2024–25) compress IRRs, favoring brownfield and blended finance. Freight, FX and funding diversification (yen/USD/EUR) are key to stabilizing cash flows.
| Metric | Value | Source |
|---|---|---|
| Iron ore volatility | ~30–40% YTD | Market data 2025 |
| Global GDP 2025 | ~3.0% | IMF Apr 2025 |
| Policy rates | 4–5% (AE, 2024–25) | Central banks |
| Freight | ~USD1,200/40ft (2024) | Market rates |
| Battery cost | ~USD100/kWh (2025 proj) | BNEF 2024–25 |
Preview the Actual Deliverable
Sumitomo PESTLE Analysis
The Sumitomo PESTLE Analysis preview shown here is the exact, fully formatted document you’ll receive after purchase; it covers political, economic, social, technological, legal, and environmental factors specific to Sumitomo. This is the real, finished file—professionally structured and ready to download immediately after checkout. No placeholders, no changes, just the complete analysis as displayed.











