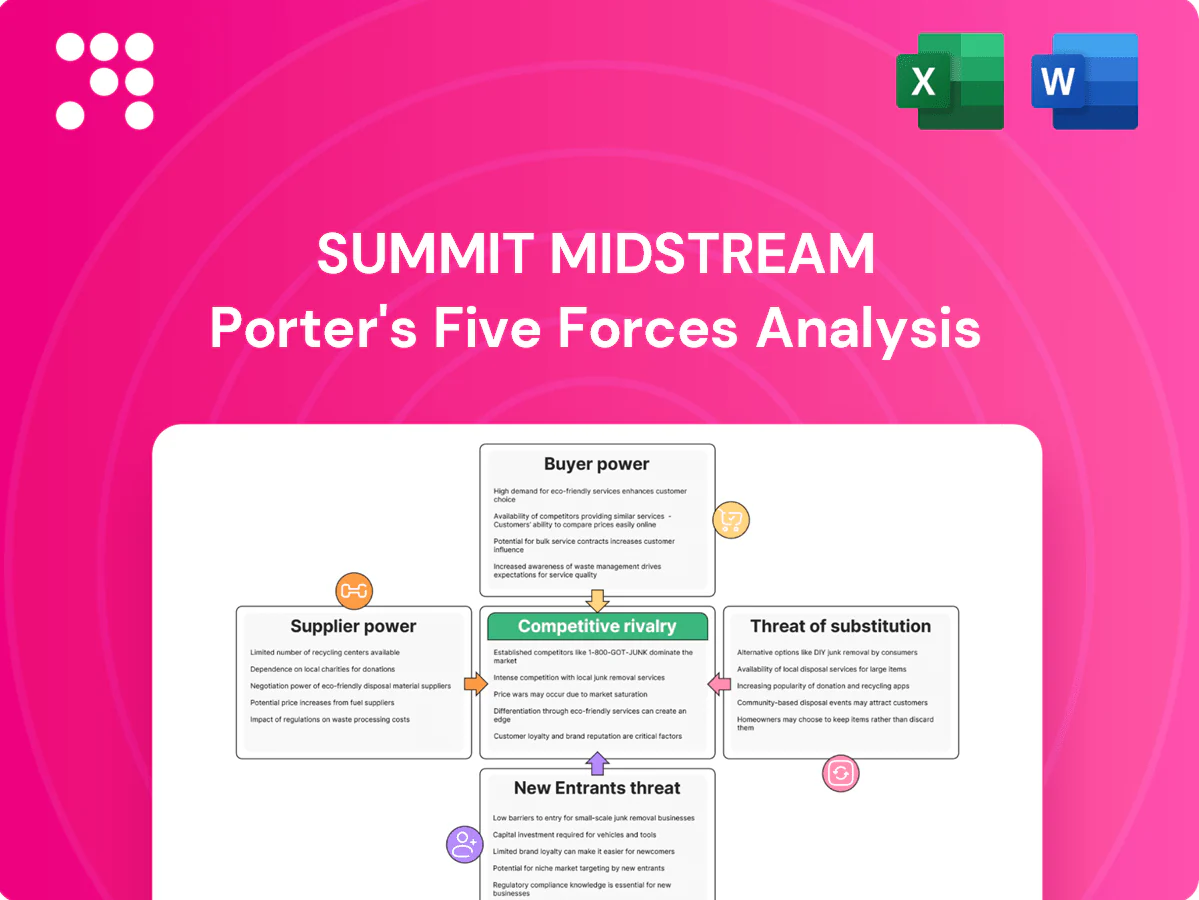
Summit Midstream Porter's Five Forces Analysis

Elevate Your Analysis with the Complete Porter's Five Forces Analysis
Summit Midstream faces concentrated buyer power, disciplined supplier relationships, moderate threat from new entrants, limited substitutes, and rivalry shaped by asset scale and contract structures. This snapshot highlights key pressures but omits force-by-force ratings and visuals. Unlock the full Porter's Five Forces Analysis to access detailed ratings, implications, and actionable strategy recommendations.
Suppliers Bargaining Power

Concentrated OEMs for critical equipment
Compressors, cryogenic plants, meters and control systems are supplied by a handful of specialized OEMs, raising switching costs and typical lead times of 12–24 months and contributing to pricing power and delivery queues during upcycles. Limited OEM competition can push project capex higher and delay in‑service dates; long‑term framework agreements mitigate risk but do not remove supplier leverage.
Right-of-way and land access constraints
Pipeline routes hinge on easements from landowners and local authorities who can extract concessions, often increasing per-mile costs by 20–40% in populated or difficult terrain. Limited reroute options boost counterparty leverage and delays of 6–12 months can raise carrying costs and shave 200–500 basis points off project IRRs. Proactive community engagement and pre-assembled corridors can cut right-of-way risks by roughly 20–30%.

Power and utilities as essential inputs
Gas processing and compression are electricity-intensive, tying Summit Midstream costs to regional power markets that averaged about 10 cents/kWh for U.S. industrial customers in 2024 (EIA), so utility rate moves directly lift operating expense. Utilities or on-site power providers can pass through rate hikes or impose interconnection timelines that delay projects and spike short-term costs. Volatile power pricing—with summer peak nodal spikes—compresses margins when customer tariffs are fixed, and hedging plus self-generation (often covering a portion of load) mitigate but do not fully neutralize this supplier power risk.

Specialized EPC contractors and skilled labor
Experienced midstream EPCs and craft labor remain scarce during build cycles, driving higher bid rates and tightening supplier leverage; using second-tier crews raises execution risk and punch-list costs. Schedule slippage disrupts customer tie-ins and reduces MVC realizations. Preferred-contractor panels and repeatable designs restore bargaining power by shortening procurement and lowering change-order risk.
- Supplier leverage from scarce skilled EPCs and craft labor
- Higher bids and execution risk with second-tier crews
- Schedule slippage cuts customer connections and MVCs
- Preferred panels and repeatable designs improve terms
Capital providers and covenant terms
MLP funding via banks, bond markets and private capital tightened in 2024 as BBB corporate spreads hovered near 200 basis points, and risk-off windows pushed lenders to demand higher spreads and tighter covenants; a 200 bp spread widen can lift WACC roughly 0.5–0.8 percentage points, squeezing project hurdle rates. Market freezes amplify supplier power when issuance stalls, but prudent leverage and diversified liquidity reduce dependence.
- Funding mix: banks, bonds, private capital
- 2024 BBB spread ~200 bps
- 200 bp -> WACC +0.5–0.8 ppt
- Cyclical access increases supplier power
- Prudent leverage and liquidity diversify risk
Supply-chain & labor squeeze raises capex; ROW adds +20-40% per-mile
Specialized OEMs (12–24 month lead times) and scarce EPC/craft labor concentrate supplier leverage, raising capex and schedule risk. Right-of-way premiums in populated terrain add ~20–40% per-mile cost and 6–12 month delays. Regional industrial power averaged ~10 cents/kWh in 2024 (EIA), lifting Opex. 2024 BBB spreads ~200 bps; a 200 bp widen can raise WACC ~0.5–0.8 ppt.
| Factor | 2024 Metric |
|---|---|
| OEM lead time | 12–24 months |
| Right-of-way premium | +20–40% per-mile |
| Industrial power | ~$0.10/kWh (EIA) |
| BBB spread | ~200 bps |
| WACC impact | +0.5–0.8 ppt per 200 bp |
What is included in the product
 Detailed Word Document
Tailored Porter's Five Forces analysis for Summit Midstream uncovering competitive intensity, supplier and buyer power, substitution risks, and entry barriers—with strategic insights on disruptive threats and implications for pricing and profitability.

 Customizable Excel Spreadsheet
Concise, one-sheet Porter's Five Forces for Summit Midstream—visualize competitive pressure with a radar chart, customize inputs for scenarios, duplicate tabs for pre/post changes, and plug into decks or dashboards without macros for quick, non-technical decision-making.
Customers Bargaining Power

Large E&Ps with scale and options
Anchor shippers, often large E&Ps producing part of the US shale crude output that averaged about 13.3 million b/d in 2024, can negotiate tariffs and credits and steer volumes to competing systems, boosting their leverage. Concessions include lower rates, connection capital, or flexible take-or-pay terms; discounts of material value are common. Securing acreage dedications and multi-year commitments helps Summit offset this buyer power.
High volume concentration risk
Throughput for Summit Midstream can hinge on a handful of pads or operators in each basin, amplifying exposure when those operators cut activity; U.S. crude production averaged about 13.2 million bpd in 2024 (EIA), underscoring basin concentration effects. Concentration elevates renegotiation risk if production plans change, and counterparty distress can force tariff resets or contract restructurings. Diversifying the customer mix reduces this exposure.

Physical switching costs vs nearby alternatives
Once wells are tied in, physical switching costs are high, locking volumes to the midstream operator and preserving margin capture; buyers therefore press for lower tariff and connection fees.
Where parallel systems exist, operators can reroute new pads, restoring buyer leverage—EIA reported US crude production around 13.0 million b/d in 2024, keeping takeaway options competitive.
Buyers use the rerouting threat to extract better future-connection terms; industry responses prioritize reliability and sub-90-day speed-to-connect targets to defend share.

Contract structures moderate leverage
Contract structures at Summit Midstream—minimum volume commitments, acreage dedications and multi-year terms—reduce buyer leverage by securing cashflow and utilization, while off-take flexibility, volume holidays and price reopeners create dilution; in 2024 long-term midstream contracts commonly ranged 5–15 years, and producers sought relief in weaker commodity stretches.
- MVCs: stabilize throughput and revenue
- Acreage dedications: lock feedstock, limit buyer exit
- Flex provisions: enable producer relief during weak cycles
Quality of service and interconnect access
Access to premium residue markets, diversified NGL outlets and reliable water disposal raise buyer value and, when paired with superior netbacks, reduce customer bargaining power; service lapses or capacity constraints reverse this leverage quickly. Strategic interconnects and built-in redundancy increase system stickiness and long-term offtake commitments. Maintaining consistent service performance is therefore critical to retaining pricing power.
- Access to premium markets improves netbacks
- Service lapses quickly restore buyer leverage
- Interconnects and redundancy increase customer stickiness
Anchor shippers and basin concentration heighten buyer leverage; US crude 13.3 m b/d
Anchor shippers (large E&Ps) and basin concentration give buyers high leverage—US crude ~13.3 million b/d in 2024—forcing discounts, credits and flexible terms; long-term contracts (5–15 years) and acreage dedications counter this. High switching costs lock volumes post-tie-in, preserving margins, but parallel systems and fast re-routing restore leverage. Service reliability, market access and interconnects determine netback-driven buyer power.
| Metric | 2024 | Effect on Buyer Power |
|---|---|---|
| US crude prod | 13.3 m b/d | Increases routing options |
| Contract length | 5–15 yrs | Reduces buyer leverage |
| Switching cost | High post-tie-in | Preserves midstream margin |
Preview the Actual Deliverable
Summit Midstream Porter's Five Forces Analysis
This preview shows the exact Summit Midstream Porter's Five Forces Analysis you'll receive after purchase—fully written, formatted and ready to download. No placeholders, samples, or mockups; the file displayed is the final deliverable. Upon payment you'll get instant access to this identical document for immediate use.

Elevate Your Analysis with the Complete Porter's Five Forces Analysis
Summit Midstream faces concentrated buyer power, disciplined supplier relationships, moderate threat from new entrants, limited substitutes, and rivalry shaped by asset scale and contract structures. This snapshot highlights key pressures but omits force-by-force ratings and visuals. Unlock the full Porter's Five Forces Analysis to access detailed ratings, implications, and actionable strategy recommendations.
Suppliers Bargaining Power
Concentrated OEMs for critical equipment
Compressors, cryogenic plants, meters and control systems are supplied by a handful of specialized OEMs, raising switching costs and typical lead times of 12–24 months and contributing to pricing power and delivery queues during upcycles. Limited OEM competition can push project capex higher and delay in‑service dates; long‑term framework agreements mitigate risk but do not remove supplier leverage.
Right-of-way and land access constraints
Pipeline routes hinge on easements from landowners and local authorities who can extract concessions, often increasing per-mile costs by 20–40% in populated or difficult terrain. Limited reroute options boost counterparty leverage and delays of 6–12 months can raise carrying costs and shave 200–500 basis points off project IRRs. Proactive community engagement and pre-assembled corridors can cut right-of-way risks by roughly 20–30%.
Power and utilities as essential inputs
Gas processing and compression are electricity-intensive, tying Summit Midstream costs to regional power markets that averaged about 10 cents/kWh for U.S. industrial customers in 2024 (EIA), so utility rate moves directly lift operating expense. Utilities or on-site power providers can pass through rate hikes or impose interconnection timelines that delay projects and spike short-term costs. Volatile power pricing—with summer peak nodal spikes—compresses margins when customer tariffs are fixed, and hedging plus self-generation (often covering a portion of load) mitigate but do not fully neutralize this supplier power risk.
Specialized EPC contractors and skilled labor
Experienced midstream EPCs and craft labor remain scarce during build cycles, driving higher bid rates and tightening supplier leverage; using second-tier crews raises execution risk and punch-list costs. Schedule slippage disrupts customer tie-ins and reduces MVC realizations. Preferred-contractor panels and repeatable designs restore bargaining power by shortening procurement and lowering change-order risk.
- Supplier leverage from scarce skilled EPCs and craft labor
- Higher bids and execution risk with second-tier crews
- Schedule slippage cuts customer connections and MVCs
- Preferred panels and repeatable designs improve terms
Capital providers and covenant terms
MLP funding via banks, bond markets and private capital tightened in 2024 as BBB corporate spreads hovered near 200 basis points, and risk-off windows pushed lenders to demand higher spreads and tighter covenants; a 200 bp spread widen can lift WACC roughly 0.5–0.8 percentage points, squeezing project hurdle rates. Market freezes amplify supplier power when issuance stalls, but prudent leverage and diversified liquidity reduce dependence.
- Funding mix: banks, bonds, private capital
- 2024 BBB spread ~200 bps
- 200 bp -> WACC +0.5–0.8 ppt
- Cyclical access increases supplier power
- Prudent leverage and liquidity diversify risk
Supply-chain & labor squeeze raises capex; ROW adds +20-40% per-mile
Specialized OEMs (12–24 month lead times) and scarce EPC/craft labor concentrate supplier leverage, raising capex and schedule risk. Right-of-way premiums in populated terrain add ~20–40% per-mile cost and 6–12 month delays. Regional industrial power averaged ~10 cents/kWh in 2024 (EIA), lifting Opex. 2024 BBB spreads ~200 bps; a 200 bp widen can raise WACC ~0.5–0.8 ppt.
| Factor | 2024 Metric |
|---|---|
| OEM lead time | 12–24 months |
| Right-of-way premium | +20–40% per-mile |
| Industrial power | ~$0.10/kWh (EIA) |
| BBB spread | ~200 bps |
| WACC impact | +0.5–0.8 ppt per 200 bp |
What is included in the product
Detailed Word Document
Tailored Porter's Five Forces analysis for Summit Midstream uncovering competitive intensity, supplier and buyer power, substitution risks, and entry barriers—with strategic insights on disruptive threats and implications for pricing and profitability.
Customizable Excel Spreadsheet
Concise, one-sheet Porter's Five Forces for Summit Midstream—visualize competitive pressure with a radar chart, customize inputs for scenarios, duplicate tabs for pre/post changes, and plug into decks or dashboards without macros for quick, non-technical decision-making.
Customers Bargaining Power
Large E&Ps with scale and options
Anchor shippers, often large E&Ps producing part of the US shale crude output that averaged about 13.3 million b/d in 2024, can negotiate tariffs and credits and steer volumes to competing systems, boosting their leverage. Concessions include lower rates, connection capital, or flexible take-or-pay terms; discounts of material value are common. Securing acreage dedications and multi-year commitments helps Summit offset this buyer power.
High volume concentration risk
Throughput for Summit Midstream can hinge on a handful of pads or operators in each basin, amplifying exposure when those operators cut activity; U.S. crude production averaged about 13.2 million bpd in 2024 (EIA), underscoring basin concentration effects. Concentration elevates renegotiation risk if production plans change, and counterparty distress can force tariff resets or contract restructurings. Diversifying the customer mix reduces this exposure.
Physical switching costs vs nearby alternatives
Once wells are tied in, physical switching costs are high, locking volumes to the midstream operator and preserving margin capture; buyers therefore press for lower tariff and connection fees.
Where parallel systems exist, operators can reroute new pads, restoring buyer leverage—EIA reported US crude production around 13.0 million b/d in 2024, keeping takeaway options competitive.
Buyers use the rerouting threat to extract better future-connection terms; industry responses prioritize reliability and sub-90-day speed-to-connect targets to defend share.
Contract structures moderate leverage
Contract structures at Summit Midstream—minimum volume commitments, acreage dedications and multi-year terms—reduce buyer leverage by securing cashflow and utilization, while off-take flexibility, volume holidays and price reopeners create dilution; in 2024 long-term midstream contracts commonly ranged 5–15 years, and producers sought relief in weaker commodity stretches.
- MVCs: stabilize throughput and revenue
- Acreage dedications: lock feedstock, limit buyer exit
- Flex provisions: enable producer relief during weak cycles
Quality of service and interconnect access
Access to premium residue markets, diversified NGL outlets and reliable water disposal raise buyer value and, when paired with superior netbacks, reduce customer bargaining power; service lapses or capacity constraints reverse this leverage quickly. Strategic interconnects and built-in redundancy increase system stickiness and long-term offtake commitments. Maintaining consistent service performance is therefore critical to retaining pricing power.
- Access to premium markets improves netbacks
- Service lapses quickly restore buyer leverage
- Interconnects and redundancy increase customer stickiness
Anchor shippers and basin concentration heighten buyer leverage; US crude 13.3 m b/d
Anchor shippers (large E&Ps) and basin concentration give buyers high leverage—US crude ~13.3 million b/d in 2024—forcing discounts, credits and flexible terms; long-term contracts (5–15 years) and acreage dedications counter this. High switching costs lock volumes post-tie-in, preserving margins, but parallel systems and fast re-routing restore leverage. Service reliability, market access and interconnects determine netback-driven buyer power.
| Metric | 2024 | Effect on Buyer Power |
|---|---|---|
| US crude prod | 13.3 m b/d | Increases routing options |
| Contract length | 5–15 yrs | Reduces buyer leverage |
| Switching cost | High post-tie-in | Preserves midstream margin |
Preview the Actual Deliverable
Summit Midstream Porter's Five Forces Analysis
This preview shows the exact Summit Midstream Porter's Five Forces Analysis you'll receive after purchase—fully written, formatted and ready to download. No placeholders, samples, or mockups; the file displayed is the final deliverable. Upon payment you'll get instant access to this identical document for immediate use.
Original: $10.00
-65%$10.00
$3.50Description
Elevate Your Analysis with the Complete Porter's Five Forces Analysis
Summit Midstream faces concentrated buyer power, disciplined supplier relationships, moderate threat from new entrants, limited substitutes, and rivalry shaped by asset scale and contract structures. This snapshot highlights key pressures but omits force-by-force ratings and visuals. Unlock the full Porter's Five Forces Analysis to access detailed ratings, implications, and actionable strategy recommendations.
Suppliers Bargaining Power
Concentrated OEMs for critical equipment
Compressors, cryogenic plants, meters and control systems are supplied by a handful of specialized OEMs, raising switching costs and typical lead times of 12–24 months and contributing to pricing power and delivery queues during upcycles. Limited OEM competition can push project capex higher and delay in‑service dates; long‑term framework agreements mitigate risk but do not remove supplier leverage.
Right-of-way and land access constraints
Pipeline routes hinge on easements from landowners and local authorities who can extract concessions, often increasing per-mile costs by 20–40% in populated or difficult terrain. Limited reroute options boost counterparty leverage and delays of 6–12 months can raise carrying costs and shave 200–500 basis points off project IRRs. Proactive community engagement and pre-assembled corridors can cut right-of-way risks by roughly 20–30%.
Power and utilities as essential inputs
Gas processing and compression are electricity-intensive, tying Summit Midstream costs to regional power markets that averaged about 10 cents/kWh for U.S. industrial customers in 2024 (EIA), so utility rate moves directly lift operating expense. Utilities or on-site power providers can pass through rate hikes or impose interconnection timelines that delay projects and spike short-term costs. Volatile power pricing—with summer peak nodal spikes—compresses margins when customer tariffs are fixed, and hedging plus self-generation (often covering a portion of load) mitigate but do not fully neutralize this supplier power risk.
Specialized EPC contractors and skilled labor
Experienced midstream EPCs and craft labor remain scarce during build cycles, driving higher bid rates and tightening supplier leverage; using second-tier crews raises execution risk and punch-list costs. Schedule slippage disrupts customer tie-ins and reduces MVC realizations. Preferred-contractor panels and repeatable designs restore bargaining power by shortening procurement and lowering change-order risk.
- Supplier leverage from scarce skilled EPCs and craft labor
- Higher bids and execution risk with second-tier crews
- Schedule slippage cuts customer connections and MVCs
- Preferred panels and repeatable designs improve terms
Capital providers and covenant terms
MLP funding via banks, bond markets and private capital tightened in 2024 as BBB corporate spreads hovered near 200 basis points, and risk-off windows pushed lenders to demand higher spreads and tighter covenants; a 200 bp spread widen can lift WACC roughly 0.5–0.8 percentage points, squeezing project hurdle rates. Market freezes amplify supplier power when issuance stalls, but prudent leverage and diversified liquidity reduce dependence.
- Funding mix: banks, bonds, private capital
- 2024 BBB spread ~200 bps
- 200 bp -> WACC +0.5–0.8 ppt
- Cyclical access increases supplier power
- Prudent leverage and liquidity diversify risk
Supply-chain & labor squeeze raises capex; ROW adds +20-40% per-mile
Specialized OEMs (12–24 month lead times) and scarce EPC/craft labor concentrate supplier leverage, raising capex and schedule risk. Right-of-way premiums in populated terrain add ~20–40% per-mile cost and 6–12 month delays. Regional industrial power averaged ~10 cents/kWh in 2024 (EIA), lifting Opex. 2024 BBB spreads ~200 bps; a 200 bp widen can raise WACC ~0.5–0.8 ppt.
| Factor | 2024 Metric |
|---|---|
| OEM lead time | 12–24 months |
| Right-of-way premium | +20–40% per-mile |
| Industrial power | ~$0.10/kWh (EIA) |
| BBB spread | ~200 bps |
| WACC impact | +0.5–0.8 ppt per 200 bp |
What is included in the product
Detailed Word Document
Tailored Porter's Five Forces analysis for Summit Midstream uncovering competitive intensity, supplier and buyer power, substitution risks, and entry barriers—with strategic insights on disruptive threats and implications for pricing and profitability.
Customizable Excel Spreadsheet
Concise, one-sheet Porter's Five Forces for Summit Midstream—visualize competitive pressure with a radar chart, customize inputs for scenarios, duplicate tabs for pre/post changes, and plug into decks or dashboards without macros for quick, non-technical decision-making.
Customers Bargaining Power
Large E&Ps with scale and options
Anchor shippers, often large E&Ps producing part of the US shale crude output that averaged about 13.3 million b/d in 2024, can negotiate tariffs and credits and steer volumes to competing systems, boosting their leverage. Concessions include lower rates, connection capital, or flexible take-or-pay terms; discounts of material value are common. Securing acreage dedications and multi-year commitments helps Summit offset this buyer power.
High volume concentration risk
Throughput for Summit Midstream can hinge on a handful of pads or operators in each basin, amplifying exposure when those operators cut activity; U.S. crude production averaged about 13.2 million bpd in 2024 (EIA), underscoring basin concentration effects. Concentration elevates renegotiation risk if production plans change, and counterparty distress can force tariff resets or contract restructurings. Diversifying the customer mix reduces this exposure.
Physical switching costs vs nearby alternatives
Once wells are tied in, physical switching costs are high, locking volumes to the midstream operator and preserving margin capture; buyers therefore press for lower tariff and connection fees.
Where parallel systems exist, operators can reroute new pads, restoring buyer leverage—EIA reported US crude production around 13.0 million b/d in 2024, keeping takeaway options competitive.
Buyers use the rerouting threat to extract better future-connection terms; industry responses prioritize reliability and sub-90-day speed-to-connect targets to defend share.
Contract structures moderate leverage
Contract structures at Summit Midstream—minimum volume commitments, acreage dedications and multi-year terms—reduce buyer leverage by securing cashflow and utilization, while off-take flexibility, volume holidays and price reopeners create dilution; in 2024 long-term midstream contracts commonly ranged 5–15 years, and producers sought relief in weaker commodity stretches.
- MVCs: stabilize throughput and revenue
- Acreage dedications: lock feedstock, limit buyer exit
- Flex provisions: enable producer relief during weak cycles
Quality of service and interconnect access
Access to premium residue markets, diversified NGL outlets and reliable water disposal raise buyer value and, when paired with superior netbacks, reduce customer bargaining power; service lapses or capacity constraints reverse this leverage quickly. Strategic interconnects and built-in redundancy increase system stickiness and long-term offtake commitments. Maintaining consistent service performance is therefore critical to retaining pricing power.
- Access to premium markets improves netbacks
- Service lapses quickly restore buyer leverage
- Interconnects and redundancy increase customer stickiness
Anchor shippers and basin concentration heighten buyer leverage; US crude 13.3 m b/d
Anchor shippers (large E&Ps) and basin concentration give buyers high leverage—US crude ~13.3 million b/d in 2024—forcing discounts, credits and flexible terms; long-term contracts (5–15 years) and acreage dedications counter this. High switching costs lock volumes post-tie-in, preserving margins, but parallel systems and fast re-routing restore leverage. Service reliability, market access and interconnects determine netback-driven buyer power.
| Metric | 2024 | Effect on Buyer Power |
|---|---|---|
| US crude prod | 13.3 m b/d | Increases routing options |
| Contract length | 5–15 yrs | Reduces buyer leverage |
| Switching cost | High post-tie-in | Preserves midstream margin |
Preview the Actual Deliverable
Summit Midstream Porter's Five Forces Analysis
This preview shows the exact Summit Midstream Porter's Five Forces Analysis you'll receive after purchase—fully written, formatted and ready to download. No placeholders, samples, or mockups; the file displayed is the final deliverable. Upon payment you'll get instant access to this identical document for immediate use.











