Sunlight Financial Porter's Five Forces Analysis

From Overview to Strategy Blueprint
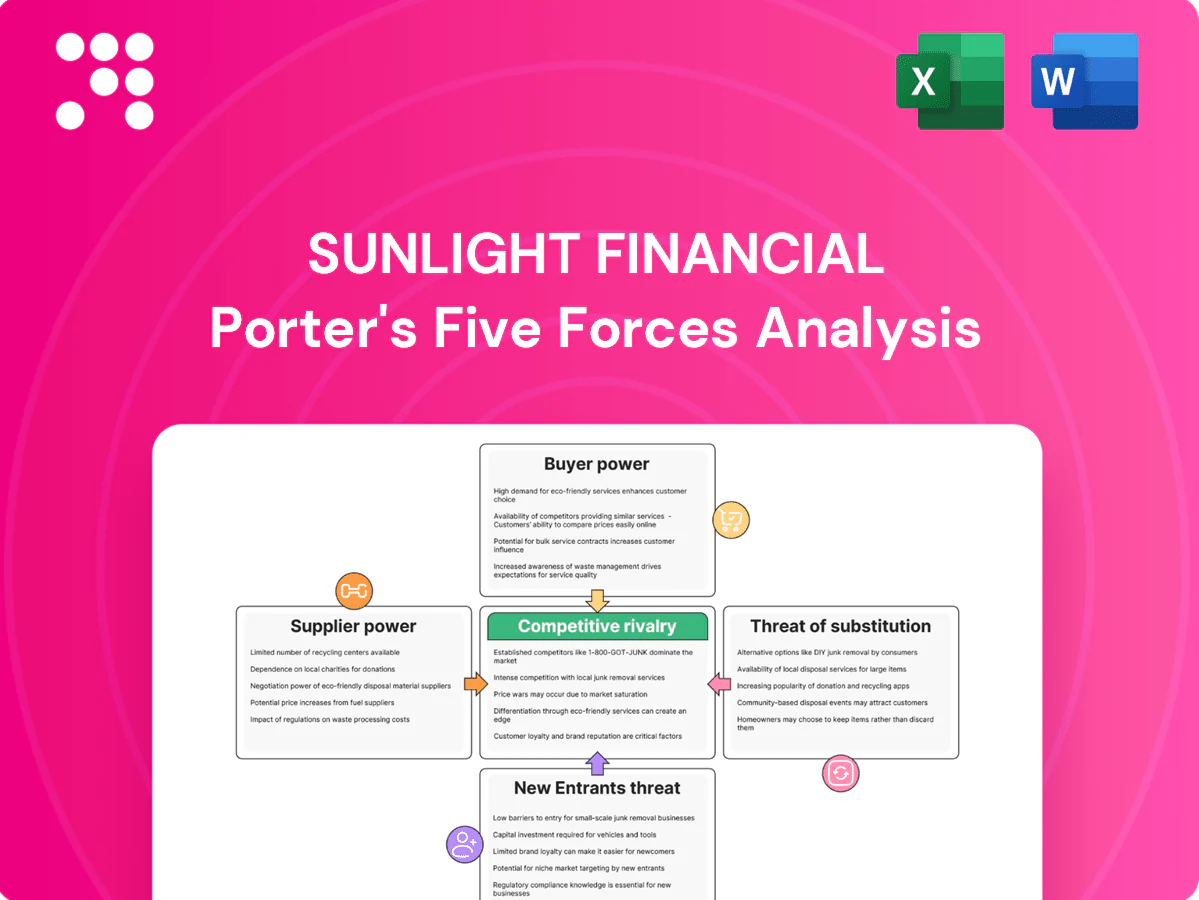
Sunlight Financial's Porter’s Five Forces snapshot highlights strong buyer power, moderate supplier leverage, significant competitive rivalry, a rising threat from fintech substitutes, and manageable entry barriers for niche players. This brief preview outlines strategic pressures and opportunities. Unlock the full Porter's Five Forces Analysis to explore Sunlight Financial’s competitive dynamics, market pressures, and strategic advantages in detail.
Suppliers Bargaining Power

Concentration of capital providers
Sunlight depends on a relatively concentrated set of warehouse lenders, banks and ABS investors to fund loans, and in 2024 that concentration gives providers leverage to demand higher advance rates, tighter covenants or wider spreads. Those demands raise Sunlight’s cost of funds and compress net interest margins. Diversifying funding lines reduces this supplier power but requires additional scale and time to execute.
Installer channel as supply of origination
Contractors supply origination at point of sale, steering homeowners to preferred financiers and giving large installer networks leverage to demand higher dealer fees, faster funding, and tailored products; in 2024 the top 10 U.S. installers controlled roughly 40% of residential deployments, amplifying their bargaining power. Losing a major installer can cut originations materially, and exclusive partnerships concentrate dependence and supplier power.

Dependence on data and tech vendors
Sunlight relies on three major credit bureaus (Equifax, Experian, TransUnion) plus ID verification, e-sign (DocuSign FY2024 revenue ~$2.7B) and cloud services (AWS ~32%, Azure ~23%, GCP ~11% in 2024) for underwriting/onboarding, giving those vendors leverage through high switching costs and complex integrations. Outages or price hikes can throttle approval flow and worsen unit economics, while multi-vendor strategies reduce single-vendor risk but raise integration and OPEX overhead.

Regulatory and compliance service providers
Regulatory and compliance service providers in 2024 materially affect Sunlight Financials speed-to-market across states: their scarce multi-state licensing and servicing expertise is hard to substitute quickly, creating implicit supplier power that can raise customer-acquisition costs if prices or capacity tighten.
- Licensing dependence raises time-to-launch risk
- Price/capacity shifts increase CAC
- Insourcing cuts supplier power but raises fixed costs
Servicers and payment rails
Servicers and ACH/card processors shape borrower experience and delinquency outcomes; industry concentration (top servicers control roughly 60% of consumer loan servicing) boosts their pricing power and handoff errors can materially reduce NPS and raise losses. Contractual SLAs and multi-rail redundancy are standard mitigants in 2024.
- Servicer concentration ~60%
- ACH/card errors increase delinquency and lower NPS
- SLAs and redundancy mitigate operational risk
Concentrated lenders, installer dominance, and vendor concentration raise funding & operational risk
Concentrated warehouse lenders increase Sunlight’s funding costs and covenant pressure. Top-10 installers drive ~40% of residential deployments, giving dealers fee and funding leverage. Dependence on Equifax/Experian/TransUnion, DocuSign (FY2024 rev ~$2.7B) and cloud vendors (AWS ~32%, Azure ~23%, GCP ~11% in 2024) raises switching costs. Servicer concentration (~60%) amplifies pricing and operational risk.
| Supplier | 2024 Metric | Impact |
|---|---|---|
| Installers | Top-10 ≈40% deployments | High origination leverage |
| Cloud/ID/ESign | DocuSign rev ~$2.7B; AWS 32% | High switching cost |
| Servicers | Concentration ~60% | Pricing/operational risk |
What is included in the product
 Detailed Word Document
Uncovers key drivers of competition, customer influence, and market entry risks tailored to Sunlight Financial, detailing supplier and buyer power, substitute threats and intensity of rivalry; highlights disruptive entrants and regulatory factors affecting pricing, profitability and strategic positioning.

 Customizable Excel Spreadsheet
A single-sheet Porter’s Five Forces summary tailored for Sunlight Financial—quickly spot competitive pressures and opportunities; editable inputs and radar-chart visuals let you test scenarios, paste into decks, and relieve analysis bottlenecks for faster strategic decisions.
Customers Bargaining Power

Dual-sided customers: contractors and homeowners
Dual-sided customers create layered buyer power: contractors select financing partners based on approval rates and dealer fees, and many markets saw platform churn near 20% in 2024 if economics worsened. Homeowners remain rate-sensitive, comparing APRs that in 2024 ranged from 0% promos to roughly 8–14% typical offers. Both sides can walk, squeezing margins and forcing higher service levels.
Price transparency and rate sensitivity
Online calculators and competitor quotes make APRs and dealer fees highly visible, with rate spreads of roughly 0.5–1.5 percentage points often driving choice for large home-improvement loans. Small rate differences sway decisions on projects costing tens of thousands, enabling buyers to negotiate discounts or demand buydowns of 0.25–1.0 point. Sunlight must balance being competitively priced against preserving risk-adjusted returns and portfolio credit metrics.

Low switching costs at point of sale
Low switching costs at point of sale let installers toggle between multiple financing portals during a 2024 sales visit, with minimal integration friction reducing platform lock-in. This empowers installers to chase higher approval rates or better payouts in real time. Deep partner relationships and embedded workflows—CRM links, single-sign-on, commission automation—are the primary levers to raise switching costs.

Demand cyclicality and incentives
Buyer leverage rises when demand softens from higher rates or seasonality, prompting installers to press Sunlight for promotions and faster funding to close sales. Homeowners increasingly expect instant approvals and soft-pull prequalifications, shortening sale cycles. To protect volume, Sunlight may concede margins or tighten credit criteria to balance originations and loss rates.
- Installer pressure: promos & faster funding
- Consumer expectation: instant decisions, soft-pull prequals
- Sunlight response: concede economics to sustain volumes
Credit tier mix and approval expectations
Installers expect high approval rates across FICO bands—2024 industry surveys show roughly 85% demand for broad approvals to avoid lost sales; when approvals tighten, about 20% of volume shifts to alternative financers or cash, forcing Sunlight to tighten pricing and risk segmentation.
- Approval-demand: 85% (2024)
- Shift-to-alternatives: ~20% (2024)
- Response: tighter pricing, risk tiers, SLAs, pre-quals
Dual-sided bargaining fuels ~20% churn as installers demand ~85% approvals
Customers exert strong leverage: dual-sided bargaining from installers and homeowners drove ~20% platform churn in 2024, with APRs spanning 0% promos to ~8–14% and rate spreads of 0.5–1.5 ppt influencing choice. Installers demand ~85% approval breadth; ~20% of volume shifts when approvals tighten, forcing Sunlight to trade margin for volume or tighten credit.
| Metric | 2024 Value |
|---|---|
| Platform churn | ~20% |
| APR range | 0%–8–14% |
| Rate spread driving choice | 0.5–1.5 ppt |
| Installer approval demand | 85% |
| Shift to alternatives | ~20% |
Preview Before You Purchase
Sunlight Financial Porter's Five Forces Analysis
This preview shows the exact Porter’s Five Forces analysis of Sunlight Financial you'll receive—no surprises, no placeholders. The file covers competitive rivalry, supplier and buyer power, and threats of entry and substitutes, with clear strategic implications. Once purchased, you get this same professionally formatted document instantly.

From Overview to Strategy Blueprint
Sunlight Financial's Porter’s Five Forces snapshot highlights strong buyer power, moderate supplier leverage, significant competitive rivalry, a rising threat from fintech substitutes, and manageable entry barriers for niche players. This brief preview outlines strategic pressures and opportunities. Unlock the full Porter's Five Forces Analysis to explore Sunlight Financial’s competitive dynamics, market pressures, and strategic advantages in detail.
Suppliers Bargaining Power
Concentration of capital providers
Sunlight depends on a relatively concentrated set of warehouse lenders, banks and ABS investors to fund loans, and in 2024 that concentration gives providers leverage to demand higher advance rates, tighter covenants or wider spreads. Those demands raise Sunlight’s cost of funds and compress net interest margins. Diversifying funding lines reduces this supplier power but requires additional scale and time to execute.
Installer channel as supply of origination
Contractors supply origination at point of sale, steering homeowners to preferred financiers and giving large installer networks leverage to demand higher dealer fees, faster funding, and tailored products; in 2024 the top 10 U.S. installers controlled roughly 40% of residential deployments, amplifying their bargaining power. Losing a major installer can cut originations materially, and exclusive partnerships concentrate dependence and supplier power.
Dependence on data and tech vendors
Sunlight relies on three major credit bureaus (Equifax, Experian, TransUnion) plus ID verification, e-sign (DocuSign FY2024 revenue ~$2.7B) and cloud services (AWS ~32%, Azure ~23%, GCP ~11% in 2024) for underwriting/onboarding, giving those vendors leverage through high switching costs and complex integrations. Outages or price hikes can throttle approval flow and worsen unit economics, while multi-vendor strategies reduce single-vendor risk but raise integration and OPEX overhead.
Regulatory and compliance service providers
Regulatory and compliance service providers in 2024 materially affect Sunlight Financials speed-to-market across states: their scarce multi-state licensing and servicing expertise is hard to substitute quickly, creating implicit supplier power that can raise customer-acquisition costs if prices or capacity tighten.
- Licensing dependence raises time-to-launch risk
- Price/capacity shifts increase CAC
- Insourcing cuts supplier power but raises fixed costs
Servicers and payment rails
Servicers and ACH/card processors shape borrower experience and delinquency outcomes; industry concentration (top servicers control roughly 60% of consumer loan servicing) boosts their pricing power and handoff errors can materially reduce NPS and raise losses. Contractual SLAs and multi-rail redundancy are standard mitigants in 2024.
- Servicer concentration ~60%
- ACH/card errors increase delinquency and lower NPS
- SLAs and redundancy mitigate operational risk
Concentrated lenders, installer dominance, and vendor concentration raise funding & operational risk
Concentrated warehouse lenders increase Sunlight’s funding costs and covenant pressure. Top-10 installers drive ~40% of residential deployments, giving dealers fee and funding leverage. Dependence on Equifax/Experian/TransUnion, DocuSign (FY2024 rev ~$2.7B) and cloud vendors (AWS ~32%, Azure ~23%, GCP ~11% in 2024) raises switching costs. Servicer concentration (~60%) amplifies pricing and operational risk.
| Supplier | 2024 Metric | Impact |
|---|---|---|
| Installers | Top-10 ≈40% deployments | High origination leverage |
| Cloud/ID/ESign | DocuSign rev ~$2.7B; AWS 32% | High switching cost |
| Servicers | Concentration ~60% | Pricing/operational risk |
What is included in the product
Detailed Word Document
Uncovers key drivers of competition, customer influence, and market entry risks tailored to Sunlight Financial, detailing supplier and buyer power, substitute threats and intensity of rivalry; highlights disruptive entrants and regulatory factors affecting pricing, profitability and strategic positioning.
Customizable Excel Spreadsheet
A single-sheet Porter’s Five Forces summary tailored for Sunlight Financial—quickly spot competitive pressures and opportunities; editable inputs and radar-chart visuals let you test scenarios, paste into decks, and relieve analysis bottlenecks for faster strategic decisions.
Customers Bargaining Power
Dual-sided customers: contractors and homeowners
Dual-sided customers create layered buyer power: contractors select financing partners based on approval rates and dealer fees, and many markets saw platform churn near 20% in 2024 if economics worsened. Homeowners remain rate-sensitive, comparing APRs that in 2024 ranged from 0% promos to roughly 8–14% typical offers. Both sides can walk, squeezing margins and forcing higher service levels.
Price transparency and rate sensitivity
Online calculators and competitor quotes make APRs and dealer fees highly visible, with rate spreads of roughly 0.5–1.5 percentage points often driving choice for large home-improvement loans. Small rate differences sway decisions on projects costing tens of thousands, enabling buyers to negotiate discounts or demand buydowns of 0.25–1.0 point. Sunlight must balance being competitively priced against preserving risk-adjusted returns and portfolio credit metrics.
Low switching costs at point of sale
Low switching costs at point of sale let installers toggle between multiple financing portals during a 2024 sales visit, with minimal integration friction reducing platform lock-in. This empowers installers to chase higher approval rates or better payouts in real time. Deep partner relationships and embedded workflows—CRM links, single-sign-on, commission automation—are the primary levers to raise switching costs.
Demand cyclicality and incentives
Buyer leverage rises when demand softens from higher rates or seasonality, prompting installers to press Sunlight for promotions and faster funding to close sales. Homeowners increasingly expect instant approvals and soft-pull prequalifications, shortening sale cycles. To protect volume, Sunlight may concede margins or tighten credit criteria to balance originations and loss rates.
- Installer pressure: promos & faster funding
- Consumer expectation: instant decisions, soft-pull prequals
- Sunlight response: concede economics to sustain volumes
Credit tier mix and approval expectations
Installers expect high approval rates across FICO bands—2024 industry surveys show roughly 85% demand for broad approvals to avoid lost sales; when approvals tighten, about 20% of volume shifts to alternative financers or cash, forcing Sunlight to tighten pricing and risk segmentation.
- Approval-demand: 85% (2024)
- Shift-to-alternatives: ~20% (2024)
- Response: tighter pricing, risk tiers, SLAs, pre-quals
Dual-sided bargaining fuels ~20% churn as installers demand ~85% approvals
Customers exert strong leverage: dual-sided bargaining from installers and homeowners drove ~20% platform churn in 2024, with APRs spanning 0% promos to ~8–14% and rate spreads of 0.5–1.5 ppt influencing choice. Installers demand ~85% approval breadth; ~20% of volume shifts when approvals tighten, forcing Sunlight to trade margin for volume or tighten credit.
| Metric | 2024 Value |
|---|---|
| Platform churn | ~20% |
| APR range | 0%–8–14% |
| Rate spread driving choice | 0.5–1.5 ppt |
| Installer approval demand | 85% |
| Shift to alternatives | ~20% |
Preview Before You Purchase
Sunlight Financial Porter's Five Forces Analysis
This preview shows the exact Porter’s Five Forces analysis of Sunlight Financial you'll receive—no surprises, no placeholders. The file covers competitive rivalry, supplier and buyer power, and threats of entry and substitutes, with clear strategic implications. Once purchased, you get this same professionally formatted document instantly.
Original: $10.00
-65%$10.00
$3.50Description
From Overview to Strategy Blueprint
Sunlight Financial's Porter’s Five Forces snapshot highlights strong buyer power, moderate supplier leverage, significant competitive rivalry, a rising threat from fintech substitutes, and manageable entry barriers for niche players. This brief preview outlines strategic pressures and opportunities. Unlock the full Porter's Five Forces Analysis to explore Sunlight Financial’s competitive dynamics, market pressures, and strategic advantages in detail.
Suppliers Bargaining Power
Concentration of capital providers
Sunlight depends on a relatively concentrated set of warehouse lenders, banks and ABS investors to fund loans, and in 2024 that concentration gives providers leverage to demand higher advance rates, tighter covenants or wider spreads. Those demands raise Sunlight’s cost of funds and compress net interest margins. Diversifying funding lines reduces this supplier power but requires additional scale and time to execute.
Installer channel as supply of origination
Contractors supply origination at point of sale, steering homeowners to preferred financiers and giving large installer networks leverage to demand higher dealer fees, faster funding, and tailored products; in 2024 the top 10 U.S. installers controlled roughly 40% of residential deployments, amplifying their bargaining power. Losing a major installer can cut originations materially, and exclusive partnerships concentrate dependence and supplier power.
Dependence on data and tech vendors
Sunlight relies on three major credit bureaus (Equifax, Experian, TransUnion) plus ID verification, e-sign (DocuSign FY2024 revenue ~$2.7B) and cloud services (AWS ~32%, Azure ~23%, GCP ~11% in 2024) for underwriting/onboarding, giving those vendors leverage through high switching costs and complex integrations. Outages or price hikes can throttle approval flow and worsen unit economics, while multi-vendor strategies reduce single-vendor risk but raise integration and OPEX overhead.
Regulatory and compliance service providers
Regulatory and compliance service providers in 2024 materially affect Sunlight Financials speed-to-market across states: their scarce multi-state licensing and servicing expertise is hard to substitute quickly, creating implicit supplier power that can raise customer-acquisition costs if prices or capacity tighten.
- Licensing dependence raises time-to-launch risk
- Price/capacity shifts increase CAC
- Insourcing cuts supplier power but raises fixed costs
Servicers and payment rails
Servicers and ACH/card processors shape borrower experience and delinquency outcomes; industry concentration (top servicers control roughly 60% of consumer loan servicing) boosts their pricing power and handoff errors can materially reduce NPS and raise losses. Contractual SLAs and multi-rail redundancy are standard mitigants in 2024.
- Servicer concentration ~60%
- ACH/card errors increase delinquency and lower NPS
- SLAs and redundancy mitigate operational risk
Concentrated lenders, installer dominance, and vendor concentration raise funding & operational risk
Concentrated warehouse lenders increase Sunlight’s funding costs and covenant pressure. Top-10 installers drive ~40% of residential deployments, giving dealers fee and funding leverage. Dependence on Equifax/Experian/TransUnion, DocuSign (FY2024 rev ~$2.7B) and cloud vendors (AWS ~32%, Azure ~23%, GCP ~11% in 2024) raises switching costs. Servicer concentration (~60%) amplifies pricing and operational risk.
| Supplier | 2024 Metric | Impact |
|---|---|---|
| Installers | Top-10 ≈40% deployments | High origination leverage |
| Cloud/ID/ESign | DocuSign rev ~$2.7B; AWS 32% | High switching cost |
| Servicers | Concentration ~60% | Pricing/operational risk |
What is included in the product
Detailed Word Document
Uncovers key drivers of competition, customer influence, and market entry risks tailored to Sunlight Financial, detailing supplier and buyer power, substitute threats and intensity of rivalry; highlights disruptive entrants and regulatory factors affecting pricing, profitability and strategic positioning.
Customizable Excel Spreadsheet
A single-sheet Porter’s Five Forces summary tailored for Sunlight Financial—quickly spot competitive pressures and opportunities; editable inputs and radar-chart visuals let you test scenarios, paste into decks, and relieve analysis bottlenecks for faster strategic decisions.
Customers Bargaining Power
Dual-sided customers: contractors and homeowners
Dual-sided customers create layered buyer power: contractors select financing partners based on approval rates and dealer fees, and many markets saw platform churn near 20% in 2024 if economics worsened. Homeowners remain rate-sensitive, comparing APRs that in 2024 ranged from 0% promos to roughly 8–14% typical offers. Both sides can walk, squeezing margins and forcing higher service levels.
Price transparency and rate sensitivity
Online calculators and competitor quotes make APRs and dealer fees highly visible, with rate spreads of roughly 0.5–1.5 percentage points often driving choice for large home-improvement loans. Small rate differences sway decisions on projects costing tens of thousands, enabling buyers to negotiate discounts or demand buydowns of 0.25–1.0 point. Sunlight must balance being competitively priced against preserving risk-adjusted returns and portfolio credit metrics.
Low switching costs at point of sale
Low switching costs at point of sale let installers toggle between multiple financing portals during a 2024 sales visit, with minimal integration friction reducing platform lock-in. This empowers installers to chase higher approval rates or better payouts in real time. Deep partner relationships and embedded workflows—CRM links, single-sign-on, commission automation—are the primary levers to raise switching costs.
Demand cyclicality and incentives
Buyer leverage rises when demand softens from higher rates or seasonality, prompting installers to press Sunlight for promotions and faster funding to close sales. Homeowners increasingly expect instant approvals and soft-pull prequalifications, shortening sale cycles. To protect volume, Sunlight may concede margins or tighten credit criteria to balance originations and loss rates.
- Installer pressure: promos & faster funding
- Consumer expectation: instant decisions, soft-pull prequals
- Sunlight response: concede economics to sustain volumes
Credit tier mix and approval expectations
Installers expect high approval rates across FICO bands—2024 industry surveys show roughly 85% demand for broad approvals to avoid lost sales; when approvals tighten, about 20% of volume shifts to alternative financers or cash, forcing Sunlight to tighten pricing and risk segmentation.
- Approval-demand: 85% (2024)
- Shift-to-alternatives: ~20% (2024)
- Response: tighter pricing, risk tiers, SLAs, pre-quals
Dual-sided bargaining fuels ~20% churn as installers demand ~85% approvals
Customers exert strong leverage: dual-sided bargaining from installers and homeowners drove ~20% platform churn in 2024, with APRs spanning 0% promos to ~8–14% and rate spreads of 0.5–1.5 ppt influencing choice. Installers demand ~85% approval breadth; ~20% of volume shifts when approvals tighten, forcing Sunlight to trade margin for volume or tighten credit.
| Metric | 2024 Value |
|---|---|
| Platform churn | ~20% |
| APR range | 0%–8–14% |
| Rate spread driving choice | 0.5–1.5 ppt |
| Installer approval demand | 85% |
| Shift to alternatives | ~20% |
Preview Before You Purchase
Sunlight Financial Porter's Five Forces Analysis
This preview shows the exact Porter’s Five Forces analysis of Sunlight Financial you'll receive—no surprises, no placeholders. The file covers competitive rivalry, supplier and buyer power, and threats of entry and substitutes, with clear strategic implications. Once purchased, you get this same professionally formatted document instantly.











