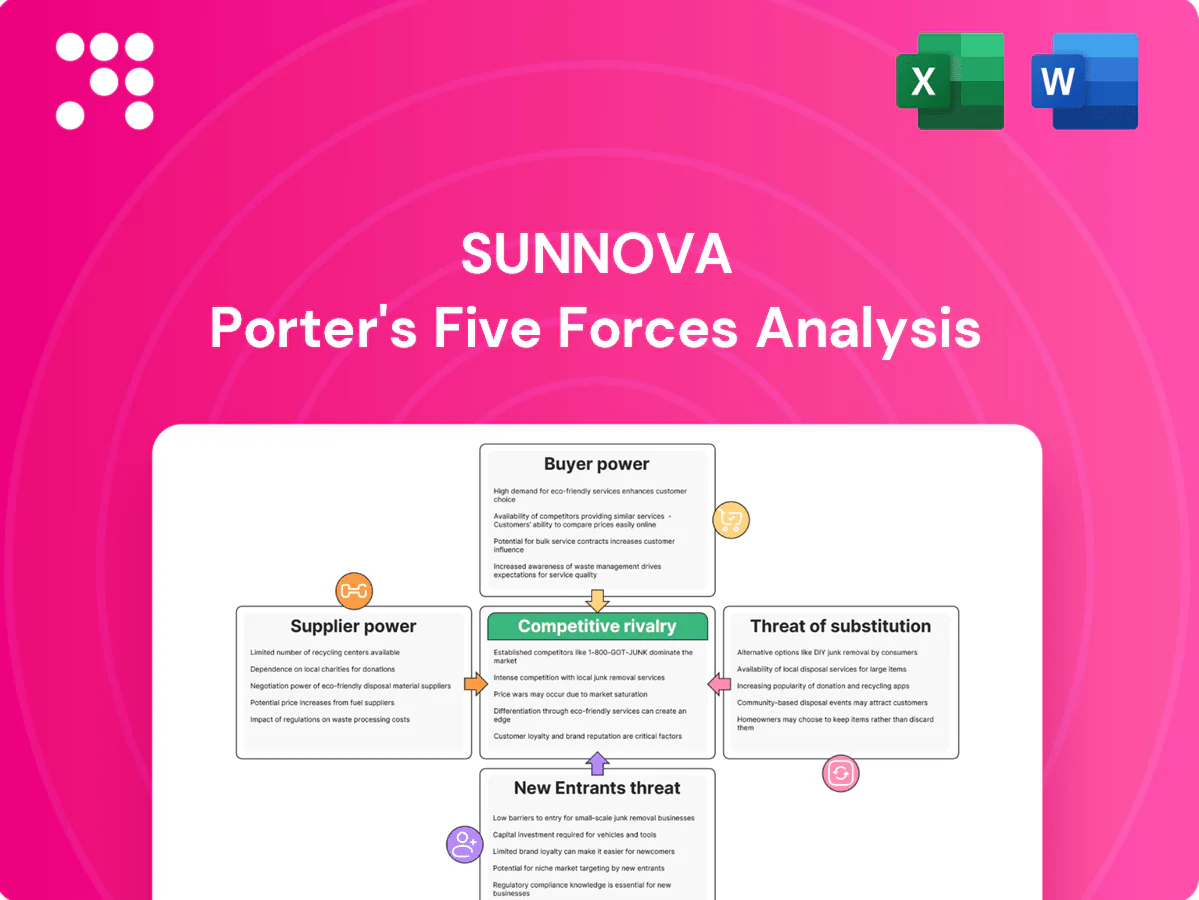
Sunnova Porter's Five Forces Analysis

Elevate Your Analysis with the Complete Porter's Five Forces Analysis
Sunnova faces intense competitive rivalry, evolving supplier dynamics, and growing substitute threats as rooftop and storage markets expand; buyer bargaining and regulatory shifts further shape margins. This snapshot highlights key pressures but omits force-by-force scoring and visuals. Unlock the full Porter's Five Forces Analysis for a complete, actionable strategic breakdown tailored to Sunnova.
Suppliers Bargaining Power

Concentrated module suppliers
Solar module supply is dominated by a few large Asian players — top five suppliers accounted for about 70% of global module shipments in 2023–24 and China produced roughly 85% of PV cells, concentrating leverage. Price volatility and US/EU tariffs, AD/CVD actions and Section 201 threats have tightened availability and spiked spot prices. Sunnova can dual-source, but lender bankability standards limit alternatives. Long-term contracts mitigate risk though shifts to TOPCon/HJT can reset pricing and terms.
Battery and inverter dependence
Storage and inverter ecosystems with proprietary firmware and certifications such as UL 9540A create vendor lock-in, giving certified suppliers outsized bargaining power. In 2024 high-demand brands with UL listings often received allocation priority and price premiums in tight markets. Component and cell shortages continued into 2024, delaying installs and driving change orders. Sunnova’s multi-vendor catalog reduces but does not eliminate supplier power.

Skilled labor and EPC capacity
Certified installers, electricians, and roofers remain finite in many U.S. markets, and 2024 wage inflation in construction labor ran roughly mid-single digits, raising per-install execution costs for Sunnova's EPC network.
Peak-season bottlenecks give subcontractors negotiating leverage, increasing lead times and margin pressure on project economics.
Standardized processes, training pipelines, and preferred-partner programs have been deployed to rebalance terms and cap cost escalation.

Software, monitoring, and IoT stacks
- Proprietary platforms increase lock-in
- Switching risks: data loss, truck rolls, retraining
- Bundled features raise costs
- Open APIs and in-house tools mitigate supplier power
Capital providers and equipment financiers
Capital providers and equipment financiers — securitization buyers, tax equity and lenders — materially shape Sunnova pricing and deployment: 2024 Federal Reserve policy left the fed funds target at 5.25–5.50%, so rate moves and credit spread changes flow directly into customer offers and IRR thresholds. Covenant terms in financing agreements can limit product flexibility and geography, while diversifying funding sources reduces concentration risk.
- Fed funds 2024: 5.25–5.50%
- Covenants constrain product/geography
- Diversify funding to cut concentration risk
Top-5 ~70%, China cells 85%, funding rate 5.25–5.50% raises leverage
Module supply concentrated: top-5 ~70% global shipments (2023–24) and China ~85% PV cell share, raising supplier leverage. Inverter/monitoring certifications (UL 9540A) and proprietary firmware create lock-in and switching costs. Financing/capital sets pricing: fed funds 5.25–5.50% (2024), covenant constraints raise dependency.
| Metric | 2024 |
|---|---|
| Top-5 module share | ~70% |
| China PV cell production | ~85% |
| Fed funds target | 5.25–5.50% |
| Labor inflation | ~5% |
What is included in the product
 Detailed Word Document
Uncovers key drivers of competition, customer influence, and market entry risks tailored to Sunnova's solar and energy-storage business. Evaluates supplier and buyer power, identifies disruptive substitutes and regulatory threats, and is delivered in fully editable Word format for investor decks and strategy use.

 Customizable Excel Spreadsheet
One-sheet Sunnova Porter's Five Forces distills competitive pressures into actionable scores and radar visuals, enabling fast strategic choices and investor-ready slides while allowing easy customization for shifting market data or scenarios.
Customers Bargaining Power

Many installer alternatives
Homeowners in 2024 can choose national providers such as Sunrun and Tesla, thousands of local installers, or DIY/marketplace routes, increasing alternative options and bargaining leverage. Abundant customer quotes and reviews intensify price comparison and negotiation, while lead aggregators like EnergySage and modern digital platforms heighten transparency. Sunnova must differentiate on service quality, stronger warranties, and flexible financing to reduce churn and maintain margin.
High price sensitivity
Monthly bill savings drive Sunnova demand: US average residential bill ~$151/mo in 2024 and retail price ~16.8¢/kWh, making APRs and PPA offers highly elastic. A 1% rise in borrowing costs (30‑yr mortgage ~6.8% in 2024) quickly lowers close rates. Clarity on 30% ITC and local SREC values shapes perceived value. Clear TCO framing and inflation hedging blunt customer pushback.

Contract lock-in vs. switching
Sunnova’s up-to-25-year service agreements materially raise post-install switching costs, locking customers into long-duration maintenance and financing commitments. Pre-install, shoppers remain fluid and often churn during quoting and permit phases, keeping bargaining power higher before activation. Transferability on home sale and documented transfer processes can lower perceived lock-in; streamlined transfers reduce buyer leverage by making contracts easier to pass to new owners.

Quality, brand, and reviews
Online ratings and neighbor referrals amplify buyer voice; BrightLocal 2024 reports about 79% of consumers trust online reviews as much as personal recommendations, increasing pressure on Sunnova’s perceived quality.
Service response times and production guarantees are heavily scrutinized; any outage or claim dispute can quickly erode pricing power and renewals.
Proactive communications and uptime SLAs—with clear remediation terms—preserve goodwill and limit churn risk.
- 79% trust reviews (BrightLocal 2024)
- Rapid response and clear guarantees reduce dispute-driven churn
- Outages directly pressure pricing power and referrals
- Proactive SLAs sustain customer goodwill
Policy-driven expectations
- Net metering cuts: up to 70% export value decline (2023–24)
- Battery attach rates: ~30–40% in 2024
- Sales cycle impact: longer due to education and storage considerations
- Transparent modeling: reduces contract renegotiation pressure
Net metering cuts and 16.8¢/kWh push homeowners toward cost-first solar
Homeowners face many alternatives (Sunrun, Tesla, local installers, DIY), boosting bargaining power and price sensitivity. Net metering cuts and 16.8¢/kWh retail rates make savings-driven elasticity high; battery attach ~30–40% raises sales complexity. Long service contracts raise switching costs but pre-install churn remains elevated; fast service and clear warranties reduce renegotiation.
| Metric | 2024 Value |
|---|---|
| Retail rate | 16.8¢/kWh |
| Avg bill | $151/mo |
| Mortgage rate (30yr) | ~6.8% |
| Battery attach | 30–40% |
| Trust reviews | 79% |
Preview the Actual Deliverable
Sunnova Porter's Five Forces Analysis
This preview shows the exact Sunnova Porter's Five Forces Analysis you'll receive immediately after purchase—no placeholders or mockups. The full document is fully formatted, professionally written, and ready for download and use the moment you buy. You're looking at the deliverable; once payment is complete you’ll get instant access to this same file.

Elevate Your Analysis with the Complete Porter's Five Forces Analysis
Sunnova faces intense competitive rivalry, evolving supplier dynamics, and growing substitute threats as rooftop and storage markets expand; buyer bargaining and regulatory shifts further shape margins. This snapshot highlights key pressures but omits force-by-force scoring and visuals. Unlock the full Porter's Five Forces Analysis for a complete, actionable strategic breakdown tailored to Sunnova.
Suppliers Bargaining Power
Concentrated module suppliers
Solar module supply is dominated by a few large Asian players — top five suppliers accounted for about 70% of global module shipments in 2023–24 and China produced roughly 85% of PV cells, concentrating leverage. Price volatility and US/EU tariffs, AD/CVD actions and Section 201 threats have tightened availability and spiked spot prices. Sunnova can dual-source, but lender bankability standards limit alternatives. Long-term contracts mitigate risk though shifts to TOPCon/HJT can reset pricing and terms.
Battery and inverter dependence
Storage and inverter ecosystems with proprietary firmware and certifications such as UL 9540A create vendor lock-in, giving certified suppliers outsized bargaining power. In 2024 high-demand brands with UL listings often received allocation priority and price premiums in tight markets. Component and cell shortages continued into 2024, delaying installs and driving change orders. Sunnova’s multi-vendor catalog reduces but does not eliminate supplier power.
Skilled labor and EPC capacity
Certified installers, electricians, and roofers remain finite in many U.S. markets, and 2024 wage inflation in construction labor ran roughly mid-single digits, raising per-install execution costs for Sunnova's EPC network.
Peak-season bottlenecks give subcontractors negotiating leverage, increasing lead times and margin pressure on project economics.
Standardized processes, training pipelines, and preferred-partner programs have been deployed to rebalance terms and cap cost escalation.
Software, monitoring, and IoT stacks
- Proprietary platforms increase lock-in
- Switching risks: data loss, truck rolls, retraining
- Bundled features raise costs
- Open APIs and in-house tools mitigate supplier power
Capital providers and equipment financiers
Capital providers and equipment financiers — securitization buyers, tax equity and lenders — materially shape Sunnova pricing and deployment: 2024 Federal Reserve policy left the fed funds target at 5.25–5.50%, so rate moves and credit spread changes flow directly into customer offers and IRR thresholds. Covenant terms in financing agreements can limit product flexibility and geography, while diversifying funding sources reduces concentration risk.
- Fed funds 2024: 5.25–5.50%
- Covenants constrain product/geography
- Diversify funding to cut concentration risk
Top-5 ~70%, China cells 85%, funding rate 5.25–5.50% raises leverage
Module supply concentrated: top-5 ~70% global shipments (2023–24) and China ~85% PV cell share, raising supplier leverage. Inverter/monitoring certifications (UL 9540A) and proprietary firmware create lock-in and switching costs. Financing/capital sets pricing: fed funds 5.25–5.50% (2024), covenant constraints raise dependency.
| Metric | 2024 |
|---|---|
| Top-5 module share | ~70% |
| China PV cell production | ~85% |
| Fed funds target | 5.25–5.50% |
| Labor inflation | ~5% |
What is included in the product
Detailed Word Document
Uncovers key drivers of competition, customer influence, and market entry risks tailored to Sunnova's solar and energy-storage business. Evaluates supplier and buyer power, identifies disruptive substitutes and regulatory threats, and is delivered in fully editable Word format for investor decks and strategy use.
Customizable Excel Spreadsheet
One-sheet Sunnova Porter's Five Forces distills competitive pressures into actionable scores and radar visuals, enabling fast strategic choices and investor-ready slides while allowing easy customization for shifting market data or scenarios.
Customers Bargaining Power
Many installer alternatives
Homeowners in 2024 can choose national providers such as Sunrun and Tesla, thousands of local installers, or DIY/marketplace routes, increasing alternative options and bargaining leverage. Abundant customer quotes and reviews intensify price comparison and negotiation, while lead aggregators like EnergySage and modern digital platforms heighten transparency. Sunnova must differentiate on service quality, stronger warranties, and flexible financing to reduce churn and maintain margin.
High price sensitivity
Monthly bill savings drive Sunnova demand: US average residential bill ~$151/mo in 2024 and retail price ~16.8¢/kWh, making APRs and PPA offers highly elastic. A 1% rise in borrowing costs (30‑yr mortgage ~6.8% in 2024) quickly lowers close rates. Clarity on 30% ITC and local SREC values shapes perceived value. Clear TCO framing and inflation hedging blunt customer pushback.
Contract lock-in vs. switching
Sunnova’s up-to-25-year service agreements materially raise post-install switching costs, locking customers into long-duration maintenance and financing commitments. Pre-install, shoppers remain fluid and often churn during quoting and permit phases, keeping bargaining power higher before activation. Transferability on home sale and documented transfer processes can lower perceived lock-in; streamlined transfers reduce buyer leverage by making contracts easier to pass to new owners.
Quality, brand, and reviews
Online ratings and neighbor referrals amplify buyer voice; BrightLocal 2024 reports about 79% of consumers trust online reviews as much as personal recommendations, increasing pressure on Sunnova’s perceived quality.
Service response times and production guarantees are heavily scrutinized; any outage or claim dispute can quickly erode pricing power and renewals.
Proactive communications and uptime SLAs—with clear remediation terms—preserve goodwill and limit churn risk.
- 79% trust reviews (BrightLocal 2024)
- Rapid response and clear guarantees reduce dispute-driven churn
- Outages directly pressure pricing power and referrals
- Proactive SLAs sustain customer goodwill
Policy-driven expectations
- Net metering cuts: up to 70% export value decline (2023–24)
- Battery attach rates: ~30–40% in 2024
- Sales cycle impact: longer due to education and storage considerations
- Transparent modeling: reduces contract renegotiation pressure
Net metering cuts and 16.8¢/kWh push homeowners toward cost-first solar
Homeowners face many alternatives (Sunrun, Tesla, local installers, DIY), boosting bargaining power and price sensitivity. Net metering cuts and 16.8¢/kWh retail rates make savings-driven elasticity high; battery attach ~30–40% raises sales complexity. Long service contracts raise switching costs but pre-install churn remains elevated; fast service and clear warranties reduce renegotiation.
| Metric | 2024 Value |
|---|---|
| Retail rate | 16.8¢/kWh |
| Avg bill | $151/mo |
| Mortgage rate (30yr) | ~6.8% |
| Battery attach | 30–40% |
| Trust reviews | 79% |
Preview the Actual Deliverable
Sunnova Porter's Five Forces Analysis
This preview shows the exact Sunnova Porter's Five Forces Analysis you'll receive immediately after purchase—no placeholders or mockups. The full document is fully formatted, professionally written, and ready for download and use the moment you buy. You're looking at the deliverable; once payment is complete you’ll get instant access to this same file.
Original: $10.00
-65%$10.00
$3.50Description
Elevate Your Analysis with the Complete Porter's Five Forces Analysis
Sunnova faces intense competitive rivalry, evolving supplier dynamics, and growing substitute threats as rooftop and storage markets expand; buyer bargaining and regulatory shifts further shape margins. This snapshot highlights key pressures but omits force-by-force scoring and visuals. Unlock the full Porter's Five Forces Analysis for a complete, actionable strategic breakdown tailored to Sunnova.
Suppliers Bargaining Power
Concentrated module suppliers
Solar module supply is dominated by a few large Asian players — top five suppliers accounted for about 70% of global module shipments in 2023–24 and China produced roughly 85% of PV cells, concentrating leverage. Price volatility and US/EU tariffs, AD/CVD actions and Section 201 threats have tightened availability and spiked spot prices. Sunnova can dual-source, but lender bankability standards limit alternatives. Long-term contracts mitigate risk though shifts to TOPCon/HJT can reset pricing and terms.
Battery and inverter dependence
Storage and inverter ecosystems with proprietary firmware and certifications such as UL 9540A create vendor lock-in, giving certified suppliers outsized bargaining power. In 2024 high-demand brands with UL listings often received allocation priority and price premiums in tight markets. Component and cell shortages continued into 2024, delaying installs and driving change orders. Sunnova’s multi-vendor catalog reduces but does not eliminate supplier power.
Skilled labor and EPC capacity
Certified installers, electricians, and roofers remain finite in many U.S. markets, and 2024 wage inflation in construction labor ran roughly mid-single digits, raising per-install execution costs for Sunnova's EPC network.
Peak-season bottlenecks give subcontractors negotiating leverage, increasing lead times and margin pressure on project economics.
Standardized processes, training pipelines, and preferred-partner programs have been deployed to rebalance terms and cap cost escalation.
Software, monitoring, and IoT stacks
- Proprietary platforms increase lock-in
- Switching risks: data loss, truck rolls, retraining
- Bundled features raise costs
- Open APIs and in-house tools mitigate supplier power
Capital providers and equipment financiers
Capital providers and equipment financiers — securitization buyers, tax equity and lenders — materially shape Sunnova pricing and deployment: 2024 Federal Reserve policy left the fed funds target at 5.25–5.50%, so rate moves and credit spread changes flow directly into customer offers and IRR thresholds. Covenant terms in financing agreements can limit product flexibility and geography, while diversifying funding sources reduces concentration risk.
- Fed funds 2024: 5.25–5.50%
- Covenants constrain product/geography
- Diversify funding to cut concentration risk
Top-5 ~70%, China cells 85%, funding rate 5.25–5.50% raises leverage
Module supply concentrated: top-5 ~70% global shipments (2023–24) and China ~85% PV cell share, raising supplier leverage. Inverter/monitoring certifications (UL 9540A) and proprietary firmware create lock-in and switching costs. Financing/capital sets pricing: fed funds 5.25–5.50% (2024), covenant constraints raise dependency.
| Metric | 2024 |
|---|---|
| Top-5 module share | ~70% |
| China PV cell production | ~85% |
| Fed funds target | 5.25–5.50% |
| Labor inflation | ~5% |
What is included in the product
Detailed Word Document
Uncovers key drivers of competition, customer influence, and market entry risks tailored to Sunnova's solar and energy-storage business. Evaluates supplier and buyer power, identifies disruptive substitutes and regulatory threats, and is delivered in fully editable Word format for investor decks and strategy use.
Customizable Excel Spreadsheet
One-sheet Sunnova Porter's Five Forces distills competitive pressures into actionable scores and radar visuals, enabling fast strategic choices and investor-ready slides while allowing easy customization for shifting market data or scenarios.
Customers Bargaining Power
Many installer alternatives
Homeowners in 2024 can choose national providers such as Sunrun and Tesla, thousands of local installers, or DIY/marketplace routes, increasing alternative options and bargaining leverage. Abundant customer quotes and reviews intensify price comparison and negotiation, while lead aggregators like EnergySage and modern digital platforms heighten transparency. Sunnova must differentiate on service quality, stronger warranties, and flexible financing to reduce churn and maintain margin.
High price sensitivity
Monthly bill savings drive Sunnova demand: US average residential bill ~$151/mo in 2024 and retail price ~16.8¢/kWh, making APRs and PPA offers highly elastic. A 1% rise in borrowing costs (30‑yr mortgage ~6.8% in 2024) quickly lowers close rates. Clarity on 30% ITC and local SREC values shapes perceived value. Clear TCO framing and inflation hedging blunt customer pushback.
Contract lock-in vs. switching
Sunnova’s up-to-25-year service agreements materially raise post-install switching costs, locking customers into long-duration maintenance and financing commitments. Pre-install, shoppers remain fluid and often churn during quoting and permit phases, keeping bargaining power higher before activation. Transferability on home sale and documented transfer processes can lower perceived lock-in; streamlined transfers reduce buyer leverage by making contracts easier to pass to new owners.
Quality, brand, and reviews
Online ratings and neighbor referrals amplify buyer voice; BrightLocal 2024 reports about 79% of consumers trust online reviews as much as personal recommendations, increasing pressure on Sunnova’s perceived quality.
Service response times and production guarantees are heavily scrutinized; any outage or claim dispute can quickly erode pricing power and renewals.
Proactive communications and uptime SLAs—with clear remediation terms—preserve goodwill and limit churn risk.
- 79% trust reviews (BrightLocal 2024)
- Rapid response and clear guarantees reduce dispute-driven churn
- Outages directly pressure pricing power and referrals
- Proactive SLAs sustain customer goodwill
Policy-driven expectations
- Net metering cuts: up to 70% export value decline (2023–24)
- Battery attach rates: ~30–40% in 2024
- Sales cycle impact: longer due to education and storage considerations
- Transparent modeling: reduces contract renegotiation pressure
Net metering cuts and 16.8¢/kWh push homeowners toward cost-first solar
Homeowners face many alternatives (Sunrun, Tesla, local installers, DIY), boosting bargaining power and price sensitivity. Net metering cuts and 16.8¢/kWh retail rates make savings-driven elasticity high; battery attach ~30–40% raises sales complexity. Long service contracts raise switching costs but pre-install churn remains elevated; fast service and clear warranties reduce renegotiation.
| Metric | 2024 Value |
|---|---|
| Retail rate | 16.8¢/kWh |
| Avg bill | $151/mo |
| Mortgage rate (30yr) | ~6.8% |
| Battery attach | 30–40% |
| Trust reviews | 79% |
Preview the Actual Deliverable
Sunnova Porter's Five Forces Analysis
This preview shows the exact Sunnova Porter's Five Forces Analysis you'll receive immediately after purchase—no placeholders or mockups. The full document is fully formatted, professionally written, and ready for download and use the moment you buy. You're looking at the deliverable; once payment is complete you’ll get instant access to this same file.











