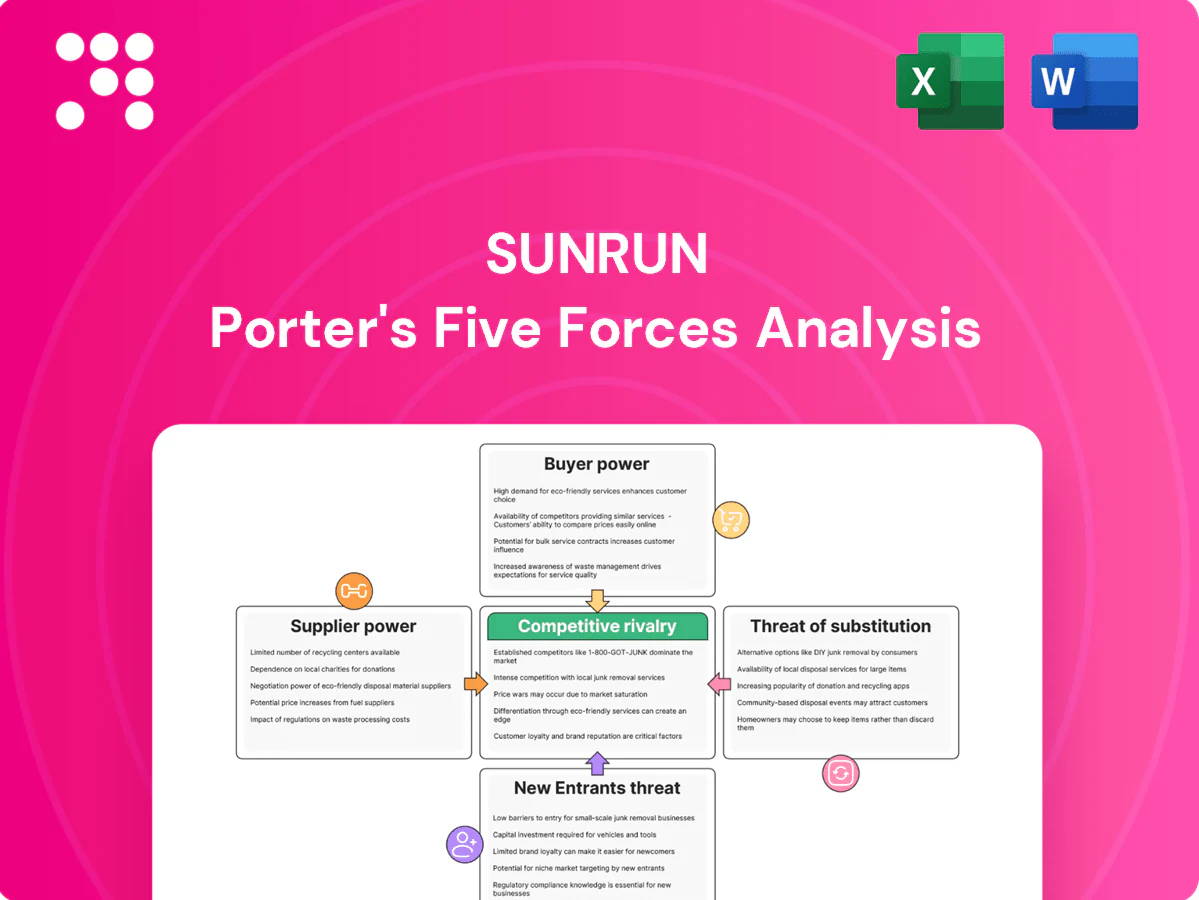
Sunrun Porter's Five Forces Analysis

A Must-Have Tool for Decision-Makers
Sunrun faces intense rivalry from national installers and utilities, rising buyer price sensitivity, and supplier constraints on panels and batteries that shape margins and growth prospects; regulatory shifts and technology adoption also alter entry barriers and substitute threats. This snapshot highlights key pressure points and strategic levers for Sunrun's competitive positioning. Unlock the full Porter's Five Forces Analysis to access detailed force ratings, visuals, and actionable recommendations.
Suppliers Bargaining Power

Concentrated module and battery vendors
Sunrun depends on a limited set of Tier-1 PV and battery suppliers, exposing it to vendor pricing and allocation leverage; the top five global solar module makers held roughly 70% of shipments in 2023. Brand-specific storage and integrated ecosystems increase switching frictions and installation complexity. Supplier prioritization during tight cycles has compressed delivery windows and reduced project throughput. Long-term contracts reduce but do not remove concentration risk.
Polysilicon and component price volatility
Upstream commodity swings—polysilicon, cells and inverters—have driven price volatility (polysilicon rose over 200% in 2020–2022) that pressures Sunrun margins and short-term quote validity. Suppliers can pass surcharges or change lead times, and although hedging and diversified sourcing mitigate risk, sudden spikes still strain unit economics. Reversals in cost declines, such as a ~20% module ASP drop in 2023, complicate fixed pricing to homeowners.

Skilled labor and EPC subcontractors
Installation crews and specialized electricians are scarce in hot U.S. markets, increasing EPC subcontractor leverage and pushing labor costs; construction wages rose about 4.5% YoY in 2023–24 (BLS), eroding project margins when overtime premiums apply. Sunrun’s in-house crew buildout and training pipelines lower exposure but require quarters to scale, while scheduling conflicts can push revenue recognition into later quarters.

Interconnection hardware and permitting dependencies
Interconnection hardware and AHJ/utility permitting create recurring bottlenecks for Sunrun: balance-of-system items (inverters, racking, meters) face multi-week lead times as of 2024, letting suppliers exert pricing power or stricter terms on constrained SKUs; resulting delays raise carrying costs and cancellation risk; standardization and multi-vendor approvals materially cut single‑point supplier exposure.
- Supplier leverage on constrained SKUs
- Multi-week lead times (2024)
- Higher carrying costs and cancellations
- Standardization, multi-vendor approvals reduce risk
Capital providers and tax equity
Tax equity, debt facilities and ABS investors are core financial suppliers for Sunrun leases/PPAs; shifts in the fed funds rate (5.25–5.50% in late 2024) and investor risk appetite directly raise financing costs and tighten covenants. Limited tax equity supply in 2024 increased financiers’ pricing power, while Sunrun’s scale and performance data improve but do not fully neutralize that leverage.
- Tax equity scarcity → higher pricing
- Rate environment (5.25–5.50% late 2024) ↑ cost of capital
- Scale/performance help negotiating leverage but remain partial
Concentrated module supply (~70%), polysilicon > 200%, ASPs -20%, wages +4.5%, fed 5.25–5.50%
Sunrun faces concentrated supplier power: top five module makers ~70% of 2023 shipments, polysilicon surged >200% (2020–22) and module ASPs fell ~20% in 2023, creating margin volatility. Labor and EPC scarcity (construction wages +4.5% YoY 2023–24) and multi‑week lead times (2024) increase supplier leverage; long‑term contracts and in‑house crews partially mitigate. Tax equity scarcity and a 5.25–5.50% fed funds range (late 2024) raise financing costs.
| Metric | Value |
|---|---|
| Top-5 module share (2023) | ~70% |
| Polysilicon move (2020–22) | +>200% |
| Module ASP change (2023) | ≈-20% |
| Construction wages YoY (2023–24) | +4.5% |
| Fed funds (late 2024) | 5.25–5.50% |
What is included in the product
 Detailed Word Document
Tailored Porter’s Five Forces analysis for Sunrun that uncovers competitive intensity, buyer and supplier power, substitute threats, and entry barriers, highlighting disruptive risks and strategic levers for investors and managers.

 Customizable Excel Spreadsheet
A clear, one-sheet summary of all five forces for Sunrun—perfect for quick decision-making and reducing analysis paralysis.
Customers Bargaining Power

Price-sensitive homeowners
Price-sensitive homeowners weigh lifetime savings versus utility bills (US average ~16¢/kWh in 2024), squeezing Sunrun on quotes and concessions. Elevated borrowing costs — 30-year rates near 7% in 2024 — raise monthly payments and heighten pushback. Clear incentives like the 30% ITC (IRA through 2032) and state rebates materially affect willingness to pay. Transparent payback math (median residential solar payback ~9 years) gives buyers credible negotiation footing.
Many alternatives and easy comparison
Competing national and local installers generate multiple bids for homeowners, and in 2024 over 50% of U.S. residential solar shoppers solicited at least two quotes, intensifying price competition. Online marketplaces and community referrals make side-by-side comparisons routine, pressuring margins and forcing stronger value propositions. Differentiation through extended warranties, maintenance plans and superior service has become crucial to win customers.

Contract terms and cancellation leverage
Buyers scrutinize escalators, transferability, and early termination clauses, and perceived lock-in can stall closes unless terms allow flexibility. Cooling-off periods and contingent financing give customers walkaway power, driving demand for transparent cancellation fees; Sunrun's scale after the $3.2 billion Vivint Solar acquisition increases visibility of such clauses. Clear, consumer-friendly contracts reduce friction and renegotiation.

Regional policy and utility rate influence
- Impact: NEM 3.0 cut export credits vs retail, lowering ROI
- Incentives: ITC 30% through 2032
- Buyer leverage: higher in weak-NEM regions
- Sales focus: quantify bill savings to overcome resistance
Demand for bundled solutions
Customers increasingly demand solar+storage, EV charging and energy-management integration; in 2024 bundled offers raised average ticket sizes while driving stronger expectations for uptime and performance guarantees. Buyers leverage bundle complexity to extract package discounts, compressing margins. Seamless apps and real-time monitoring allowed providers to charge premiums—Sunrun-scale competitors reported ~20% higher ARPU on integrated installs in 2024.
Price-sensitive homeowners push for lower solar bids as 30% ITC and ~9 yrs payback temper demand
Price-sensitive homeowners (US avg 16¢/kWh in 2024) push for lower quotes; 30-yr rates ~7% raise monthly costs and bargaining leverage. ITC 30% through 2032 and median payback ~9 years temper demands, while >50% of shoppers solicit multiple bids, intensifying price pressure. Demand for solar+storage/EV adds ticket size but buyers extract bundle discounts, compressing margins.
| Metric | 2024 |
|---|---|
| Utility rate | 16¢/kWh |
| 30-yr rate | ~7% |
| Median payback | ~9 yrs |
| Multi-bid shoppers | >50% |
| ITC | 30% |
| ARPU premium (bundles) | ~20% |
Preview Before You Purchase
Sunrun Porter's Five Forces Analysis
This preview shows the exact Sunrun Porter's Five Forces Analysis you'll receive immediately after purchase—no placeholders or mockups. The document displayed is the complete, professionally formatted analysis ready for download and use the moment you buy. You're looking at the final deliverable; once payment is complete, you'll have instant access to this identical file.

A Must-Have Tool for Decision-Makers
Sunrun faces intense rivalry from national installers and utilities, rising buyer price sensitivity, and supplier constraints on panels and batteries that shape margins and growth prospects; regulatory shifts and technology adoption also alter entry barriers and substitute threats. This snapshot highlights key pressure points and strategic levers for Sunrun's competitive positioning. Unlock the full Porter's Five Forces Analysis to access detailed force ratings, visuals, and actionable recommendations.
Suppliers Bargaining Power
Concentrated module and battery vendors
Sunrun depends on a limited set of Tier-1 PV and battery suppliers, exposing it to vendor pricing and allocation leverage; the top five global solar module makers held roughly 70% of shipments in 2023. Brand-specific storage and integrated ecosystems increase switching frictions and installation complexity. Supplier prioritization during tight cycles has compressed delivery windows and reduced project throughput. Long-term contracts reduce but do not remove concentration risk.
Polysilicon and component price volatility
Upstream commodity swings—polysilicon, cells and inverters—have driven price volatility (polysilicon rose over 200% in 2020–2022) that pressures Sunrun margins and short-term quote validity. Suppliers can pass surcharges or change lead times, and although hedging and diversified sourcing mitigate risk, sudden spikes still strain unit economics. Reversals in cost declines, such as a ~20% module ASP drop in 2023, complicate fixed pricing to homeowners.
Skilled labor and EPC subcontractors
Installation crews and specialized electricians are scarce in hot U.S. markets, increasing EPC subcontractor leverage and pushing labor costs; construction wages rose about 4.5% YoY in 2023–24 (BLS), eroding project margins when overtime premiums apply. Sunrun’s in-house crew buildout and training pipelines lower exposure but require quarters to scale, while scheduling conflicts can push revenue recognition into later quarters.
Interconnection hardware and permitting dependencies
Interconnection hardware and AHJ/utility permitting create recurring bottlenecks for Sunrun: balance-of-system items (inverters, racking, meters) face multi-week lead times as of 2024, letting suppliers exert pricing power or stricter terms on constrained SKUs; resulting delays raise carrying costs and cancellation risk; standardization and multi-vendor approvals materially cut single‑point supplier exposure.
- Supplier leverage on constrained SKUs
- Multi-week lead times (2024)
- Higher carrying costs and cancellations
- Standardization, multi-vendor approvals reduce risk
Capital providers and tax equity
Tax equity, debt facilities and ABS investors are core financial suppliers for Sunrun leases/PPAs; shifts in the fed funds rate (5.25–5.50% in late 2024) and investor risk appetite directly raise financing costs and tighten covenants. Limited tax equity supply in 2024 increased financiers’ pricing power, while Sunrun’s scale and performance data improve but do not fully neutralize that leverage.
- Tax equity scarcity → higher pricing
- Rate environment (5.25–5.50% late 2024) ↑ cost of capital
- Scale/performance help negotiating leverage but remain partial
Concentrated module supply (~70%), polysilicon > 200%, ASPs -20%, wages +4.5%, fed 5.25–5.50%
Sunrun faces concentrated supplier power: top five module makers ~70% of 2023 shipments, polysilicon surged >200% (2020–22) and module ASPs fell ~20% in 2023, creating margin volatility. Labor and EPC scarcity (construction wages +4.5% YoY 2023–24) and multi‑week lead times (2024) increase supplier leverage; long‑term contracts and in‑house crews partially mitigate. Tax equity scarcity and a 5.25–5.50% fed funds range (late 2024) raise financing costs.
| Metric | Value |
|---|---|
| Top-5 module share (2023) | ~70% |
| Polysilicon move (2020–22) | +>200% |
| Module ASP change (2023) | ≈-20% |
| Construction wages YoY (2023–24) | +4.5% |
| Fed funds (late 2024) | 5.25–5.50% |
What is included in the product
Detailed Word Document
Tailored Porter’s Five Forces analysis for Sunrun that uncovers competitive intensity, buyer and supplier power, substitute threats, and entry barriers, highlighting disruptive risks and strategic levers for investors and managers.
Customizable Excel Spreadsheet
A clear, one-sheet summary of all five forces for Sunrun—perfect for quick decision-making and reducing analysis paralysis.
Customers Bargaining Power
Price-sensitive homeowners
Price-sensitive homeowners weigh lifetime savings versus utility bills (US average ~16¢/kWh in 2024), squeezing Sunrun on quotes and concessions. Elevated borrowing costs — 30-year rates near 7% in 2024 — raise monthly payments and heighten pushback. Clear incentives like the 30% ITC (IRA through 2032) and state rebates materially affect willingness to pay. Transparent payback math (median residential solar payback ~9 years) gives buyers credible negotiation footing.
Many alternatives and easy comparison
Competing national and local installers generate multiple bids for homeowners, and in 2024 over 50% of U.S. residential solar shoppers solicited at least two quotes, intensifying price competition. Online marketplaces and community referrals make side-by-side comparisons routine, pressuring margins and forcing stronger value propositions. Differentiation through extended warranties, maintenance plans and superior service has become crucial to win customers.
Contract terms and cancellation leverage
Buyers scrutinize escalators, transferability, and early termination clauses, and perceived lock-in can stall closes unless terms allow flexibility. Cooling-off periods and contingent financing give customers walkaway power, driving demand for transparent cancellation fees; Sunrun's scale after the $3.2 billion Vivint Solar acquisition increases visibility of such clauses. Clear, consumer-friendly contracts reduce friction and renegotiation.
Regional policy and utility rate influence
- Impact: NEM 3.0 cut export credits vs retail, lowering ROI
- Incentives: ITC 30% through 2032
- Buyer leverage: higher in weak-NEM regions
- Sales focus: quantify bill savings to overcome resistance
Demand for bundled solutions
Customers increasingly demand solar+storage, EV charging and energy-management integration; in 2024 bundled offers raised average ticket sizes while driving stronger expectations for uptime and performance guarantees. Buyers leverage bundle complexity to extract package discounts, compressing margins. Seamless apps and real-time monitoring allowed providers to charge premiums—Sunrun-scale competitors reported ~20% higher ARPU on integrated installs in 2024.
Price-sensitive homeowners push for lower solar bids as 30% ITC and ~9 yrs payback temper demand
Price-sensitive homeowners (US avg 16¢/kWh in 2024) push for lower quotes; 30-yr rates ~7% raise monthly costs and bargaining leverage. ITC 30% through 2032 and median payback ~9 years temper demands, while >50% of shoppers solicit multiple bids, intensifying price pressure. Demand for solar+storage/EV adds ticket size but buyers extract bundle discounts, compressing margins.
| Metric | 2024 |
|---|---|
| Utility rate | 16¢/kWh |
| 30-yr rate | ~7% |
| Median payback | ~9 yrs |
| Multi-bid shoppers | >50% |
| ITC | 30% |
| ARPU premium (bundles) | ~20% |
Preview Before You Purchase
Sunrun Porter's Five Forces Analysis
This preview shows the exact Sunrun Porter's Five Forces Analysis you'll receive immediately after purchase—no placeholders or mockups. The document displayed is the complete, professionally formatted analysis ready for download and use the moment you buy. You're looking at the final deliverable; once payment is complete, you'll have instant access to this identical file.
Original: $10.00
-65%$10.00
$3.50Description
A Must-Have Tool for Decision-Makers
Sunrun faces intense rivalry from national installers and utilities, rising buyer price sensitivity, and supplier constraints on panels and batteries that shape margins and growth prospects; regulatory shifts and technology adoption also alter entry barriers and substitute threats. This snapshot highlights key pressure points and strategic levers for Sunrun's competitive positioning. Unlock the full Porter's Five Forces Analysis to access detailed force ratings, visuals, and actionable recommendations.
Suppliers Bargaining Power
Concentrated module and battery vendors
Sunrun depends on a limited set of Tier-1 PV and battery suppliers, exposing it to vendor pricing and allocation leverage; the top five global solar module makers held roughly 70% of shipments in 2023. Brand-specific storage and integrated ecosystems increase switching frictions and installation complexity. Supplier prioritization during tight cycles has compressed delivery windows and reduced project throughput. Long-term contracts reduce but do not remove concentration risk.
Polysilicon and component price volatility
Upstream commodity swings—polysilicon, cells and inverters—have driven price volatility (polysilicon rose over 200% in 2020–2022) that pressures Sunrun margins and short-term quote validity. Suppliers can pass surcharges or change lead times, and although hedging and diversified sourcing mitigate risk, sudden spikes still strain unit economics. Reversals in cost declines, such as a ~20% module ASP drop in 2023, complicate fixed pricing to homeowners.
Skilled labor and EPC subcontractors
Installation crews and specialized electricians are scarce in hot U.S. markets, increasing EPC subcontractor leverage and pushing labor costs; construction wages rose about 4.5% YoY in 2023–24 (BLS), eroding project margins when overtime premiums apply. Sunrun’s in-house crew buildout and training pipelines lower exposure but require quarters to scale, while scheduling conflicts can push revenue recognition into later quarters.
Interconnection hardware and permitting dependencies
Interconnection hardware and AHJ/utility permitting create recurring bottlenecks for Sunrun: balance-of-system items (inverters, racking, meters) face multi-week lead times as of 2024, letting suppliers exert pricing power or stricter terms on constrained SKUs; resulting delays raise carrying costs and cancellation risk; standardization and multi-vendor approvals materially cut single‑point supplier exposure.
- Supplier leverage on constrained SKUs
- Multi-week lead times (2024)
- Higher carrying costs and cancellations
- Standardization, multi-vendor approvals reduce risk
Capital providers and tax equity
Tax equity, debt facilities and ABS investors are core financial suppliers for Sunrun leases/PPAs; shifts in the fed funds rate (5.25–5.50% in late 2024) and investor risk appetite directly raise financing costs and tighten covenants. Limited tax equity supply in 2024 increased financiers’ pricing power, while Sunrun’s scale and performance data improve but do not fully neutralize that leverage.
- Tax equity scarcity → higher pricing
- Rate environment (5.25–5.50% late 2024) ↑ cost of capital
- Scale/performance help negotiating leverage but remain partial
Concentrated module supply (~70%), polysilicon > 200%, ASPs -20%, wages +4.5%, fed 5.25–5.50%
Sunrun faces concentrated supplier power: top five module makers ~70% of 2023 shipments, polysilicon surged >200% (2020–22) and module ASPs fell ~20% in 2023, creating margin volatility. Labor and EPC scarcity (construction wages +4.5% YoY 2023–24) and multi‑week lead times (2024) increase supplier leverage; long‑term contracts and in‑house crews partially mitigate. Tax equity scarcity and a 5.25–5.50% fed funds range (late 2024) raise financing costs.
| Metric | Value |
|---|---|
| Top-5 module share (2023) | ~70% |
| Polysilicon move (2020–22) | +>200% |
| Module ASP change (2023) | ≈-20% |
| Construction wages YoY (2023–24) | +4.5% |
| Fed funds (late 2024) | 5.25–5.50% |
What is included in the product
Detailed Word Document
Tailored Porter’s Five Forces analysis for Sunrun that uncovers competitive intensity, buyer and supplier power, substitute threats, and entry barriers, highlighting disruptive risks and strategic levers for investors and managers.
Customizable Excel Spreadsheet
A clear, one-sheet summary of all five forces for Sunrun—perfect for quick decision-making and reducing analysis paralysis.
Customers Bargaining Power
Price-sensitive homeowners
Price-sensitive homeowners weigh lifetime savings versus utility bills (US average ~16¢/kWh in 2024), squeezing Sunrun on quotes and concessions. Elevated borrowing costs — 30-year rates near 7% in 2024 — raise monthly payments and heighten pushback. Clear incentives like the 30% ITC (IRA through 2032) and state rebates materially affect willingness to pay. Transparent payback math (median residential solar payback ~9 years) gives buyers credible negotiation footing.
Many alternatives and easy comparison
Competing national and local installers generate multiple bids for homeowners, and in 2024 over 50% of U.S. residential solar shoppers solicited at least two quotes, intensifying price competition. Online marketplaces and community referrals make side-by-side comparisons routine, pressuring margins and forcing stronger value propositions. Differentiation through extended warranties, maintenance plans and superior service has become crucial to win customers.
Contract terms and cancellation leverage
Buyers scrutinize escalators, transferability, and early termination clauses, and perceived lock-in can stall closes unless terms allow flexibility. Cooling-off periods and contingent financing give customers walkaway power, driving demand for transparent cancellation fees; Sunrun's scale after the $3.2 billion Vivint Solar acquisition increases visibility of such clauses. Clear, consumer-friendly contracts reduce friction and renegotiation.
Regional policy and utility rate influence
- Impact: NEM 3.0 cut export credits vs retail, lowering ROI
- Incentives: ITC 30% through 2032
- Buyer leverage: higher in weak-NEM regions
- Sales focus: quantify bill savings to overcome resistance
Demand for bundled solutions
Customers increasingly demand solar+storage, EV charging and energy-management integration; in 2024 bundled offers raised average ticket sizes while driving stronger expectations for uptime and performance guarantees. Buyers leverage bundle complexity to extract package discounts, compressing margins. Seamless apps and real-time monitoring allowed providers to charge premiums—Sunrun-scale competitors reported ~20% higher ARPU on integrated installs in 2024.
Price-sensitive homeowners push for lower solar bids as 30% ITC and ~9 yrs payback temper demand
Price-sensitive homeowners (US avg 16¢/kWh in 2024) push for lower quotes; 30-yr rates ~7% raise monthly costs and bargaining leverage. ITC 30% through 2032 and median payback ~9 years temper demands, while >50% of shoppers solicit multiple bids, intensifying price pressure. Demand for solar+storage/EV adds ticket size but buyers extract bundle discounts, compressing margins.
| Metric | 2024 |
|---|---|
| Utility rate | 16¢/kWh |
| 30-yr rate | ~7% |
| Median payback | ~9 yrs |
| Multi-bid shoppers | >50% |
| ITC | 30% |
| ARPU premium (bundles) | ~20% |
Preview Before You Purchase
Sunrun Porter's Five Forces Analysis
This preview shows the exact Sunrun Porter's Five Forces Analysis you'll receive immediately after purchase—no placeholders or mockups. The document displayed is the complete, professionally formatted analysis ready for download and use the moment you buy. You're looking at the final deliverable; once payment is complete, you'll have instant access to this identical file.











