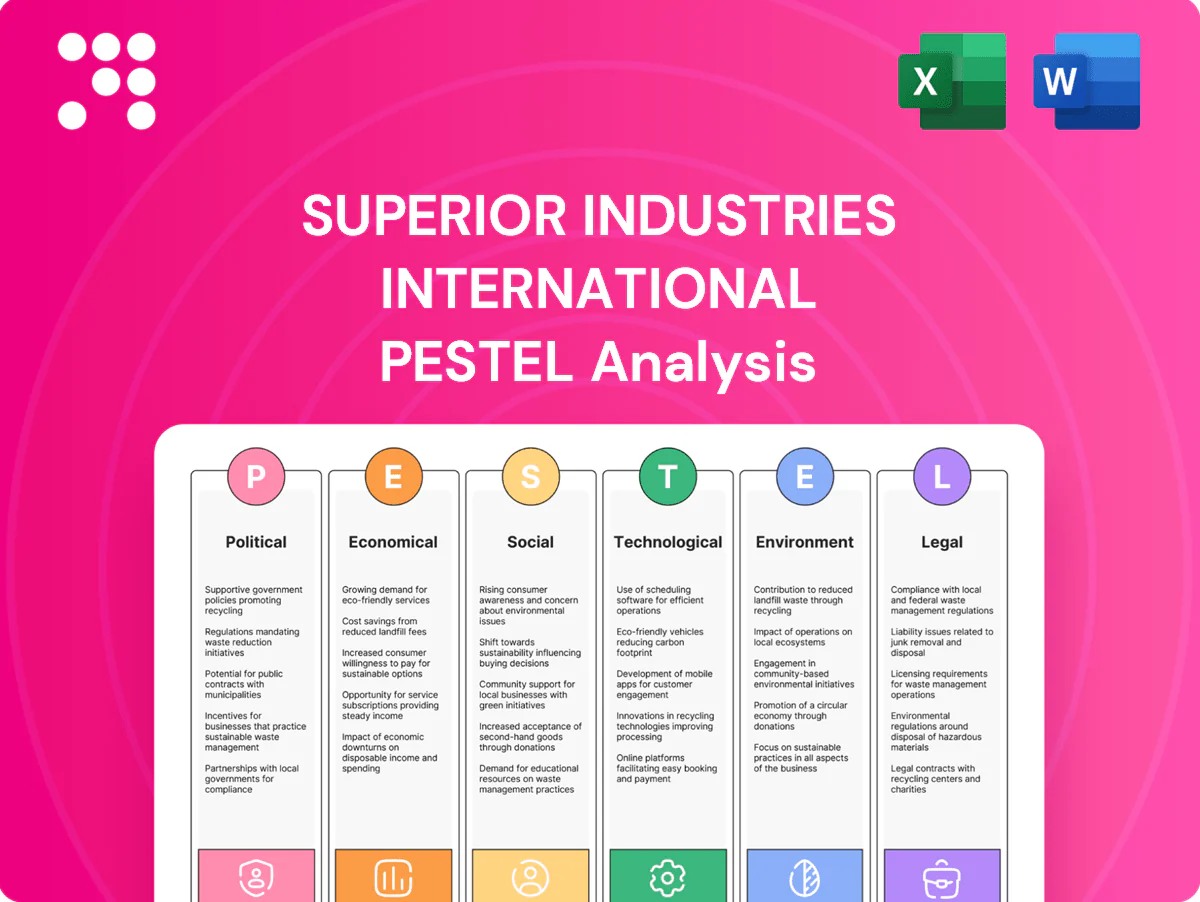
Superior Industries International PESTLE Analysis

Plan Smarter. Present Sharper. Compete Stronger.
Unlock strategic clarity with our PESTLE analysis of Superior Industries International—three to five concise insights into political, economic, social, technological, legal, and environmental forces shaping its outlook. Perfect for investors and strategists, this report reveals risks and growth levers you can act on now. Purchase the full analysis for detailed, ready-to-use intelligence and downloadable templates.
Political factors

Trade policy and tariffs
Aluminum tariffs, quotas and anti-dumping duties, including the US Section 232 10% tariff in force since 2018, directly raise input costs and constrain sourcing flexibility for Superior Industries. Shifts in U.S., EU or partner-country trade stances can reshape supply chains and margins; LME aluminum averaged about $2,400/ton in mid-2024, so a 10% duty adds roughly $240/ton. Monitoring USMCA, EU trade remedies and China-related measures is critical for price stability.
Industrial policy and incentives
US industrial policy—notably the Inflation Reduction Act's roughly $369 billion energy and climate investment and EV tax credits up to $7,500—reshapes OEM production footprints, encouraging EV-capable suppliers and reshoring. Subsidies and localized tax credits materially catalyze regional capacity decisions for wheel plants by improving ROI timelines. Access to DOE and state grants for automation and energy-efficiency projects further lowers unit costs and boosts competitiveness.

Geopolitical risk and energy security
European energy policy shifts and geopolitical tensions (EU Russian gas imports fell to below 10% by 2024) threaten power prices critical for smelting and casting; electricity can account for 30–40% of primary aluminum production costs. Conflict-driven logistics bottlenecks have historically extended lead times and raised freight costs, straining just-in-time OEM supply. Scenario planning for energy disruptions preserves delivery reliability to OEMs.

Public procurement and standards alignment
Alignment with regional standards such as the EU Green Deal and CSRD drives OEM sourcing, with public procurement representing about 14% of EU GDP (Eurostat) and steering demand toward compliant suppliers; the EU target of at least 55% GHG reduction by 2030 increases pressure to adopt low-carbon materials. Government-backed standards and procurement criteria accelerate market uptake of sustainable components, improving time-to-contract for early adopters and positioning compliant firms as preferred suppliers for public-influenced fleets.
- Public procurement ≈ 14% of EU GDP (Eurostat)
- EU 2030 GHG reduction target ≥ 55%
- CSRD expands sustainability reporting from 2024–2025
Regulatory stability and permitting
Local permitting for expansions can be time-consuming and politically sensitive; U.S. industrial permits commonly take 6–18 months, raising capex timing risk for Superior Industries. Stable policy environments reduce project delays and capex uncertainty. Strong municipal relationships ease environmental approvals for foundry operations, lowering operational disruption risk.
- Permitting timeline: 6–18 months
- Capex risk: elevated without policy stability
- Mitigation: strong municipal relations for faster approvals
Tariffs, subsidies and energy costs reshape aluminum sourcing; permitting delays capex
Political risks—trade measures (US Section 232 10%) and tariffs raise input costs and constrain sourcing, while US/EU industrial subsidies (IRA ~$369bn, EV credit up to $7,500) and EU Green Deal (55% GHG cut by 2030) reshape OEM sourcing. Energy/geopolitics drive power costs (electricity 30–40% of smelting cost) and permitting (6–18 months) affects capex timing and plant siting.
| Metric | Value |
|---|---|
| Aluminum price (mid‑2024) | $2,400/ton |
| US tariff (Section 232) | 10% |
| IRA budget | $369bn |
| EU GHG target 2030 | ≥55% |
| Permitting | 6–18 months |
What is included in the product
 Detailed Word Document
Explores how Political, Economic, Social, Technological, Environmental, and Legal factors uniquely impact Superior Industries International, using current data and industry trends to identify threats and opportunities. Designed for executives and investors, the analysis offers actionable, forward‑looking insights tailored to the company’s markets and operations.

 Customizable Excel Spreadsheet
A concise, visually segmented PESTLE summary for Superior Industries International that’s easily dropped into presentations, editable for region- or business-line notes, and shareable across teams to streamline strategic planning and external risk discussions.
Economic factors

Auto production cycles
Wheel demand closely follows light-vehicle and commercial-truck builds—global light-vehicle production was about 77 million units in 2024—so OEM inventory normalization and model-mix shifts (US dealer inventories ~3.0 million end-2024) directly alter order volumes; precise forecasting and flexible capacity provide buffers against these cyclical swings.
Aluminum price volatility
LME aluminum volatility—with prices swinging roughly between $2,100 and $2,800/ton across 2024–H1 2025 and North American premiums near $300–$450/ton—directly raises Superior Industries’ cost of goods sold. Hedging programs and pass-through clauses with OEMs dictate how much of those swings the company can capture in margins. Active supplier diversification and spot-contract blends reduce exposure to raw-material shocks.

FX exposure (USD/EUR and others)
Revenues and costs booked across North America and Europe expose Superior Industries to FX risk, notably USD/EUR which traded around 1.10 in mid-2025; currency swings of 5–10% can meaningfully move reported results. The company uses hedging programs and natural currency offsets between EUR-denominated sales and local costs to stabilize earnings. Contract pricing currency and timing of re-pricing can materially affect reported margins when exchange rates shift.

Labor and energy costs
Wage inflation and skilled labor scarcity pushed US average hourly earnings up about 4.1% year-over-year in 2024 (BLS), raising labor-related operating costs for Superior Industries. Electricity and natural gas — Henry Hub averaged roughly $3.52/MMBtu in 2024 (EIA) — are material inputs for casting and heat treatment, directly affecting margins. Efficiency upgrades and long-term energy contracts have been used to hedge volatility and lower unit energy costs.
- Labor: +4.1% avg hourly earnings (2024, BLS)
- Energy: Henry Hub ~$3.52/MMBtu (2024, EIA)
- Mitigation: efficiency CAPEX and fixed-energy contracts
Interest rates and capital access
Higher interest rates — US policy rate near 5.25–5.50% in mid‑2025 — lift costs for equipment, tooling and working capital, squeezing margins on capital‑intensive wheel production and machining projects. Extended OEM payment terms (commonly 60–120 days) increase short‑term liquidity needs across sales cycles, while preserving covenant headroom (lower leverage) is critical to withstand demand downturns.
- Interest rate backdrop: policy rate ~5.25–5.50% (mid‑2025)
- OEM terms: typically 60–120 days
- Impact: higher financing cost for capex and WC
- Mitigation: maintain covenant headroom to preserve access to capital
Tariffs, subsidies and energy costs reshape aluminum sourcing; permitting delays capex
Wheel demand tracks light‑vehicle builds (~77m units in 2024) so OEM inventory/model‑mix swings drive volumes; flexible capacity and forecasting reduce cyclicality. LME aluminum ranged ~2,100–2,800 $/t (2024–H1 2025) with NA premiums ~$300–450/t, while USD/EUR ~1.10 (mid‑2025) and wage inflation +4.1% (2024) plus Henry Hub ~$3.52/MMBtu pressure margins; rates ~5.25–5.50% (mid‑2025) raise capex/WC cost.
| Metric | 2024/ mid‑2025 |
|---|---|
| Light‑vehicle production | ~77m (2024) |
| LME aluminum | $2,100–2,800/t |
| NA premium | $300–450/t |
| USD/EUR | ~1.10 |
| Wage inflation (US) | +4.1% (2024) |
| Henry Hub | $3.52/MMBtu (2024) |
| Policy rate (US) | ~5.25–5.50% (mid‑2025) |
| OEM terms | 60–120 days |
Same Document Delivered
Superior Industries International PESTLE Analysis
This preview of the Superior Industries International PESTLE Analysis is the exact, fully formatted document you’ll receive after purchase. No placeholders or teasers—what you see is the final, ready-to-use file. It’s delivered exactly as shown, professionally structured and available for immediate download.

Plan Smarter. Present Sharper. Compete Stronger.
Unlock strategic clarity with our PESTLE analysis of Superior Industries International—three to five concise insights into political, economic, social, technological, legal, and environmental forces shaping its outlook. Perfect for investors and strategists, this report reveals risks and growth levers you can act on now. Purchase the full analysis for detailed, ready-to-use intelligence and downloadable templates.
Political factors
Trade policy and tariffs
Aluminum tariffs, quotas and anti-dumping duties, including the US Section 232 10% tariff in force since 2018, directly raise input costs and constrain sourcing flexibility for Superior Industries. Shifts in U.S., EU or partner-country trade stances can reshape supply chains and margins; LME aluminum averaged about $2,400/ton in mid-2024, so a 10% duty adds roughly $240/ton. Monitoring USMCA, EU trade remedies and China-related measures is critical for price stability.
Industrial policy and incentives
US industrial policy—notably the Inflation Reduction Act's roughly $369 billion energy and climate investment and EV tax credits up to $7,500—reshapes OEM production footprints, encouraging EV-capable suppliers and reshoring. Subsidies and localized tax credits materially catalyze regional capacity decisions for wheel plants by improving ROI timelines. Access to DOE and state grants for automation and energy-efficiency projects further lowers unit costs and boosts competitiveness.
Geopolitical risk and energy security
European energy policy shifts and geopolitical tensions (EU Russian gas imports fell to below 10% by 2024) threaten power prices critical for smelting and casting; electricity can account for 30–40% of primary aluminum production costs. Conflict-driven logistics bottlenecks have historically extended lead times and raised freight costs, straining just-in-time OEM supply. Scenario planning for energy disruptions preserves delivery reliability to OEMs.
Public procurement and standards alignment
Alignment with regional standards such as the EU Green Deal and CSRD drives OEM sourcing, with public procurement representing about 14% of EU GDP (Eurostat) and steering demand toward compliant suppliers; the EU target of at least 55% GHG reduction by 2030 increases pressure to adopt low-carbon materials. Government-backed standards and procurement criteria accelerate market uptake of sustainable components, improving time-to-contract for early adopters and positioning compliant firms as preferred suppliers for public-influenced fleets.
- Public procurement ≈ 14% of EU GDP (Eurostat)
- EU 2030 GHG reduction target ≥ 55%
- CSRD expands sustainability reporting from 2024–2025
Regulatory stability and permitting
Local permitting for expansions can be time-consuming and politically sensitive; U.S. industrial permits commonly take 6–18 months, raising capex timing risk for Superior Industries. Stable policy environments reduce project delays and capex uncertainty. Strong municipal relationships ease environmental approvals for foundry operations, lowering operational disruption risk.
- Permitting timeline: 6–18 months
- Capex risk: elevated without policy stability
- Mitigation: strong municipal relations for faster approvals
Tariffs, subsidies and energy costs reshape aluminum sourcing; permitting delays capex
Political risks—trade measures (US Section 232 10%) and tariffs raise input costs and constrain sourcing, while US/EU industrial subsidies (IRA ~$369bn, EV credit up to $7,500) and EU Green Deal (55% GHG cut by 2030) reshape OEM sourcing. Energy/geopolitics drive power costs (electricity 30–40% of smelting cost) and permitting (6–18 months) affects capex timing and plant siting.
| Metric | Value |
|---|---|
| Aluminum price (mid‑2024) | $2,400/ton |
| US tariff (Section 232) | 10% |
| IRA budget | $369bn |
| EU GHG target 2030 | ≥55% |
| Permitting | 6–18 months |
What is included in the product
Detailed Word Document
Explores how Political, Economic, Social, Technological, Environmental, and Legal factors uniquely impact Superior Industries International, using current data and industry trends to identify threats and opportunities. Designed for executives and investors, the analysis offers actionable, forward‑looking insights tailored to the company’s markets and operations.
Customizable Excel Spreadsheet
A concise, visually segmented PESTLE summary for Superior Industries International that’s easily dropped into presentations, editable for region- or business-line notes, and shareable across teams to streamline strategic planning and external risk discussions.
Economic factors
Auto production cycles
Wheel demand closely follows light-vehicle and commercial-truck builds—global light-vehicle production was about 77 million units in 2024—so OEM inventory normalization and model-mix shifts (US dealer inventories ~3.0 million end-2024) directly alter order volumes; precise forecasting and flexible capacity provide buffers against these cyclical swings.
Aluminum price volatility
LME aluminum volatility—with prices swinging roughly between $2,100 and $2,800/ton across 2024–H1 2025 and North American premiums near $300–$450/ton—directly raises Superior Industries’ cost of goods sold. Hedging programs and pass-through clauses with OEMs dictate how much of those swings the company can capture in margins. Active supplier diversification and spot-contract blends reduce exposure to raw-material shocks.
FX exposure (USD/EUR and others)
Revenues and costs booked across North America and Europe expose Superior Industries to FX risk, notably USD/EUR which traded around 1.10 in mid-2025; currency swings of 5–10% can meaningfully move reported results. The company uses hedging programs and natural currency offsets between EUR-denominated sales and local costs to stabilize earnings. Contract pricing currency and timing of re-pricing can materially affect reported margins when exchange rates shift.
Labor and energy costs
Wage inflation and skilled labor scarcity pushed US average hourly earnings up about 4.1% year-over-year in 2024 (BLS), raising labor-related operating costs for Superior Industries. Electricity and natural gas — Henry Hub averaged roughly $3.52/MMBtu in 2024 (EIA) — are material inputs for casting and heat treatment, directly affecting margins. Efficiency upgrades and long-term energy contracts have been used to hedge volatility and lower unit energy costs.
- Labor: +4.1% avg hourly earnings (2024, BLS)
- Energy: Henry Hub ~$3.52/MMBtu (2024, EIA)
- Mitigation: efficiency CAPEX and fixed-energy contracts
Interest rates and capital access
Higher interest rates — US policy rate near 5.25–5.50% in mid‑2025 — lift costs for equipment, tooling and working capital, squeezing margins on capital‑intensive wheel production and machining projects. Extended OEM payment terms (commonly 60–120 days) increase short‑term liquidity needs across sales cycles, while preserving covenant headroom (lower leverage) is critical to withstand demand downturns.
- Interest rate backdrop: policy rate ~5.25–5.50% (mid‑2025)
- OEM terms: typically 60–120 days
- Impact: higher financing cost for capex and WC
- Mitigation: maintain covenant headroom to preserve access to capital
Tariffs, subsidies and energy costs reshape aluminum sourcing; permitting delays capex
Wheel demand tracks light‑vehicle builds (~77m units in 2024) so OEM inventory/model‑mix swings drive volumes; flexible capacity and forecasting reduce cyclicality. LME aluminum ranged ~2,100–2,800 $/t (2024–H1 2025) with NA premiums ~$300–450/t, while USD/EUR ~1.10 (mid‑2025) and wage inflation +4.1% (2024) plus Henry Hub ~$3.52/MMBtu pressure margins; rates ~5.25–5.50% (mid‑2025) raise capex/WC cost.
| Metric | 2024/ mid‑2025 |
|---|---|
| Light‑vehicle production | ~77m (2024) |
| LME aluminum | $2,100–2,800/t |
| NA premium | $300–450/t |
| USD/EUR | ~1.10 |
| Wage inflation (US) | +4.1% (2024) |
| Henry Hub | $3.52/MMBtu (2024) |
| Policy rate (US) | ~5.25–5.50% (mid‑2025) |
| OEM terms | 60–120 days |
Same Document Delivered
Superior Industries International PESTLE Analysis
This preview of the Superior Industries International PESTLE Analysis is the exact, fully formatted document you’ll receive after purchase. No placeholders or teasers—what you see is the final, ready-to-use file. It’s delivered exactly as shown, professionally structured and available for immediate download.
Description
Plan Smarter. Present Sharper. Compete Stronger.
Unlock strategic clarity with our PESTLE analysis of Superior Industries International—three to five concise insights into political, economic, social, technological, legal, and environmental forces shaping its outlook. Perfect for investors and strategists, this report reveals risks and growth levers you can act on now. Purchase the full analysis for detailed, ready-to-use intelligence and downloadable templates.
Political factors
Trade policy and tariffs
Aluminum tariffs, quotas and anti-dumping duties, including the US Section 232 10% tariff in force since 2018, directly raise input costs and constrain sourcing flexibility for Superior Industries. Shifts in U.S., EU or partner-country trade stances can reshape supply chains and margins; LME aluminum averaged about $2,400/ton in mid-2024, so a 10% duty adds roughly $240/ton. Monitoring USMCA, EU trade remedies and China-related measures is critical for price stability.
Industrial policy and incentives
US industrial policy—notably the Inflation Reduction Act's roughly $369 billion energy and climate investment and EV tax credits up to $7,500—reshapes OEM production footprints, encouraging EV-capable suppliers and reshoring. Subsidies and localized tax credits materially catalyze regional capacity decisions for wheel plants by improving ROI timelines. Access to DOE and state grants for automation and energy-efficiency projects further lowers unit costs and boosts competitiveness.
Geopolitical risk and energy security
European energy policy shifts and geopolitical tensions (EU Russian gas imports fell to below 10% by 2024) threaten power prices critical for smelting and casting; electricity can account for 30–40% of primary aluminum production costs. Conflict-driven logistics bottlenecks have historically extended lead times and raised freight costs, straining just-in-time OEM supply. Scenario planning for energy disruptions preserves delivery reliability to OEMs.
Public procurement and standards alignment
Alignment with regional standards such as the EU Green Deal and CSRD drives OEM sourcing, with public procurement representing about 14% of EU GDP (Eurostat) and steering demand toward compliant suppliers; the EU target of at least 55% GHG reduction by 2030 increases pressure to adopt low-carbon materials. Government-backed standards and procurement criteria accelerate market uptake of sustainable components, improving time-to-contract for early adopters and positioning compliant firms as preferred suppliers for public-influenced fleets.
- Public procurement ≈ 14% of EU GDP (Eurostat)
- EU 2030 GHG reduction target ≥ 55%
- CSRD expands sustainability reporting from 2024–2025
Regulatory stability and permitting
Local permitting for expansions can be time-consuming and politically sensitive; U.S. industrial permits commonly take 6–18 months, raising capex timing risk for Superior Industries. Stable policy environments reduce project delays and capex uncertainty. Strong municipal relationships ease environmental approvals for foundry operations, lowering operational disruption risk.
- Permitting timeline: 6–18 months
- Capex risk: elevated without policy stability
- Mitigation: strong municipal relations for faster approvals
Tariffs, subsidies and energy costs reshape aluminum sourcing; permitting delays capex
Political risks—trade measures (US Section 232 10%) and tariffs raise input costs and constrain sourcing, while US/EU industrial subsidies (IRA ~$369bn, EV credit up to $7,500) and EU Green Deal (55% GHG cut by 2030) reshape OEM sourcing. Energy/geopolitics drive power costs (electricity 30–40% of smelting cost) and permitting (6–18 months) affects capex timing and plant siting.
| Metric | Value |
|---|---|
| Aluminum price (mid‑2024) | $2,400/ton |
| US tariff (Section 232) | 10% |
| IRA budget | $369bn |
| EU GHG target 2030 | ≥55% |
| Permitting | 6–18 months |
What is included in the product
Detailed Word Document
Explores how Political, Economic, Social, Technological, Environmental, and Legal factors uniquely impact Superior Industries International, using current data and industry trends to identify threats and opportunities. Designed for executives and investors, the analysis offers actionable, forward‑looking insights tailored to the company’s markets and operations.
Customizable Excel Spreadsheet
A concise, visually segmented PESTLE summary for Superior Industries International that’s easily dropped into presentations, editable for region- or business-line notes, and shareable across teams to streamline strategic planning and external risk discussions.
Economic factors
Auto production cycles
Wheel demand closely follows light-vehicle and commercial-truck builds—global light-vehicle production was about 77 million units in 2024—so OEM inventory normalization and model-mix shifts (US dealer inventories ~3.0 million end-2024) directly alter order volumes; precise forecasting and flexible capacity provide buffers against these cyclical swings.
Aluminum price volatility
LME aluminum volatility—with prices swinging roughly between $2,100 and $2,800/ton across 2024–H1 2025 and North American premiums near $300–$450/ton—directly raises Superior Industries’ cost of goods sold. Hedging programs and pass-through clauses with OEMs dictate how much of those swings the company can capture in margins. Active supplier diversification and spot-contract blends reduce exposure to raw-material shocks.
FX exposure (USD/EUR and others)
Revenues and costs booked across North America and Europe expose Superior Industries to FX risk, notably USD/EUR which traded around 1.10 in mid-2025; currency swings of 5–10% can meaningfully move reported results. The company uses hedging programs and natural currency offsets between EUR-denominated sales and local costs to stabilize earnings. Contract pricing currency and timing of re-pricing can materially affect reported margins when exchange rates shift.
Labor and energy costs
Wage inflation and skilled labor scarcity pushed US average hourly earnings up about 4.1% year-over-year in 2024 (BLS), raising labor-related operating costs for Superior Industries. Electricity and natural gas — Henry Hub averaged roughly $3.52/MMBtu in 2024 (EIA) — are material inputs for casting and heat treatment, directly affecting margins. Efficiency upgrades and long-term energy contracts have been used to hedge volatility and lower unit energy costs.
- Labor: +4.1% avg hourly earnings (2024, BLS)
- Energy: Henry Hub ~$3.52/MMBtu (2024, EIA)
- Mitigation: efficiency CAPEX and fixed-energy contracts
Interest rates and capital access
Higher interest rates — US policy rate near 5.25–5.50% in mid‑2025 — lift costs for equipment, tooling and working capital, squeezing margins on capital‑intensive wheel production and machining projects. Extended OEM payment terms (commonly 60–120 days) increase short‑term liquidity needs across sales cycles, while preserving covenant headroom (lower leverage) is critical to withstand demand downturns.
- Interest rate backdrop: policy rate ~5.25–5.50% (mid‑2025)
- OEM terms: typically 60–120 days
- Impact: higher financing cost for capex and WC
- Mitigation: maintain covenant headroom to preserve access to capital
Tariffs, subsidies and energy costs reshape aluminum sourcing; permitting delays capex
Wheel demand tracks light‑vehicle builds (~77m units in 2024) so OEM inventory/model‑mix swings drive volumes; flexible capacity and forecasting reduce cyclicality. LME aluminum ranged ~2,100–2,800 $/t (2024–H1 2025) with NA premiums ~$300–450/t, while USD/EUR ~1.10 (mid‑2025) and wage inflation +4.1% (2024) plus Henry Hub ~$3.52/MMBtu pressure margins; rates ~5.25–5.50% (mid‑2025) raise capex/WC cost.
| Metric | 2024/ mid‑2025 |
|---|---|
| Light‑vehicle production | ~77m (2024) |
| LME aluminum | $2,100–2,800/t |
| NA premium | $300–450/t |
| USD/EUR | ~1.10 |
| Wage inflation (US) | +4.1% (2024) |
| Henry Hub | $3.52/MMBtu (2024) |
| Policy rate (US) | ~5.25–5.50% (mid‑2025) |
| OEM terms | 60–120 days |
Same Document Delivered
Superior Industries International PESTLE Analysis
This preview of the Superior Industries International PESTLE Analysis is the exact, fully formatted document you’ll receive after purchase. No placeholders or teasers—what you see is the final, ready-to-use file. It’s delivered exactly as shown, professionally structured and available for immediate download.











