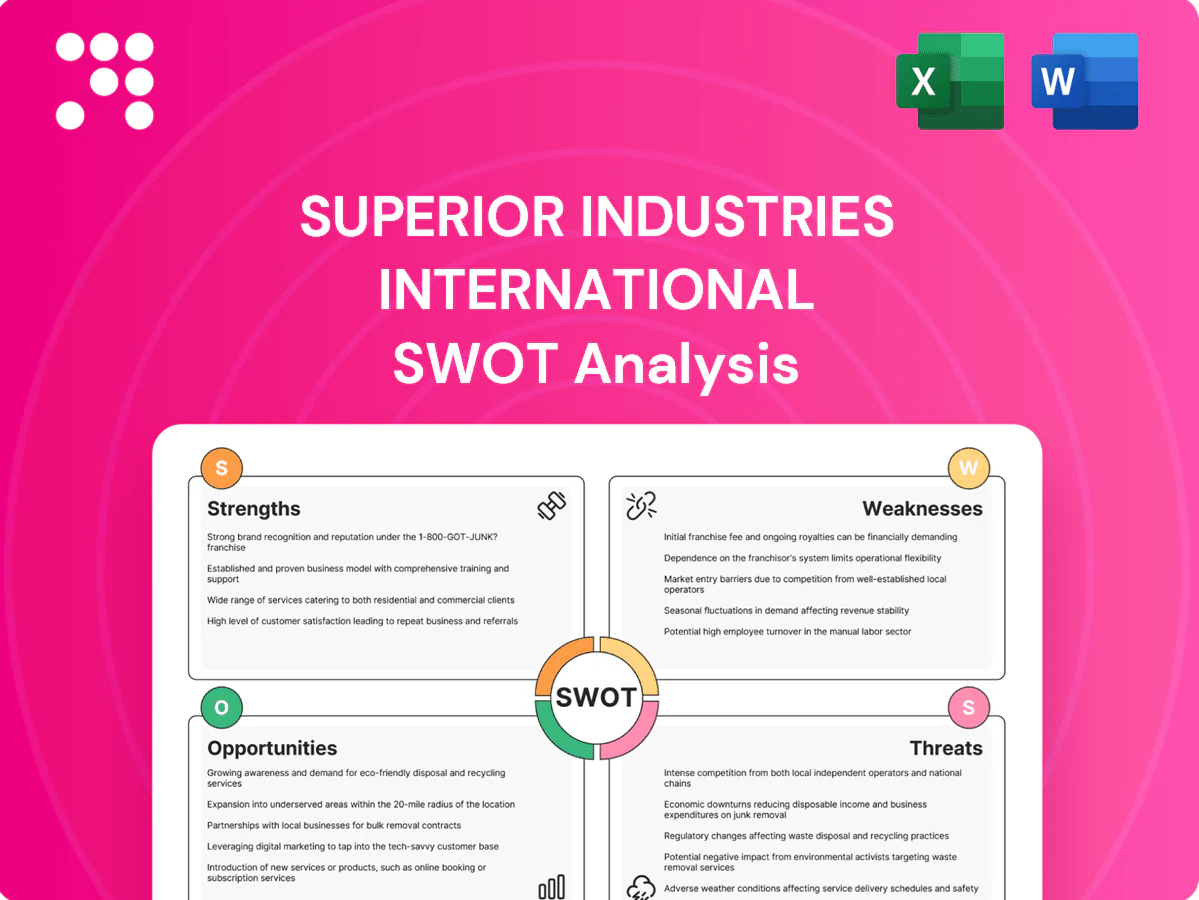
Superior Industries International SWOT Analysis

Go Beyond the Preview—Access the Full Strategic Report
Superior Industries International’s SWOT highlights strong engineering capabilities and OEM relationships, exposure to cyclical auto markets and raw‑material volatility, and growth potential from EV wheel demand; the full SWOT delivers research‑backed insights, strategic implications, and editable Word/Excel files—purchase the complete report to plan, pitch, or invest with confidence.
Strengths

Deep OEM relationships
Multi-year supply programs (typically 3–5 years) with major North American and European automakers provide Superior Industries with stable volumes and revenue visibility. Early design-in at vehicle platform level embeds engineering collaboration and raises switching costs for OEMs. Established APQP/PPAP disciplines and a strong quality track record support preferred-supplier status and help capture high carryover rates across model refreshes.
Engineering and testing prowess
In-house design, FEA, validation and proving capabilities let Superior optimize strength-to-weight and shorten time-to-market, enabling compliance with stringent OEM and regional homologation requirements to reduce launch risk. Co-development supports bespoke styling and performance for premium trims, and this engineering credibility differentiates Superior from lower-tier foundries in meeting complex OEM specifications.

Scale in aluminum wheel manufacturing
Superior Industries' high-volume casting and forging capacity delivers significant cost leverage on procurement, tooling, and overhead, enabling lower per-piece costs versus smaller producers. Standardized processes and automation have improved yield and reduced scrap across plants, supporting consistent quality. The scale underpins a broad SKU range for both light vehicles and commercial trucks and permits flexible load balancing across the manufacturing footprint.

North America–Europe footprint
North America–Europe footprint shortens lead times and logistics costs by locating near OEM assembly hubs, supporting responsiveness during the 2024 North American light-vehicle production cycle (~10.9 million units) and European production recovery. Dual-continent presence smooths demand volatility and regulatory exposure across differing cycles. Local content enables qualification under USMCA (75% regional content for autos) and similar trade benefits, aiding global platform awards.
- Proximity cuts transit and inventory days
- Diversifies demand/regulatory risk across NA/EU
- Enables USMCA 75% local-content advantages
- Supports eligibility for global OEM platform awards
Lightweighting alignment
Aluminum wheels reduce unsprung mass, improving fuel economy and EV range—industry studies indicate up to 3% range gain in real-world EVs—driving OEM demand for lightweight, styled, aero-optimized rims. With EVs at about 18% of global new-car sales in 2024, specs shifted toward larger 17–22 inch wheels and higher-value alloys. This trend supports pricing power and higher content-per-vehicle for Superior Industries.
- Range gain up to 3% from lightweighting
- EV share ~18% of new-car sales in 2024
- Spec shift to 17–22in higher-value wheels boosts ASPs
Lightweight aluminum wheels: EV-driven content lift, up to 3% range gain
Multi-year OEM programs, in-house engineering/FEA and high-volume casting/forging provide stable revenue, lower per-piece cost and high carryover rates; NA/EU footprint reduces lead times and qualifies for USMCA benefits. Lightweight aluminum wheels capture EV-driven demand (EVs ~18% of 2024 sales), boosting ASPs and content-per-vehicle and offering up to ~3% EV range gain.
| Metric | Value |
|---|---|
| NA light-vehicle prod. (2024) | ~10.9M units |
| EV share (2024) | ~18% |
| Range gain (lightweight wheels) | up to 3% |
| USMCA regional content | 75% |
What is included in the product
 Detailed Word Document
Delivers a strategic overview of Superior Industries International’s internal and external business factors, outlining strengths, weaknesses, opportunities, and threats that shape its competitive position and growth prospects.

 Customizable Excel Spreadsheet
Provides a focused SWOT snapshot of Superior Industries International for rapid strategy alignment and stakeholder-ready summaries.
Weaknesses

Auto-cycle sensitivity
Auto-cycle sensitivity: Superior’s revenue tracks OEM volumes and platform mix, both highly cyclical—US light‑vehicle production plunged about 20% in 2020 and recovered to roughly 11 million units in 2023, so downturns, strikes or inventory corrections quickly cut orders; high fixed costs compress margins at low utilization, and recovery timing depends on OEM scheduling beyond Superior’s control.
Customer concentration
A handful of large OEM customers account for a majority of Superior Industries International’s revenue, making the company highly exposed to the loss of a platform award or aggressive price-downs that can materially dent quarterly results. Contract renewals often create sharp swings in volume and margin, and this dependence reduces bargaining leverage during annual negotiations, leaving margins vulnerable to OEM-driven pricing and volume shifts.

Commodity and energy exposure
Superior Industries faces raw-material cost volatility as aluminum ingot/billet and alloying elements—with LME primary aluminum averaging about $2,400/ton in 2024—increasing input price swings that compress margins.
Its energy‑intensive melting and heat‑treat processes make margins sensitive to electricity and natural gas moves, with industrial power costs in the US averaging near $0.09–0.12/kWh in 2024.
Indexing and pass‑through clauses often lag or fail to cover full exposure, and while hedging programs reduce price risk, they do not eliminate residual margin volatility.

Capital intensity
Foundry and forging lines at Superior Industries demand steady capex for tooling, automation upgrades and environmental compliance, and new platform awards require significant upfront investment before revenue ramps, pressuring short-term liquidity. High depreciation and amortization materially burden earnings and free cash flow in down cycles, constraining balance-sheet flexibility.
- Capex-intensive manufacturing
- Upfront spend for new platforms
- High D&A reduces FCF
- Limits on balance-sheet agility
FX and European cost risks
EUR/USD (~1.09) and MXN/USD (~17.5) moves in mid‑2025 materially affect Superior Industries’ reported revenues and cost competitiveness; European labor and energy inflation in 2022–24 frequently outpaced price pass‑through. Currency mismatches between input purchases and sales increase margin volatility, and hedging programs only partially offset translation and transaction impacts.
- FX exposure: EUR/USD, MXN/USD
- Cost squeeze: European labor & energy inflation
- Mismatch: input vs sales currency
- Hedging: partial mitigation only
OEM cycles, aluminum and energy volatility drive sharp margin swings
Revenue tied to OEM cycles (US light‑vehicle production ~11.0m units in 2023) and a concentrated customer base (majority of sales from a few OEMs) creates sharp volume and margin swings; high fixed costs, capex and D&A compress earnings in downturns. Raw-materials (LME primary aluminum ~ $2,400/ton in 2024) and energy (US industrial power ~$0.09–0.12/kWh in 2024) volatility plus FX (EUR/USD ~1.09; MXN/USD ~17.5 in 2025) further squeeze margins.
| Metric | Value/Year |
|---|---|
| US light‑vehicle production | ~11.0m (2023) |
| LME primary aluminum | ~$2,400/ton (2024) |
| US industrial power | $0.09–0.12/kWh (2024) |
| FX | EUR/USD ~1.09; MXN/USD ~17.5 (mid‑2025) |
Same Document Delivered
Superior Industries International SWOT Analysis
This is the actual SWOT analysis document you’ll receive upon purchase—no surprises, just professional quality. The preview below is taken directly from the full SWOT report you'll get; purchase unlocks the entire in-depth version. The complete, editable file becomes available immediately after checkout.

Go Beyond the Preview—Access the Full Strategic Report
Superior Industries International’s SWOT highlights strong engineering capabilities and OEM relationships, exposure to cyclical auto markets and raw‑material volatility, and growth potential from EV wheel demand; the full SWOT delivers research‑backed insights, strategic implications, and editable Word/Excel files—purchase the complete report to plan, pitch, or invest with confidence.
Strengths
Deep OEM relationships
Multi-year supply programs (typically 3–5 years) with major North American and European automakers provide Superior Industries with stable volumes and revenue visibility. Early design-in at vehicle platform level embeds engineering collaboration and raises switching costs for OEMs. Established APQP/PPAP disciplines and a strong quality track record support preferred-supplier status and help capture high carryover rates across model refreshes.
Engineering and testing prowess
In-house design, FEA, validation and proving capabilities let Superior optimize strength-to-weight and shorten time-to-market, enabling compliance with stringent OEM and regional homologation requirements to reduce launch risk. Co-development supports bespoke styling and performance for premium trims, and this engineering credibility differentiates Superior from lower-tier foundries in meeting complex OEM specifications.
Scale in aluminum wheel manufacturing
Superior Industries' high-volume casting and forging capacity delivers significant cost leverage on procurement, tooling, and overhead, enabling lower per-piece costs versus smaller producers. Standardized processes and automation have improved yield and reduced scrap across plants, supporting consistent quality. The scale underpins a broad SKU range for both light vehicles and commercial trucks and permits flexible load balancing across the manufacturing footprint.
North America–Europe footprint
North America–Europe footprint shortens lead times and logistics costs by locating near OEM assembly hubs, supporting responsiveness during the 2024 North American light-vehicle production cycle (~10.9 million units) and European production recovery. Dual-continent presence smooths demand volatility and regulatory exposure across differing cycles. Local content enables qualification under USMCA (75% regional content for autos) and similar trade benefits, aiding global platform awards.
- Proximity cuts transit and inventory days
- Diversifies demand/regulatory risk across NA/EU
- Enables USMCA 75% local-content advantages
- Supports eligibility for global OEM platform awards
Lightweighting alignment
Aluminum wheels reduce unsprung mass, improving fuel economy and EV range—industry studies indicate up to 3% range gain in real-world EVs—driving OEM demand for lightweight, styled, aero-optimized rims. With EVs at about 18% of global new-car sales in 2024, specs shifted toward larger 17–22 inch wheels and higher-value alloys. This trend supports pricing power and higher content-per-vehicle for Superior Industries.
- Range gain up to 3% from lightweighting
- EV share ~18% of new-car sales in 2024
- Spec shift to 17–22in higher-value wheels boosts ASPs
Lightweight aluminum wheels: EV-driven content lift, up to 3% range gain
Multi-year OEM programs, in-house engineering/FEA and high-volume casting/forging provide stable revenue, lower per-piece cost and high carryover rates; NA/EU footprint reduces lead times and qualifies for USMCA benefits. Lightweight aluminum wheels capture EV-driven demand (EVs ~18% of 2024 sales), boosting ASPs and content-per-vehicle and offering up to ~3% EV range gain.
| Metric | Value |
|---|---|
| NA light-vehicle prod. (2024) | ~10.9M units |
| EV share (2024) | ~18% |
| Range gain (lightweight wheels) | up to 3% |
| USMCA regional content | 75% |
What is included in the product
Detailed Word Document
Delivers a strategic overview of Superior Industries International’s internal and external business factors, outlining strengths, weaknesses, opportunities, and threats that shape its competitive position and growth prospects.
Customizable Excel Spreadsheet
Provides a focused SWOT snapshot of Superior Industries International for rapid strategy alignment and stakeholder-ready summaries.
Weaknesses
Auto-cycle sensitivity
Auto-cycle sensitivity: Superior’s revenue tracks OEM volumes and platform mix, both highly cyclical—US light‑vehicle production plunged about 20% in 2020 and recovered to roughly 11 million units in 2023, so downturns, strikes or inventory corrections quickly cut orders; high fixed costs compress margins at low utilization, and recovery timing depends on OEM scheduling beyond Superior’s control.
Customer concentration
A handful of large OEM customers account for a majority of Superior Industries International’s revenue, making the company highly exposed to the loss of a platform award or aggressive price-downs that can materially dent quarterly results. Contract renewals often create sharp swings in volume and margin, and this dependence reduces bargaining leverage during annual negotiations, leaving margins vulnerable to OEM-driven pricing and volume shifts.
Commodity and energy exposure
Superior Industries faces raw-material cost volatility as aluminum ingot/billet and alloying elements—with LME primary aluminum averaging about $2,400/ton in 2024—increasing input price swings that compress margins.
Its energy‑intensive melting and heat‑treat processes make margins sensitive to electricity and natural gas moves, with industrial power costs in the US averaging near $0.09–0.12/kWh in 2024.
Indexing and pass‑through clauses often lag or fail to cover full exposure, and while hedging programs reduce price risk, they do not eliminate residual margin volatility.
Capital intensity
Foundry and forging lines at Superior Industries demand steady capex for tooling, automation upgrades and environmental compliance, and new platform awards require significant upfront investment before revenue ramps, pressuring short-term liquidity. High depreciation and amortization materially burden earnings and free cash flow in down cycles, constraining balance-sheet flexibility.
- Capex-intensive manufacturing
- Upfront spend for new platforms
- High D&A reduces FCF
- Limits on balance-sheet agility
FX and European cost risks
EUR/USD (~1.09) and MXN/USD (~17.5) moves in mid‑2025 materially affect Superior Industries’ reported revenues and cost competitiveness; European labor and energy inflation in 2022–24 frequently outpaced price pass‑through. Currency mismatches between input purchases and sales increase margin volatility, and hedging programs only partially offset translation and transaction impacts.
- FX exposure: EUR/USD, MXN/USD
- Cost squeeze: European labor & energy inflation
- Mismatch: input vs sales currency
- Hedging: partial mitigation only
OEM cycles, aluminum and energy volatility drive sharp margin swings
Revenue tied to OEM cycles (US light‑vehicle production ~11.0m units in 2023) and a concentrated customer base (majority of sales from a few OEMs) creates sharp volume and margin swings; high fixed costs, capex and D&A compress earnings in downturns. Raw-materials (LME primary aluminum ~ $2,400/ton in 2024) and energy (US industrial power ~$0.09–0.12/kWh in 2024) volatility plus FX (EUR/USD ~1.09; MXN/USD ~17.5 in 2025) further squeeze margins.
| Metric | Value/Year |
|---|---|
| US light‑vehicle production | ~11.0m (2023) |
| LME primary aluminum | ~$2,400/ton (2024) |
| US industrial power | $0.09–0.12/kWh (2024) |
| FX | EUR/USD ~1.09; MXN/USD ~17.5 (mid‑2025) |
Same Document Delivered
Superior Industries International SWOT Analysis
This is the actual SWOT analysis document you’ll receive upon purchase—no surprises, just professional quality. The preview below is taken directly from the full SWOT report you'll get; purchase unlocks the entire in-depth version. The complete, editable file becomes available immediately after checkout.
Original: $10.00
-65%$10.00
$3.50Description
Go Beyond the Preview—Access the Full Strategic Report
Superior Industries International’s SWOT highlights strong engineering capabilities and OEM relationships, exposure to cyclical auto markets and raw‑material volatility, and growth potential from EV wheel demand; the full SWOT delivers research‑backed insights, strategic implications, and editable Word/Excel files—purchase the complete report to plan, pitch, or invest with confidence.
Strengths
Deep OEM relationships
Multi-year supply programs (typically 3–5 years) with major North American and European automakers provide Superior Industries with stable volumes and revenue visibility. Early design-in at vehicle platform level embeds engineering collaboration and raises switching costs for OEMs. Established APQP/PPAP disciplines and a strong quality track record support preferred-supplier status and help capture high carryover rates across model refreshes.
Engineering and testing prowess
In-house design, FEA, validation and proving capabilities let Superior optimize strength-to-weight and shorten time-to-market, enabling compliance with stringent OEM and regional homologation requirements to reduce launch risk. Co-development supports bespoke styling and performance for premium trims, and this engineering credibility differentiates Superior from lower-tier foundries in meeting complex OEM specifications.
Scale in aluminum wheel manufacturing
Superior Industries' high-volume casting and forging capacity delivers significant cost leverage on procurement, tooling, and overhead, enabling lower per-piece costs versus smaller producers. Standardized processes and automation have improved yield and reduced scrap across plants, supporting consistent quality. The scale underpins a broad SKU range for both light vehicles and commercial trucks and permits flexible load balancing across the manufacturing footprint.
North America–Europe footprint
North America–Europe footprint shortens lead times and logistics costs by locating near OEM assembly hubs, supporting responsiveness during the 2024 North American light-vehicle production cycle (~10.9 million units) and European production recovery. Dual-continent presence smooths demand volatility and regulatory exposure across differing cycles. Local content enables qualification under USMCA (75% regional content for autos) and similar trade benefits, aiding global platform awards.
- Proximity cuts transit and inventory days
- Diversifies demand/regulatory risk across NA/EU
- Enables USMCA 75% local-content advantages
- Supports eligibility for global OEM platform awards
Lightweighting alignment
Aluminum wheels reduce unsprung mass, improving fuel economy and EV range—industry studies indicate up to 3% range gain in real-world EVs—driving OEM demand for lightweight, styled, aero-optimized rims. With EVs at about 18% of global new-car sales in 2024, specs shifted toward larger 17–22 inch wheels and higher-value alloys. This trend supports pricing power and higher content-per-vehicle for Superior Industries.
- Range gain up to 3% from lightweighting
- EV share ~18% of new-car sales in 2024
- Spec shift to 17–22in higher-value wheels boosts ASPs
Lightweight aluminum wheels: EV-driven content lift, up to 3% range gain
Multi-year OEM programs, in-house engineering/FEA and high-volume casting/forging provide stable revenue, lower per-piece cost and high carryover rates; NA/EU footprint reduces lead times and qualifies for USMCA benefits. Lightweight aluminum wheels capture EV-driven demand (EVs ~18% of 2024 sales), boosting ASPs and content-per-vehicle and offering up to ~3% EV range gain.
| Metric | Value |
|---|---|
| NA light-vehicle prod. (2024) | ~10.9M units |
| EV share (2024) | ~18% |
| Range gain (lightweight wheels) | up to 3% |
| USMCA regional content | 75% |
What is included in the product
Detailed Word Document
Delivers a strategic overview of Superior Industries International’s internal and external business factors, outlining strengths, weaknesses, opportunities, and threats that shape its competitive position and growth prospects.
Customizable Excel Spreadsheet
Provides a focused SWOT snapshot of Superior Industries International for rapid strategy alignment and stakeholder-ready summaries.
Weaknesses
Auto-cycle sensitivity
Auto-cycle sensitivity: Superior’s revenue tracks OEM volumes and platform mix, both highly cyclical—US light‑vehicle production plunged about 20% in 2020 and recovered to roughly 11 million units in 2023, so downturns, strikes or inventory corrections quickly cut orders; high fixed costs compress margins at low utilization, and recovery timing depends on OEM scheduling beyond Superior’s control.
Customer concentration
A handful of large OEM customers account for a majority of Superior Industries International’s revenue, making the company highly exposed to the loss of a platform award or aggressive price-downs that can materially dent quarterly results. Contract renewals often create sharp swings in volume and margin, and this dependence reduces bargaining leverage during annual negotiations, leaving margins vulnerable to OEM-driven pricing and volume shifts.
Commodity and energy exposure
Superior Industries faces raw-material cost volatility as aluminum ingot/billet and alloying elements—with LME primary aluminum averaging about $2,400/ton in 2024—increasing input price swings that compress margins.
Its energy‑intensive melting and heat‑treat processes make margins sensitive to electricity and natural gas moves, with industrial power costs in the US averaging near $0.09–0.12/kWh in 2024.
Indexing and pass‑through clauses often lag or fail to cover full exposure, and while hedging programs reduce price risk, they do not eliminate residual margin volatility.
Capital intensity
Foundry and forging lines at Superior Industries demand steady capex for tooling, automation upgrades and environmental compliance, and new platform awards require significant upfront investment before revenue ramps, pressuring short-term liquidity. High depreciation and amortization materially burden earnings and free cash flow in down cycles, constraining balance-sheet flexibility.
- Capex-intensive manufacturing
- Upfront spend for new platforms
- High D&A reduces FCF
- Limits on balance-sheet agility
FX and European cost risks
EUR/USD (~1.09) and MXN/USD (~17.5) moves in mid‑2025 materially affect Superior Industries’ reported revenues and cost competitiveness; European labor and energy inflation in 2022–24 frequently outpaced price pass‑through. Currency mismatches between input purchases and sales increase margin volatility, and hedging programs only partially offset translation and transaction impacts.
- FX exposure: EUR/USD, MXN/USD
- Cost squeeze: European labor & energy inflation
- Mismatch: input vs sales currency
- Hedging: partial mitigation only
OEM cycles, aluminum and energy volatility drive sharp margin swings
Revenue tied to OEM cycles (US light‑vehicle production ~11.0m units in 2023) and a concentrated customer base (majority of sales from a few OEMs) creates sharp volume and margin swings; high fixed costs, capex and D&A compress earnings in downturns. Raw-materials (LME primary aluminum ~ $2,400/ton in 2024) and energy (US industrial power ~$0.09–0.12/kWh in 2024) volatility plus FX (EUR/USD ~1.09; MXN/USD ~17.5 in 2025) further squeeze margins.
| Metric | Value/Year |
|---|---|
| US light‑vehicle production | ~11.0m (2023) |
| LME primary aluminum | ~$2,400/ton (2024) |
| US industrial power | $0.09–0.12/kWh (2024) |
| FX | EUR/USD ~1.09; MXN/USD ~17.5 (mid‑2025) |
Same Document Delivered
Superior Industries International SWOT Analysis
This is the actual SWOT analysis document you’ll receive upon purchase—no surprises, just professional quality. The preview below is taken directly from the full SWOT report you'll get; purchase unlocks the entire in-depth version. The complete, editable file becomes available immediately after checkout.











