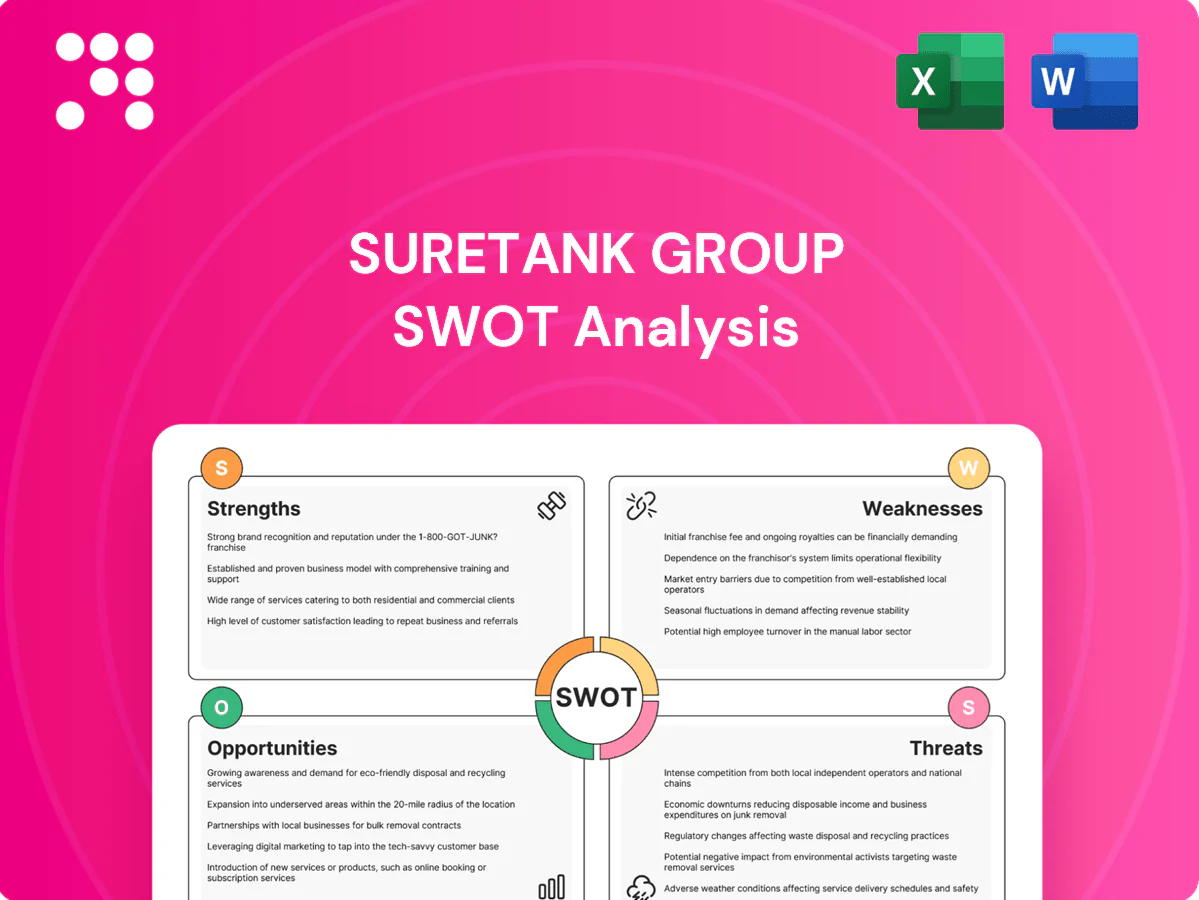
Suretank Group SWOT Analysis

Make Insightful Decisions Backed by Expert Research
Discover how Suretank Group stacks up against competitors with our concise SWOT overview—highlighting core strengths, market risks, and growth levers in 3–5 clear points. Want the full strategic picture? Purchase the complete SWOT for a research-backed, editable Word and Excel package to plan, pitch, or invest with confidence.
Strengths

Deep offshore container expertise
Decades of focused CCU development for offshore use have built hard-to-replicate know-how in Suretank Group; engineering teams deeply understand load dynamics, corrosion and handling risks unique to rigs and vessels, accelerating problem-solving on complex specs and enabling a premium pricing position versus generic fabricators.
Strong certification and compliance track record
Products built to DNV and ISO standards (ISO 9001 recertification cycles typically every three years) reduce procurement friction for global operators. Proven certification pathways lower client risk and make audits predictable, cutting TCO by reducing unplanned compliance costs. This enhances acceptance across majors and service companies that mandate such certifications.

Rugged, reliable designs for harsh environments
Suretank units are engineered to withstand extreme weather, shock, and corrosion, delivering high durability that cuts downtime and replacement frequency in offshore logistics.
Industry data shows corrosion costs the global economy about $2.5 trillion annually (NACE, 2016), underscoring value of robust, corrosion-resistant equipment.
Proven reliability meets HSE-driven procurement criteria, driving repeat orders and longer lifecycle value for operators.

Global applicability across liquids, gases, solids
Suretank Group's portfolio supports liquids, gases and solids across safety classes, enabling buyers to standardize on a single vendor for mixed-material fleets and raising cross‑sell potential as customers expand operations; this breadth provides revenue smoothing through demand shifts between sectors.
- Standardization: single-vendor across media
- Cross-sell: higher lifetime customer value
- Resilience: mix-based revenue stability
Ability to serve adjacent sectors
Specialized container engineering transfers to chemical, pharma, mining and defense, leveraging certified safe storage and transport to enter higher-margin niches; global pharmaceutical sales reached about 1.61 trillion USD in 2024, highlighting scale of adjacent demand.
Diversification buffers oil and gas cyclicality and lets tailored variants extend addressable market without diluting core competence.
- Certified tech repurposed
- Pharma market $1.61T (2024)
- Buffers sector cyclicality
- Higher-margin niches
DNV/ISO CCU: faster specs-to-deploy, lower TCO; corrosion $2.5T
Decades of CCU offshore engineering create hard-to-replicate know-how, enabling premium pricing and faster specs-to-deploy versus generic fabricators. DNV/ISO-certified production (ISO 9001 recert ~3-year cycle) lowers procurement friction and TCO; corrosion-resistant designs cut downtime—relevant given NACE estimate of $2.5T annual corrosion cost. Portfolio spans liquids, gases, solids, supporting cross-sell into $1.61T pharma (2024).
| Metric | Value |
|---|---|
| Certifications | DNV, ISO 9001 |
| ISO recert cycle | ~3 years |
| Corrosion cost (NACE) | $2.5T (2016) |
| Pharma market | $1.61T (2024) |
What is included in the product
 Detailed Word Document
Provides a clear SWOT framework analyzing Suretank Group’s internal strengths and weaknesses and external opportunities and threats to map its competitive position, growth drivers, operational gaps, and market risks.

 Customizable Excel Spreadsheet
Provides a concise, editable SWOT matrix tailored to Suretank Group for fast strategic alignment and stakeholder-ready summaries.
Weaknesses

Exposure to oil and gas cycles
Suretank’s heavy exposure to oil and gas ties revenue to cyclicality: offshore capex cuts by operators directly suppress demand for CCUs, with Rystad Energy reporting global upstream investment fell to about $520bn in 2024, leading to widespread project deferrals that can stall orders for multiple quarters and tighten revenue visibility when exploration slows; reliance on one sector therefore heightens quarter-to-quarter volatility.
Capital- and asset-intensive manufacturing
Heavy fabrication ties Suretank to costly facilities, skilled labor pools, and specialized QA equipment, inflating capital requirements. High fixed costs magnify margin pressure during demand downturns, making breakeven sensitive to volume. Capacity utilization thus becomes the critical profit lever, while scaling production up or down remains slow and expensive.

Complex, time-consuming certifications
Compliance obligations demand additional engineering hours, extensive documentation, and third-party inspections, increasing delivery lead times and complicating fast-turn requests. Lengthened lead times and any rework to meet standards erode margins and reduce predictability. Smaller, bespoke orders further strain throughput and tie up capacity that could service higher-margin batch work.

Customization can inflate costs and lead times
- Lower economies of scale
- 30–40% SKU/inventory growth
- Scheduling and supplier strain
- Price realization < cost build
Logistics challenges for bulky, heavy units
- Specialized transport, permitting, port handling
- Freight volatility (~60% vs 2021 peaks) impacts margins
- Remote offshore coordination and weather risk
- High after‑sales mobilization costs
Oil-service revenue exposed to upstream; spend $520bn, customization +25%, freight -60%
Suretank’s revenue is concentrated in oil & gas, leaving demand tied to upstream cyclicality after global upstream investment fell to about $520bn in 2024 (Rystad). Heavy fabrication drives high fixed costs, making breakeven sensitive to utilization. Customization raises unit costs up to 25% and SKUs by 30–40%, while bulky logistics and freight volatility (‑60% vs 2021 peaks) pressure margins.
| Metric | Value |
|---|---|
| Upstream investment (2024) | $520bn |
| Customization cost uplift | up to 25% |
| SKU/inventory growth | 30–40% |
| Freight change vs 2021 peaks | ≈‑60% |
Full Version Awaits
Suretank Group SWOT Analysis
This is the actual SWOT analysis you'll receive upon purchase—no surprises, just professional quality. The preview below is taken directly from the full SWOT report; purchase unlocks the complete, editable version. The document is structured, ready to use, and becomes available immediately after checkout.

Make Insightful Decisions Backed by Expert Research
Discover how Suretank Group stacks up against competitors with our concise SWOT overview—highlighting core strengths, market risks, and growth levers in 3–5 clear points. Want the full strategic picture? Purchase the complete SWOT for a research-backed, editable Word and Excel package to plan, pitch, or invest with confidence.
Strengths
Deep offshore container expertise
Decades of focused CCU development for offshore use have built hard-to-replicate know-how in Suretank Group; engineering teams deeply understand load dynamics, corrosion and handling risks unique to rigs and vessels, accelerating problem-solving on complex specs and enabling a premium pricing position versus generic fabricators.
Strong certification and compliance track record
Products built to DNV and ISO standards (ISO 9001 recertification cycles typically every three years) reduce procurement friction for global operators. Proven certification pathways lower client risk and make audits predictable, cutting TCO by reducing unplanned compliance costs. This enhances acceptance across majors and service companies that mandate such certifications.
Rugged, reliable designs for harsh environments
Suretank units are engineered to withstand extreme weather, shock, and corrosion, delivering high durability that cuts downtime and replacement frequency in offshore logistics.
Industry data shows corrosion costs the global economy about $2.5 trillion annually (NACE, 2016), underscoring value of robust, corrosion-resistant equipment.
Proven reliability meets HSE-driven procurement criteria, driving repeat orders and longer lifecycle value for operators.
Global applicability across liquids, gases, solids
Suretank Group's portfolio supports liquids, gases and solids across safety classes, enabling buyers to standardize on a single vendor for mixed-material fleets and raising cross‑sell potential as customers expand operations; this breadth provides revenue smoothing through demand shifts between sectors.
- Standardization: single-vendor across media
- Cross-sell: higher lifetime customer value
- Resilience: mix-based revenue stability
Ability to serve adjacent sectors
Specialized container engineering transfers to chemical, pharma, mining and defense, leveraging certified safe storage and transport to enter higher-margin niches; global pharmaceutical sales reached about 1.61 trillion USD in 2024, highlighting scale of adjacent demand.
Diversification buffers oil and gas cyclicality and lets tailored variants extend addressable market without diluting core competence.
- Certified tech repurposed
- Pharma market $1.61T (2024)
- Buffers sector cyclicality
- Higher-margin niches
DNV/ISO CCU: faster specs-to-deploy, lower TCO; corrosion $2.5T
Decades of CCU offshore engineering create hard-to-replicate know-how, enabling premium pricing and faster specs-to-deploy versus generic fabricators. DNV/ISO-certified production (ISO 9001 recert ~3-year cycle) lowers procurement friction and TCO; corrosion-resistant designs cut downtime—relevant given NACE estimate of $2.5T annual corrosion cost. Portfolio spans liquids, gases, solids, supporting cross-sell into $1.61T pharma (2024).
| Metric | Value |
|---|---|
| Certifications | DNV, ISO 9001 |
| ISO recert cycle | ~3 years |
| Corrosion cost (NACE) | $2.5T (2016) |
| Pharma market | $1.61T (2024) |
What is included in the product
Detailed Word Document
Provides a clear SWOT framework analyzing Suretank Group’s internal strengths and weaknesses and external opportunities and threats to map its competitive position, growth drivers, operational gaps, and market risks.
Customizable Excel Spreadsheet
Provides a concise, editable SWOT matrix tailored to Suretank Group for fast strategic alignment and stakeholder-ready summaries.
Weaknesses
Exposure to oil and gas cycles
Suretank’s heavy exposure to oil and gas ties revenue to cyclicality: offshore capex cuts by operators directly suppress demand for CCUs, with Rystad Energy reporting global upstream investment fell to about $520bn in 2024, leading to widespread project deferrals that can stall orders for multiple quarters and tighten revenue visibility when exploration slows; reliance on one sector therefore heightens quarter-to-quarter volatility.
Capital- and asset-intensive manufacturing
Heavy fabrication ties Suretank to costly facilities, skilled labor pools, and specialized QA equipment, inflating capital requirements. High fixed costs magnify margin pressure during demand downturns, making breakeven sensitive to volume. Capacity utilization thus becomes the critical profit lever, while scaling production up or down remains slow and expensive.
Complex, time-consuming certifications
Compliance obligations demand additional engineering hours, extensive documentation, and third-party inspections, increasing delivery lead times and complicating fast-turn requests. Lengthened lead times and any rework to meet standards erode margins and reduce predictability. Smaller, bespoke orders further strain throughput and tie up capacity that could service higher-margin batch work.
Customization can inflate costs and lead times
- Lower economies of scale
- 30–40% SKU/inventory growth
- Scheduling and supplier strain
- Price realization < cost build
Logistics challenges for bulky, heavy units
- Specialized transport, permitting, port handling
- Freight volatility (~60% vs 2021 peaks) impacts margins
- Remote offshore coordination and weather risk
- High after‑sales mobilization costs
Oil-service revenue exposed to upstream; spend $520bn, customization +25%, freight -60%
Suretank’s revenue is concentrated in oil & gas, leaving demand tied to upstream cyclicality after global upstream investment fell to about $520bn in 2024 (Rystad). Heavy fabrication drives high fixed costs, making breakeven sensitive to utilization. Customization raises unit costs up to 25% and SKUs by 30–40%, while bulky logistics and freight volatility (‑60% vs 2021 peaks) pressure margins.
| Metric | Value |
|---|---|
| Upstream investment (2024) | $520bn |
| Customization cost uplift | up to 25% |
| SKU/inventory growth | 30–40% |
| Freight change vs 2021 peaks | ≈‑60% |
Full Version Awaits
Suretank Group SWOT Analysis
This is the actual SWOT analysis you'll receive upon purchase—no surprises, just professional quality. The preview below is taken directly from the full SWOT report; purchase unlocks the complete, editable version. The document is structured, ready to use, and becomes available immediately after checkout.
Description
Make Insightful Decisions Backed by Expert Research
Discover how Suretank Group stacks up against competitors with our concise SWOT overview—highlighting core strengths, market risks, and growth levers in 3–5 clear points. Want the full strategic picture? Purchase the complete SWOT for a research-backed, editable Word and Excel package to plan, pitch, or invest with confidence.
Strengths
Deep offshore container expertise
Decades of focused CCU development for offshore use have built hard-to-replicate know-how in Suretank Group; engineering teams deeply understand load dynamics, corrosion and handling risks unique to rigs and vessels, accelerating problem-solving on complex specs and enabling a premium pricing position versus generic fabricators.
Strong certification and compliance track record
Products built to DNV and ISO standards (ISO 9001 recertification cycles typically every three years) reduce procurement friction for global operators. Proven certification pathways lower client risk and make audits predictable, cutting TCO by reducing unplanned compliance costs. This enhances acceptance across majors and service companies that mandate such certifications.
Rugged, reliable designs for harsh environments
Suretank units are engineered to withstand extreme weather, shock, and corrosion, delivering high durability that cuts downtime and replacement frequency in offshore logistics.
Industry data shows corrosion costs the global economy about $2.5 trillion annually (NACE, 2016), underscoring value of robust, corrosion-resistant equipment.
Proven reliability meets HSE-driven procurement criteria, driving repeat orders and longer lifecycle value for operators.
Global applicability across liquids, gases, solids
Suretank Group's portfolio supports liquids, gases and solids across safety classes, enabling buyers to standardize on a single vendor for mixed-material fleets and raising cross‑sell potential as customers expand operations; this breadth provides revenue smoothing through demand shifts between sectors.
- Standardization: single-vendor across media
- Cross-sell: higher lifetime customer value
- Resilience: mix-based revenue stability
Ability to serve adjacent sectors
Specialized container engineering transfers to chemical, pharma, mining and defense, leveraging certified safe storage and transport to enter higher-margin niches; global pharmaceutical sales reached about 1.61 trillion USD in 2024, highlighting scale of adjacent demand.
Diversification buffers oil and gas cyclicality and lets tailored variants extend addressable market without diluting core competence.
- Certified tech repurposed
- Pharma market $1.61T (2024)
- Buffers sector cyclicality
- Higher-margin niches
DNV/ISO CCU: faster specs-to-deploy, lower TCO; corrosion $2.5T
Decades of CCU offshore engineering create hard-to-replicate know-how, enabling premium pricing and faster specs-to-deploy versus generic fabricators. DNV/ISO-certified production (ISO 9001 recert ~3-year cycle) lowers procurement friction and TCO; corrosion-resistant designs cut downtime—relevant given NACE estimate of $2.5T annual corrosion cost. Portfolio spans liquids, gases, solids, supporting cross-sell into $1.61T pharma (2024).
| Metric | Value |
|---|---|
| Certifications | DNV, ISO 9001 |
| ISO recert cycle | ~3 years |
| Corrosion cost (NACE) | $2.5T (2016) |
| Pharma market | $1.61T (2024) |
What is included in the product
Detailed Word Document
Provides a clear SWOT framework analyzing Suretank Group’s internal strengths and weaknesses and external opportunities and threats to map its competitive position, growth drivers, operational gaps, and market risks.
Customizable Excel Spreadsheet
Provides a concise, editable SWOT matrix tailored to Suretank Group for fast strategic alignment and stakeholder-ready summaries.
Weaknesses
Exposure to oil and gas cycles
Suretank’s heavy exposure to oil and gas ties revenue to cyclicality: offshore capex cuts by operators directly suppress demand for CCUs, with Rystad Energy reporting global upstream investment fell to about $520bn in 2024, leading to widespread project deferrals that can stall orders for multiple quarters and tighten revenue visibility when exploration slows; reliance on one sector therefore heightens quarter-to-quarter volatility.
Capital- and asset-intensive manufacturing
Heavy fabrication ties Suretank to costly facilities, skilled labor pools, and specialized QA equipment, inflating capital requirements. High fixed costs magnify margin pressure during demand downturns, making breakeven sensitive to volume. Capacity utilization thus becomes the critical profit lever, while scaling production up or down remains slow and expensive.
Complex, time-consuming certifications
Compliance obligations demand additional engineering hours, extensive documentation, and third-party inspections, increasing delivery lead times and complicating fast-turn requests. Lengthened lead times and any rework to meet standards erode margins and reduce predictability. Smaller, bespoke orders further strain throughput and tie up capacity that could service higher-margin batch work.
Customization can inflate costs and lead times
- Lower economies of scale
- 30–40% SKU/inventory growth
- Scheduling and supplier strain
- Price realization < cost build
Logistics challenges for bulky, heavy units
- Specialized transport, permitting, port handling
- Freight volatility (~60% vs 2021 peaks) impacts margins
- Remote offshore coordination and weather risk
- High after‑sales mobilization costs
Oil-service revenue exposed to upstream; spend $520bn, customization +25%, freight -60%
Suretank’s revenue is concentrated in oil & gas, leaving demand tied to upstream cyclicality after global upstream investment fell to about $520bn in 2024 (Rystad). Heavy fabrication drives high fixed costs, making breakeven sensitive to utilization. Customization raises unit costs up to 25% and SKUs by 30–40%, while bulky logistics and freight volatility (‑60% vs 2021 peaks) pressure margins.
| Metric | Value |
|---|---|
| Upstream investment (2024) | $520bn |
| Customization cost uplift | up to 25% |
| SKU/inventory growth | 30–40% |
| Freight change vs 2021 peaks | ≈‑60% |
Full Version Awaits
Suretank Group SWOT Analysis
This is the actual SWOT analysis you'll receive upon purchase—no surprises, just professional quality. The preview below is taken directly from the full SWOT report; purchase unlocks the complete, editable version. The document is structured, ready to use, and becomes available immediately after checkout.











