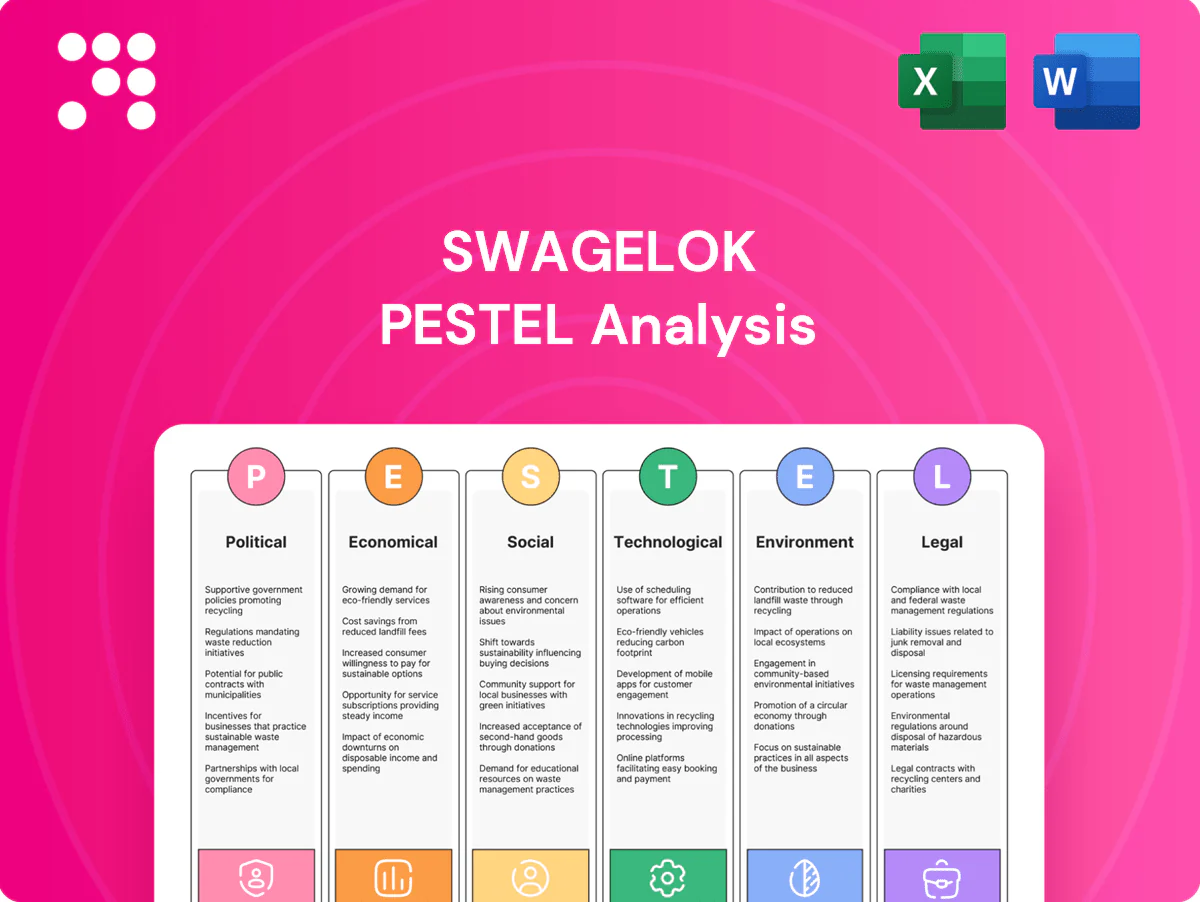
Swagelok PESTLE Analysis

Your Competitive Advantage Starts with This Report
Gain strategic clarity with our PESTLE Analysis of Swagelok—identifying political, economic, social, technological, legal and environmental forces that will shape its trajectory. Use our insights to anticipate risks and pinpoint growth opportunities. Ready-made and fully editable for fast integration into pitches and plans. Buy the full report now for instant, actionable intelligence.
Political factors

Trade policy and tariffs
Swagelok’s global supply chain and customer base are exposed to shifting tariffs such as the US Section 232 levies (25% on steel, 10% on aluminum) that directly raise landed costs and compress pricing power. Recent export controls (2023–25) on advanced components heighten risk to high‑spec parts. Proactive sourcing diversification and local assembly reduce this volatility and protect margins.
Energy geopolitics
Oil and gas capex remains highly sensitive to geopolitical stability in producing regions, with investment swings since 2022 after major conflicts and sanctions; supply-chain disruptions and restricted sales to sanctioned entities continue to reshape project planning. Energy security drives LNG, hydrogen and midstream investments—global LNG FIDs and hydrogen project announcements rose notably through 2024. Swagelok can target resilient midstream and sanctioned-compliant markets, aligning product lines to LNG and hydrogen supply chains.

Industrial policy incentives
Government incentives for semiconductors (CHIPS Act $52.7B), clean energy (Inflation Reduction Act ~$369B) and reshoring lift demand for high-purity, high-reliability fluid systems. Grants, tax credits and procurement preferences shift where customers build capacity. Aligning with local-content/Buy American rules boosts competitiveness for public contracts. Participation in public-funded projects requires readiness on quality, traceability and reporting.

Regulatory alignment across regions
Divergent standards such as EU Pressure Equipment Directive 2014/68/EU, ASME codes (eg B31.3) in the US and China GB/CCC requirements complicate Swagelok product certification and documentation, increasing approval steps and lead times. Political shifts in the US, EU or Asia can accelerate amendments to pressure equipment and safety directives, requiring rapid label and design updates. Maintaining multi-region approvals reduces sales friction across more than 70 markets where Swagelok sells.
- Tags: regulatory, PED 2014/68/EU, ASME, GB/CCC
- Impact: multi-region approvals cut export barriers
- Action: continuous policy monitoring for timely updates
Defense and critical infrastructure
Designation of defense and critical infrastructure sectors tightens procurement and cybersecurity requirements; global military expenditure reached about 2.24 trillion USD in 2023 (SIPRI), driving cyclic demand that benefits specialized fittings and valves. Political focus on supply-chain resilience favors trusted, traceable suppliers; Swagelok’s quality and traceability position it to capture elevated defense-related orders.
- Critical sector rules raise cybersecurity and traceability requirements
- Global military spend ~2.24 trillion USD (2023)
- Defense cycles boost demand for specialized valves/fittings
- Traceable, certified suppliers like Swagelok gain procurement preference
Tariffs, export controls and incentives reshape high-purity systems demand and certification burdens
Shifting tariffs (US Sec.232: 25% steel/10% Al) and 2023–25 export controls raise landed costs and restrict advanced‑parts sales. Large public incentives (CHIPS $52.7B; IRA ~$369B) and rising LNG/hydrogen FIDs through 2024 boost demand for high‑purity systems. Military spend (~2.24T USD in 2023) and divergent standards (PED/ASME/GB) increase certification and traceability burdens.
| Tag | Metric | Implication |
|---|---|---|
| Tariffs | 25% steel / 10% Al | Higher costs |
| Incentives | CHIPS $52.7B; IRA ~$369B | Demand lift |
| Defense | $2.24T (2023) | Procurement opportunities |
| Standards | PED/ASME/GB | More approvals |
What is included in the product
 Detailed Word Document
Explores how Political, Economic, Social, Technological, Environmental, and Legal forces uniquely affect Swagelok, using industry-specific data and current trends to map risks and opportunities. Designed for executives and advisors, it delivers forward-looking insights and actionable scenarios for strategy, compliance, and investor communication.

 Customizable Excel Spreadsheet
Concise, visually segmented Swagelok PESTLE summary that relieves briefing pain points by providing an editable, shareable snapshot for quick alignment across teams and seamless inclusion in presentations or strategy packs.
Economic factors

Capex cycles in end markets
Demand for Swagelok products closely follows capex cycles in oil and gas, chemicals, power and semiconductors; upturns lift orders for valves, regulators and assemblies while downturns elongate sales cycles. A balanced industry portfolio smooths revenue cyclicality and reduces exposure to any single sector shock. Forecasting tied to PMI trends and capex indicators supports capacity planning and inventory timing.
Commodity and input costs
Stainless steel, nickel alloys and elastomers are the largest drivers of Swagelok’s COGS, with metal input swings — nickel prices swung over 50% between 2022–24 — creating margin pressure. Price volatility requires agile pricing and hedging programs; supplier partnerships and value engineering have cut input cost exposure for peers by double-digit percentages. Transparent surcharge mechanisms have been used industry-wide to preserve profitability during raw-material spikes.

Currency fluctuations
Global sales expose Swagelok to FX translation and transaction risk, as earnings booked in foreign currencies can shift when converted to the home currency. A strong home currency can compress overseas demand and reduce reported results in US-dollar terms. Natural hedging through local sourcing and local-currency invoicing mitigates some exposure. Financial hedges, such as forwards and options, are used to protect major contract backlogs.

Distributor network economics
Swagelok’s channel model relies on independent sales and service centers that add local technical value but require consistent margin structures and incentives to remain solvent under pressure. Economic stress tightens distributor liquidity and inflates inventory carrying costs, risking service gaps. Vendor-managed inventory and data-sharing programs empirically reduce inventory 20–30% and can halve stockouts, stabilizing throughput.
- Independent centers: local value, need consistent margins
- Stress impact: liquidity and higher carrying costs
- VMI/data-sharing: inventory down 20–30%, stockouts -50%
Customer cost-of-failure calculus
In critical applications where unplanned downtime can cost $100,000–$400,000 per hour (ARC Advisory Group 2024 range), customers economically justify higher-priced, reliable components with lifecycle support; showing a 30–60% reduction in failure-related costs strengthens Swagelok pricing power and win rates. Service, training and contracts raise customer stickiness and help pass budget scrutiny, with service-linked retention improvements of ~15–25% (McKinsey 2024).
- Downtime cost range: $100k–$400k/hr (ARC 2024)
- Failure-cost reduction: 30–60%
- Retention lift via service: ~15–25% (McKinsey 2024)
Tariffs, export controls and incentives reshape high-purity systems demand and certification burdens
Demand tracks capex in oil & gas, chemicals, power and semiconductors, smoothing via a diversified portfolio; PMI and capex indicators guide capacity and inventory. Raw-material swings (nickel ±50% 2022–24) and FX/driving margins force dynamic pricing, hedging and supplier programs. Service/VMI lift retention ~15–25% and cut inventory 20–30%, supporting pricing power against downtime costs of $100k–$400k/hr (ARC 2024).
| Metric | 2022–25/Source |
|---|---|
| Nickel price swing | ±50% (2022–24) |
| Downtime cost | $100k–$400k/hr (ARC 2024) |
| Inventory reduction (VMI) | 20–30% |
| Retention lift (service) | ~15–25% (McKinsey 2024) |
Same Document Delivered
Swagelok PESTLE Analysis
The preview shown here is the exact Swagelok PESTLE Analysis document you’ll receive after purchase—fully formatted and ready to use. This is the real, finished file with no placeholders or surprises. The layout, content, and structure visible here are exactly what you’ll download immediately after payment.

Your Competitive Advantage Starts with This Report
Gain strategic clarity with our PESTLE Analysis of Swagelok—identifying political, economic, social, technological, legal and environmental forces that will shape its trajectory. Use our insights to anticipate risks and pinpoint growth opportunities. Ready-made and fully editable for fast integration into pitches and plans. Buy the full report now for instant, actionable intelligence.
Political factors
Trade policy and tariffs
Swagelok’s global supply chain and customer base are exposed to shifting tariffs such as the US Section 232 levies (25% on steel, 10% on aluminum) that directly raise landed costs and compress pricing power. Recent export controls (2023–25) on advanced components heighten risk to high‑spec parts. Proactive sourcing diversification and local assembly reduce this volatility and protect margins.
Energy geopolitics
Oil and gas capex remains highly sensitive to geopolitical stability in producing regions, with investment swings since 2022 after major conflicts and sanctions; supply-chain disruptions and restricted sales to sanctioned entities continue to reshape project planning. Energy security drives LNG, hydrogen and midstream investments—global LNG FIDs and hydrogen project announcements rose notably through 2024. Swagelok can target resilient midstream and sanctioned-compliant markets, aligning product lines to LNG and hydrogen supply chains.
Industrial policy incentives
Government incentives for semiconductors (CHIPS Act $52.7B), clean energy (Inflation Reduction Act ~$369B) and reshoring lift demand for high-purity, high-reliability fluid systems. Grants, tax credits and procurement preferences shift where customers build capacity. Aligning with local-content/Buy American rules boosts competitiveness for public contracts. Participation in public-funded projects requires readiness on quality, traceability and reporting.
Regulatory alignment across regions
Divergent standards such as EU Pressure Equipment Directive 2014/68/EU, ASME codes (eg B31.3) in the US and China GB/CCC requirements complicate Swagelok product certification and documentation, increasing approval steps and lead times. Political shifts in the US, EU or Asia can accelerate amendments to pressure equipment and safety directives, requiring rapid label and design updates. Maintaining multi-region approvals reduces sales friction across more than 70 markets where Swagelok sells.
- Tags: regulatory, PED 2014/68/EU, ASME, GB/CCC
- Impact: multi-region approvals cut export barriers
- Action: continuous policy monitoring for timely updates
Defense and critical infrastructure
Designation of defense and critical infrastructure sectors tightens procurement and cybersecurity requirements; global military expenditure reached about 2.24 trillion USD in 2023 (SIPRI), driving cyclic demand that benefits specialized fittings and valves. Political focus on supply-chain resilience favors trusted, traceable suppliers; Swagelok’s quality and traceability position it to capture elevated defense-related orders.
- Critical sector rules raise cybersecurity and traceability requirements
- Global military spend ~2.24 trillion USD (2023)
- Defense cycles boost demand for specialized valves/fittings
- Traceable, certified suppliers like Swagelok gain procurement preference
Tariffs, export controls and incentives reshape high-purity systems demand and certification burdens
Shifting tariffs (US Sec.232: 25% steel/10% Al) and 2023–25 export controls raise landed costs and restrict advanced‑parts sales. Large public incentives (CHIPS $52.7B; IRA ~$369B) and rising LNG/hydrogen FIDs through 2024 boost demand for high‑purity systems. Military spend (~2.24T USD in 2023) and divergent standards (PED/ASME/GB) increase certification and traceability burdens.
| Tag | Metric | Implication |
|---|---|---|
| Tariffs | 25% steel / 10% Al | Higher costs |
| Incentives | CHIPS $52.7B; IRA ~$369B | Demand lift |
| Defense | $2.24T (2023) | Procurement opportunities |
| Standards | PED/ASME/GB | More approvals |
What is included in the product
Detailed Word Document
Explores how Political, Economic, Social, Technological, Environmental, and Legal forces uniquely affect Swagelok, using industry-specific data and current trends to map risks and opportunities. Designed for executives and advisors, it delivers forward-looking insights and actionable scenarios for strategy, compliance, and investor communication.
Customizable Excel Spreadsheet
Concise, visually segmented Swagelok PESTLE summary that relieves briefing pain points by providing an editable, shareable snapshot for quick alignment across teams and seamless inclusion in presentations or strategy packs.
Economic factors
Capex cycles in end markets
Demand for Swagelok products closely follows capex cycles in oil and gas, chemicals, power and semiconductors; upturns lift orders for valves, regulators and assemblies while downturns elongate sales cycles. A balanced industry portfolio smooths revenue cyclicality and reduces exposure to any single sector shock. Forecasting tied to PMI trends and capex indicators supports capacity planning and inventory timing.
Commodity and input costs
Stainless steel, nickel alloys and elastomers are the largest drivers of Swagelok’s COGS, with metal input swings — nickel prices swung over 50% between 2022–24 — creating margin pressure. Price volatility requires agile pricing and hedging programs; supplier partnerships and value engineering have cut input cost exposure for peers by double-digit percentages. Transparent surcharge mechanisms have been used industry-wide to preserve profitability during raw-material spikes.
Currency fluctuations
Global sales expose Swagelok to FX translation and transaction risk, as earnings booked in foreign currencies can shift when converted to the home currency. A strong home currency can compress overseas demand and reduce reported results in US-dollar terms. Natural hedging through local sourcing and local-currency invoicing mitigates some exposure. Financial hedges, such as forwards and options, are used to protect major contract backlogs.
Distributor network economics
Swagelok’s channel model relies on independent sales and service centers that add local technical value but require consistent margin structures and incentives to remain solvent under pressure. Economic stress tightens distributor liquidity and inflates inventory carrying costs, risking service gaps. Vendor-managed inventory and data-sharing programs empirically reduce inventory 20–30% and can halve stockouts, stabilizing throughput.
- Independent centers: local value, need consistent margins
- Stress impact: liquidity and higher carrying costs
- VMI/data-sharing: inventory down 20–30%, stockouts -50%
Customer cost-of-failure calculus
In critical applications where unplanned downtime can cost $100,000–$400,000 per hour (ARC Advisory Group 2024 range), customers economically justify higher-priced, reliable components with lifecycle support; showing a 30–60% reduction in failure-related costs strengthens Swagelok pricing power and win rates. Service, training and contracts raise customer stickiness and help pass budget scrutiny, with service-linked retention improvements of ~15–25% (McKinsey 2024).
- Downtime cost range: $100k–$400k/hr (ARC 2024)
- Failure-cost reduction: 30–60%
- Retention lift via service: ~15–25% (McKinsey 2024)
Tariffs, export controls and incentives reshape high-purity systems demand and certification burdens
Demand tracks capex in oil & gas, chemicals, power and semiconductors, smoothing via a diversified portfolio; PMI and capex indicators guide capacity and inventory. Raw-material swings (nickel ±50% 2022–24) and FX/driving margins force dynamic pricing, hedging and supplier programs. Service/VMI lift retention ~15–25% and cut inventory 20–30%, supporting pricing power against downtime costs of $100k–$400k/hr (ARC 2024).
| Metric | 2022–25/Source |
|---|---|
| Nickel price swing | ±50% (2022–24) |
| Downtime cost | $100k–$400k/hr (ARC 2024) |
| Inventory reduction (VMI) | 20–30% |
| Retention lift (service) | ~15–25% (McKinsey 2024) |
Same Document Delivered
Swagelok PESTLE Analysis
The preview shown here is the exact Swagelok PESTLE Analysis document you’ll receive after purchase—fully formatted and ready to use. This is the real, finished file with no placeholders or surprises. The layout, content, and structure visible here are exactly what you’ll download immediately after payment.
Description
Your Competitive Advantage Starts with This Report
Gain strategic clarity with our PESTLE Analysis of Swagelok—identifying political, economic, social, technological, legal and environmental forces that will shape its trajectory. Use our insights to anticipate risks and pinpoint growth opportunities. Ready-made and fully editable for fast integration into pitches and plans. Buy the full report now for instant, actionable intelligence.
Political factors
Trade policy and tariffs
Swagelok’s global supply chain and customer base are exposed to shifting tariffs such as the US Section 232 levies (25% on steel, 10% on aluminum) that directly raise landed costs and compress pricing power. Recent export controls (2023–25) on advanced components heighten risk to high‑spec parts. Proactive sourcing diversification and local assembly reduce this volatility and protect margins.
Energy geopolitics
Oil and gas capex remains highly sensitive to geopolitical stability in producing regions, with investment swings since 2022 after major conflicts and sanctions; supply-chain disruptions and restricted sales to sanctioned entities continue to reshape project planning. Energy security drives LNG, hydrogen and midstream investments—global LNG FIDs and hydrogen project announcements rose notably through 2024. Swagelok can target resilient midstream and sanctioned-compliant markets, aligning product lines to LNG and hydrogen supply chains.
Industrial policy incentives
Government incentives for semiconductors (CHIPS Act $52.7B), clean energy (Inflation Reduction Act ~$369B) and reshoring lift demand for high-purity, high-reliability fluid systems. Grants, tax credits and procurement preferences shift where customers build capacity. Aligning with local-content/Buy American rules boosts competitiveness for public contracts. Participation in public-funded projects requires readiness on quality, traceability and reporting.
Regulatory alignment across regions
Divergent standards such as EU Pressure Equipment Directive 2014/68/EU, ASME codes (eg B31.3) in the US and China GB/CCC requirements complicate Swagelok product certification and documentation, increasing approval steps and lead times. Political shifts in the US, EU or Asia can accelerate amendments to pressure equipment and safety directives, requiring rapid label and design updates. Maintaining multi-region approvals reduces sales friction across more than 70 markets where Swagelok sells.
- Tags: regulatory, PED 2014/68/EU, ASME, GB/CCC
- Impact: multi-region approvals cut export barriers
- Action: continuous policy monitoring for timely updates
Defense and critical infrastructure
Designation of defense and critical infrastructure sectors tightens procurement and cybersecurity requirements; global military expenditure reached about 2.24 trillion USD in 2023 (SIPRI), driving cyclic demand that benefits specialized fittings and valves. Political focus on supply-chain resilience favors trusted, traceable suppliers; Swagelok’s quality and traceability position it to capture elevated defense-related orders.
- Critical sector rules raise cybersecurity and traceability requirements
- Global military spend ~2.24 trillion USD (2023)
- Defense cycles boost demand for specialized valves/fittings
- Traceable, certified suppliers like Swagelok gain procurement preference
Tariffs, export controls and incentives reshape high-purity systems demand and certification burdens
Shifting tariffs (US Sec.232: 25% steel/10% Al) and 2023–25 export controls raise landed costs and restrict advanced‑parts sales. Large public incentives (CHIPS $52.7B; IRA ~$369B) and rising LNG/hydrogen FIDs through 2024 boost demand for high‑purity systems. Military spend (~2.24T USD in 2023) and divergent standards (PED/ASME/GB) increase certification and traceability burdens.
| Tag | Metric | Implication |
|---|---|---|
| Tariffs | 25% steel / 10% Al | Higher costs |
| Incentives | CHIPS $52.7B; IRA ~$369B | Demand lift |
| Defense | $2.24T (2023) | Procurement opportunities |
| Standards | PED/ASME/GB | More approvals |
What is included in the product
Detailed Word Document
Explores how Political, Economic, Social, Technological, Environmental, and Legal forces uniquely affect Swagelok, using industry-specific data and current trends to map risks and opportunities. Designed for executives and advisors, it delivers forward-looking insights and actionable scenarios for strategy, compliance, and investor communication.
Customizable Excel Spreadsheet
Concise, visually segmented Swagelok PESTLE summary that relieves briefing pain points by providing an editable, shareable snapshot for quick alignment across teams and seamless inclusion in presentations or strategy packs.
Economic factors
Capex cycles in end markets
Demand for Swagelok products closely follows capex cycles in oil and gas, chemicals, power and semiconductors; upturns lift orders for valves, regulators and assemblies while downturns elongate sales cycles. A balanced industry portfolio smooths revenue cyclicality and reduces exposure to any single sector shock. Forecasting tied to PMI trends and capex indicators supports capacity planning and inventory timing.
Commodity and input costs
Stainless steel, nickel alloys and elastomers are the largest drivers of Swagelok’s COGS, with metal input swings — nickel prices swung over 50% between 2022–24 — creating margin pressure. Price volatility requires agile pricing and hedging programs; supplier partnerships and value engineering have cut input cost exposure for peers by double-digit percentages. Transparent surcharge mechanisms have been used industry-wide to preserve profitability during raw-material spikes.
Currency fluctuations
Global sales expose Swagelok to FX translation and transaction risk, as earnings booked in foreign currencies can shift when converted to the home currency. A strong home currency can compress overseas demand and reduce reported results in US-dollar terms. Natural hedging through local sourcing and local-currency invoicing mitigates some exposure. Financial hedges, such as forwards and options, are used to protect major contract backlogs.
Distributor network economics
Swagelok’s channel model relies on independent sales and service centers that add local technical value but require consistent margin structures and incentives to remain solvent under pressure. Economic stress tightens distributor liquidity and inflates inventory carrying costs, risking service gaps. Vendor-managed inventory and data-sharing programs empirically reduce inventory 20–30% and can halve stockouts, stabilizing throughput.
- Independent centers: local value, need consistent margins
- Stress impact: liquidity and higher carrying costs
- VMI/data-sharing: inventory down 20–30%, stockouts -50%
Customer cost-of-failure calculus
In critical applications where unplanned downtime can cost $100,000–$400,000 per hour (ARC Advisory Group 2024 range), customers economically justify higher-priced, reliable components with lifecycle support; showing a 30–60% reduction in failure-related costs strengthens Swagelok pricing power and win rates. Service, training and contracts raise customer stickiness and help pass budget scrutiny, with service-linked retention improvements of ~15–25% (McKinsey 2024).
- Downtime cost range: $100k–$400k/hr (ARC 2024)
- Failure-cost reduction: 30–60%
- Retention lift via service: ~15–25% (McKinsey 2024)
Tariffs, export controls and incentives reshape high-purity systems demand and certification burdens
Demand tracks capex in oil & gas, chemicals, power and semiconductors, smoothing via a diversified portfolio; PMI and capex indicators guide capacity and inventory. Raw-material swings (nickel ±50% 2022–24) and FX/driving margins force dynamic pricing, hedging and supplier programs. Service/VMI lift retention ~15–25% and cut inventory 20–30%, supporting pricing power against downtime costs of $100k–$400k/hr (ARC 2024).
| Metric | 2022–25/Source |
|---|---|
| Nickel price swing | ±50% (2022–24) |
| Downtime cost | $100k–$400k/hr (ARC 2024) |
| Inventory reduction (VMI) | 20–30% |
| Retention lift (service) | ~15–25% (McKinsey 2024) |
Same Document Delivered
Swagelok PESTLE Analysis
The preview shown here is the exact Swagelok PESTLE Analysis document you’ll receive after purchase—fully formatted and ready to use. This is the real, finished file with no placeholders or surprises. The layout, content, and structure visible here are exactly what you’ll download immediately after payment.











